Here, we present a protocol to capture RNA-associated chromatin DNA-DNA interactions for mapping RNA-related three-dimensional genome organization.
Method Article
RNA-Associated Chromatin DNA-DNA Interaction Method
In This Article
Summary
Abstract
RNA-Associated Chromatin DNA-DNA Interaction Method (RDD) is a targeted strategy for mapping chromatin interactions anchored by a specific RNA. It simultaneously identifies genomic loci associated with the RNA of interest and resolves long-range DNA-DNA contacts among these loci, enabling inference of spatial organization and regulatory relationships. In RDD, biotinylated antisense probes complementary to the target RNA are used to enrich RNA-chromatin complexes. Cells are crosslinked, chromatin is fragmented and end-repaired, and proximity ligation is performed using a designed linker to join DNA fragments that are spatially adjacent within the captured complexes. The ligation products are purified, converted into sequencing libraries, and analyzed by high-throughput sequencing to generate RNA-anchored interaction maps. RDD is applicable to endogenous RNAs as well as exogenous RNAs derived from host-infecting microorganisms and viruses, and it is compatible with diverse cell types and experimental conditions. The method yields locus-specific, high-resolution contact profiles suitable for dissecting enhancer-promoter pairing, long-range regulation, and three-dimensional genome architecture associated with regulatory coding and non-coding RNAs. By integrating biochemical enrichment with proximity ligation and next-generation sequencing, RDD provides a robust and reproducible workflow to reveal how RNAs organize chromatin and influence gene expression.
Introduction
Hi-C and ChIA-PET have transformed studies of three-dimensional (3D) genome organization by converting spatial proximity among chromatin fragments into covalent DNA junctions that can be sequenced to infer physical contacts across scales from loops to compartments1,2. Beyond proteins, numerous RNAs participate in chromatin interactions, influencing enhancer/repressor-promoter communication and higher-order chromatin organization3; however, despite advances in protein-anchored assays, it remains challenging to determine directly how a specific RNA organizes long-range DNA-DNA interactions among its bound loci. The overarching goal of the RNA-Associated Chromatin DNA-DNA Interaction Method (RDD)4 is to generate high-resolution, RNA-anchored chromatin interaction maps that reveal how a defined RNA species associates with chromatin and orchestrates DNA-DNA contacts within its local neighborhood, enabling mechanistic inference about enhancer/repressor-promoter communication and higher-order genome architecture centered on that RNA5. Methodologically, RDD enriches crosslinked RNA-chromatin complexes with biotinylated antisense probes against the RNA of interest, performs on-complex proximity ligation with a designed linker to join spatially adjacent DNA fragments, and constructs sequencing libraries to yield locus-specific contact profiles suitable for hypothesis-driven analyses across diverse cell types and conditions, including contexts involving exogenous bacterial or viral RNAs in infected hosts. These features position RDD as an RNA-anchored counterpart to established chromosome-conformation methods, providing interpretable contact information at resolutions appropriate for regulatory analysis.
The rationale for RDD stems from limitations of existing RNA-chromatin mapping strategies. Targeted capture approaches such as ChIRP-seq and CHART-seq identify genome-wide DNA occupancy of a single RNA, a one RNA to all DNA paradigm that reports binding but not the physical DNA-DNA contacts among occupied loci6,7. Global assays, including GRID-seq and MARGI, have extended to all RNA to all DNA, cataloging RNA-DNA proximities genome-wide yet lacking explicit resolution of DNA-DNA contacts within RNA-centered complexes3,8. Multiplexed methods such as RD-SPRITE report higher-order co-localization among many RNAs and DNA loci and convey aspects of nuclear topology9, but signals are typically dominated by abundant RNAs, which can obscure low-abundance regulatory RNAs and limit targeted depth for a single RNA's interaction network. Protein- or mark-anchored enrichment-plus-ligation strategies, such as ChIA-PET10, PLAC-seq11, and HiChIP12, effectively map factor-centered loops but do not anchor interactions to a defined RNA without an RNA-specific capture module, leaving the RNA-anchored DNA-DNA dimension unresolved. By integrating targeted biochemical enrichment with on-complex proximity ligation, RDD directly captures DNA-DNA contacts among chromatin fragments co-occupied by the RNA of interest4, increases sensitivity and specificity for low- to moderate-abundance RNAs, and generates high-resolution, locus-specific contact maps that complement occupancy-centric (ChIRP/CHART)6,7 and proximity-centric global methods (GRID-seq/MARGI/RD-SPRITE)3,8,9 while conceptually paralleling protein factor-anchored ligation strategies (ChIA-PET/PLAC-seq/HiChIP)10,11,12. Readers should consider RDD when a biological question requires resolving spatial relationships among chromatin loci specifically associated with a target RNA -- particularly when that RNA is hypothesized to scaffold, bridge, or constrain long-range genomic interactions to tune transcription -- or when prioritizing putative regulatory targets from an RNA's binding set, distinguishing direct RNA-centered hubs from mere co-occupancy, delineating enhancer/repressor networks for specific RNAs, or tracking rewiring of RNA-anchored contacts across perturbations, developmental stages, or infections. In such scenarios, RDD addresses an unmet need by delivering RNA-anchored DNA-DNA interaction information with the sensitivity, specificity, and resolution required for rigorous mechanistic studies.
Protocol
NOTE: For this RDD method, the example system uses Drosophila S2 cells and both the roX2 and 7SK ncRNAs; reaction reagents are listed in Table 1, buffer compositions are in Table 2, reagent details and instrument details are in Materials . Figure 1 provides an overview of the protocol for RDD library generation. Procedures involving rotation (F8) use the following parameters: F8, 20 rpm, uu20, and UU30. For all buffers used from Step 2 to Step 10, freshly supplement with 1x proteinase inhibitor (PI) and RNase inhibitor (RI, 0.05 U/µL).
Probe design principles: For novel, unreported RNA, design probes online with the Stellaris Probe Designer, then filter out non-specific sequences using alignment tools (e.g., BLAST-like alignment) or UCSC BLAT, followed by 3′-biotinylation of the selected probes. For new target RNAs, design sequences that match the target RNA to serve as negative controls, also subjected to 3′-biotinylation. Quality control involves designing reverse transcription primers against the target RNA for transcription validation and genomic DNA-targeted primers for qPCR to assess contamination; include primers locating genomic binding sites and non-binding regions to evaluate binding specificity. roX2 and 7SK related probes are provided in Table 1.
1. Cell harvest and dual crosslinking
- Culture Drosophila S2 cells at 27 °C. Aim to collect a total of approximately 3 x 10⁹ cells. Resuspend the cells in the culture medium directly, and after Trypan-blue counting, aliquot 8 x 10⁸ cells into each 50-mL conical centrifuge tube.
- Mix 2 µL of cells with 8 µL of DPBS, add 10 µL of Trypan Blue, and then load onto the hemocytometer for cell counting.
NOTE: Drosophila S2 cells are presented as an example. Typically, 8 x 10⁸ cells correspond to approximately 40 mL of culture volume processed in a single 50-mL conical tube. Users can adjust culture conditions and harvest cell amounts according to the cell type used and the abundance of the target RNA.
- Mix 2 µL of cells with 8 µL of DPBS, add 10 µL of Trypan Blue, and then load onto the hemocytometer for cell counting.
- Add formaldehyde to a final concentration of 1% (w/v) and rotate at 27 °C for 20 min.
NOTE: Perform fixation at the culture temperature or at room temperature (RT; 20-25°C). Unless noted, rotate on mixer (F1, 12 rpm). For adherent cells, use an orbital shaker (50 rpm).
CAUTION: Formaldehyde is toxic; use a fume hood. - Pellet cells at 845 x g for 5 min at RT; discard supernatant to the appropriate chemical/biological waste. The cell pellet from 8 x 10⁸ S2 cells is typically about 1 cm3 in volume.
- Resuspend the pellet in freshly prepared 2 mM EGS to a total volume of 40 mL in DPBS, and rotate at 27 °C for 40 min.
NOTE: Dissolve EGS in DMSO and transfer to DPBS (see Table 2). EGS in DMSO is hazardous. - Quench by adding 2 mL of 2.5 M glycine (final 0.125 M); rotate at 27 °C for 10 min.
- Pellet at 845 x g for 5 min at RT; discard supernatant to the appropriate chemical/biological waste. Wash pellet twice with 40 mL of prewarmed DPBS at 27 °C.
- Pellet at 845 x g for 5 min. Resuspend the cell pellet in 10 mL of DPBS and count cells. Cell numbers may decrease during the crosslinking step, typically by about 30%.
- Aliquot 1 x 10⁹ cells into each 50 mL tube; pellet at 845 x g for 5 min at RT; discard supernatant. Store the pellets at −80 °C.
NOTE: All the following reaction steps are for one RDD library.
2. Cell lysis and nuclei permeabilization
- Take 1 x 10⁹ S2 dual-crosslinked cells from the −80 °C freezer. Thaw on ice-water for 30 min.
- Resuspend the cells in 50 mL of DPBS, centrifuge at 845 x g for 5 min at RT and discard the supernatant.
- Cell lysis: Resuspend the cell pellet in 20 mL of 0.1% FA lysis buffer (without Triton X-100). Rotate at RT for 15 min. Check by microscopy; adjust time by cell type. Successful lysis is indicated by plasma membrane permeabilization and cytoplasmic release, such that nuclei become readily visible as distinct structures under a standard light microscope (Figure 2A).
- Nuclei permeabilization: Add 1.8 mL of 10% SDS (final 1%). Rotate at 37 °C for 15 min. Centrifuge at 3,200 x g for 20 min at RT and discard the supernatant. Check by microscopy (Figure 2B); adjust time by cell type. Nuclei appear darker, membrane veil-like, or some are detached. Repeat until lysis is complete.
- Nucleus wash: Resuspend the pellet in 20 mL 0.1% FA lysis buffer (without Triton X-100), rotate at RT for 10 min, then centrifuge at 3,200 x g for 20 min at RT, discard the supernatant, and mark the nuclei pellet size. Store the nuclei pellet at −80 °C for later use.
3. Chromatin fragmentation
- Resuspend the nuclei pellet in 15 mL of 0.1% FA lysis buffer (with Triton X-100). Aliquot 1.5 mL of the nuclei suspension into each 14 mL-round-bottom test tube, avoiding bubbles.
- Mark the pellet size before sonication for comparison and repeat sonication if the pellet remains large after sonication.
- Sonicate at amplitude 38% for 4.5 min, with 30 s ON / 30 s OFF cycles. Collect all the sonicated chromatin into a 15-mL tube and centrifuge at 3,200 x g for 20 min at RT, then transfer the supernatant (~13 mL) to a new 15-mL tube.
4. Preclear chromatin with C1 beads
- Prepare Streptavidin C1 beads: Aliquot 400 µL of Streptavidin C1 beads into a 1.5 mL tube (100 µL per 1 × 10⁹ S2 cells), place on magnet for 30 s, and remove supernatant. Wash twice with 200 µL of 0.1% FA lysis buffer (with Triton X-100), then resuspend in 100 µL of 0.1% FA lysis buffer (with Triton X-100).
- Chromatin preclear: Add the 100 µL of prepared Streptavidin C1 beads into the tube containing ~13 mL of sonicated chromatin supernatant (from Step 3.2); rotate 20 min at RT; place on a magnetic rack for 1 min and transfer the supernatant (precleared chromatin) to new 50-mL tubes; take 10 µL and store at −20 °C for QC1 (Figure 3A).
5. Hybridize the RNA probe with the precleared chromatin
- Add 2 volumes (26 mL) of freshly prepared Hybridization buffer to 1 volume (13 mL) of precleared chromatin; rotate 30 min at RT.
- Aliquot the mixture into three 15-mL tubes; add 6 µL of 100 µM biotinylated probes (DNA oligonucleotide, Table 1) to each sample (2 µL per 15 mL tube); rotate at 37 °C overnight. Seal tube caps with film.
6. Immobilize probe - chromatin complex on C1 beads
- Block Streptavidin C1 beads with blocking buffer: Take 400 µL of fresh streptavidin C1 beads and wash twice with 800 µL of 0.1% FA lysis buffer (without Triton X-100); add 400 µL of Blocking Buffer and incubate on a mixer (F8) for 30 min at RT. Place on a magnet for 10 min and discard the supernatant; wash three times with 800 µL of 0.1% FA lysis buffer (without Triton X-100). For each wash, gently pipette to mix, place on the magnet for at least 30 s, then discard the supernatant.
- Resuspend the C1 beads in 400 µL of hybridization buffer.
- Immobilize the probe-chromatin complex on Streptavidin C1 beads: Add the Blocking Buffer-treated streptavidin C1 beads to the corresponding hybridized chromatin and rotate for 2.5 h at RT.
- Transfer the immobilization reaction from 15-mL tubes to a 1.5-mL tube using a magnetic rack. Place each 15-mL tube on a magnetic rack for 5 min; remove the supernatant. Resuspend beads with 1 mL of Wash buffer and transfer to a new 1.5 mL tube.
- Wash the beads five times with 800 µL of Wash buffer, then twice with TE buffer. To wash, add buffer, incubate on a mixer (F1, 12 rpm) for 5 min at 37 °C, place on a magnetic rack for 30 s, and discard the supernatant.
- Hold the beads in 1,000 µL of TE buffer (1x PI) at RT.
7. Blocking unoccupied sites on C1 beads with denatured Iodoacetyl-PEG2-Biotin (IPB)
- Dissolve 4.8 mg of IPB in 400 µL of IPB Wash buffer; rotate at RT for 15 min.
- β‑ME solution: Add 1 µL of β-ME to 312 µL of H₂O; mix and rotate at RT for 15 min.
- Denature IPB: Add 44 µL of the β-ME solution to 400 µL of IPB; mix and rotate at RT for 15 min.
- Block the C1 Beads: Add 220 µL of the denatured IPB to the C1 beads bound with the probe-chromatin complex (in 1,000 µL TE); rotate at RT for 15 min.
- Wash the C1 beads with TE five times. Add buffer, incubate on a mixer (F8) for 5 min at RT, then place on a magnetic rack for 30 s, and discard the supernatant.
8. Chromatin end-repair (on beads)
- Add 693 µL of end-repair mix to the chromatin on C1 beads and mix well; then add 7 µL of T4 DNA polymerase.
- Incubate on thermomixer (800 rpm) at 12 °C for 30 min; then on mixer (F8) at 16 °C for 15 min.
- Wash the beads three times with 800 µL of ice-cold ChIA-PET buffer, then once with TE. For each wash, gently pipette to mix, place on the magnet for at least 30 s, then discard the supernatant.
9. Chromatin A-tailing (on beads)
- Add 693 µL of A-tailing mix to the chromatin on C1 beads and mix well, then add 7 µL of Klenow fragment (3'-5' exo-).
- Incubate on mixer (F1, 12 rpm) at 37 °C for 50 min. Wash the beads three times with 800 µL of ice-cold ChIA-PET buffer, then once with elution buffer.
10. Chromatin proximity ligation (on beads)
- Add 1,390 µL of proximity ligation mix to the chromatin on C1 beads. Incubate on mixer (F8) at RT for 5 min.
- Then add 10 µL of T4 DNA ligase. Rotate on mixer (F8) at RT for 5 min, then switch to F1 (12 rpm) at RT for 50 min, followed by 16 °C overnight.
- Wash the beads three times with 800 µL of ice-cold ChIA-PET buffer, then twice with TE buffer.
11. Releasing the proximity-ligated chromatin DNA from the C1 beads
- Add 480 µL of LC ChIP elution buffer to the chromatin on C1 beads, mix well, and add 20 µL of 20 mg/mL Proteinase K for decrosslinking.
- Incubate on thermomixer (950 rpm) at 65 °C overnight.
12. Proximity-ligated DNA purification (with Phenol: Chloroform: IAA reagents)
- Spin the high-density phase-lock tube at 13,500 x g for 2 min at RT. Add de-crosslinked products (500 µL) into the high-density phase-lock tube.
- Add 500 µL of Phenol:Chloroform:IAA (using a 5-mL pipette tip) to the high-density phase-lock tube. Mix gently by hand.
CAUTION: Perform in a fume hood. - Centrifuge at 13,500 x g for 6 min at RT. While centrifuging, prepare a 1.5-mL tube by adding 52 µL of 3 M sodium acetate (pH 5.5) to the bottom. Place 1 µL of glycogen with blue dye on the cap. Do not mix or close the tube at this point.
- Quickly transfer the supernatant from the high-density phase-lock tube to the prepared 1.5-mL tube.
- Add 520 µL of ice-cold isopropanol to the 1.5-mL tube. Mix gently, then place at -80 °C overnight.
- Remove the tube from -80 °C and thaw at RT (~10 min). Centrifuge at 13,500 x g for ~1 h at 4 °C to precipitate DNA. A blue pellet will be present at the bottom of tube.
- Wash the DNA pellet with 75% ethanol and carefully remove the supernatant. Add 800 µL of 75% ice-cold ethanol, centrifuge at 13,500 x g for 5 min at 4 °C, and remove the supernatant. Repeat the ethanol wash once.
CAUTION: Remove the supernatant immediately after centrifugation: first with a 1-mL tip, then with a 100-µL tip. Warm tubes may dislodge the blue pellet. - After the last ethanol wash, centrifuge at 13,500 x g for 10 min at 4 °C to collect any residual ethanol at the bottom, then carefully remove remaining ethanol.
- Dry the DNA pellet in a vacuum (typically 1 min 30 s to 2 min). Resuspend the DNA pellet in 10 µL of elution buffer and incubate at RT for about 2 h. Quantify the DNA using a nucleic acid quantifier and assess quality with an automatic capillary electrophoresis system (Figure 3B-C).
13. Proximity-ligated DNA Tn5 tagmentation
- Tn5 Tagmentation testing: Prepare a total reaction volume of 50 µL according to Table 1. In a PCR tube on ice, sequentially add 50 ng of QC1 DNA, ddH₂O, and 12.5 µL of 4x Tagmentation buffer. Finally, add the required amount of Tn5 enzyme. Mix gently by pipetting up and down 10 to 20 times after each addition, avoiding bubbles. Briefly spin down the tube as necessary.
NOTE: Mixing gently and avoiding bubbles is critical for tagmentation. Additionally, the Tn5 amount should be empirically optimized to achieve the desired fragment distribution (predominantly 200 bp-1 kb), and users can adjust the size range by tuning the Tn5 input. - Tagmentation reaction: Incubate the reaction at 55 °C for 10 min in a PCR instrument with the lid set to 70 °C, then hold at 4 °C.
- Tn5 release and DNA purification: Add 50 µL of ChIP Elution buffer and 1 µL of Proteinase K to the tagmented DNA (for a final SDS concentration of 0.5%). Mix and incubate on the thermomixer at 65 °C and 900 rpm for 30 min. Purify the DNA with a DNA purification kit and quantify DNA using an automatic capillary electrophoresis system (Figure 3D).
NOTE: At this stage, DNA fragments should predominantly range from 200 bp to 1 kb. The Tn5 enzyme to DNA ratio should be optimized empirically. - Tn5 Tagmentation scale-up: Based on the Tn5 testing results, scale up the reaction for proximity-ligated DNA using the same conditions. After tagmentation, remove the sample from the PCR instrument and place it on ice. Briefly spin down, incubate at RT for 2 min, then add 5.5 µL of 10% SDS (w/v; final SDS concentration: 1%). Mix by pipetting up and down 10 to 20 times, avoiding bubbles, and spin down briefly. Incubate samples at 37 °C in a PCR instrument for at least 15 min. Tagmented DNA can be stored at -20 °C for several days.
14. Blocking M280 beads
- Take 20 µL of M280 beads and wash twice with 200 µL of 1x B&W buffer. To wash, add buffer, resuspend beads by pipetting, briefly spin down, place on magnet for 30 s, and remove the supernatant.
- Bead blocking with Blocking buffer: Resuspend the M280 beads in 100 µL of Blocking Buffer; rotate on mixer (F8) at RT for 45 min.
- Bead Washing: Briefly spin down, place on magnet for 10 min, and discard the Blocking buffer. Wash beads twice with 200 µL of 2x B&W buffer.
- Bead Blocking with genomic DNA: Resuspend beads in 100 µL of 2x B&W buffer, add 100 µL of sheared genomic DNA (~500 ng, 300-500 bp), mix well, and rotate on mixer (F8) at RT for 30 min.
- Discard the genomic DNA mixture and wash beads twice with 200 µL of 1x B&W buffer.
15. Immobilization of ligated DNA on M280 beads
- Binding ligated DNA to M280 Beads: Discard 1x B&W buffer. Add all fragmented ligated DNA to the M280 beads, mix, and rotate on mixer (F8) at RT for 45 min.
- Briefly spin down, place on the magnet, and discard supernatant. Wash beads five times with 500 µL of pre-warmed wash buffer at 37 °C; once with 500 µL of 1x B&W; and once with 200 µL of 1x B&W. Place on magnet for 1 min, gently mix at tube bottom, and discard supernatant. Add 30 µL of elution buffer to the beads (do not mix).
- To wash, add buffer, incubate 5 min on mixer (F8), place on magnet 30 s, then discard supernatant. Beads with bound ligated DNA can be stored at -20 °C.
16. Amplification of ligated-DNA on M280 beads
- Prepare PCR reaction (according to the DNA library preparation kit). Transfer the PCR tubes to the PCR machine and set up the program.
NOTE: PCR amplification cycles are critical for final library quality; increasing cycle number reduces library complexity. Optimize the number of cycles empirically and generally do not exceed 15 cycles. - Purify PCR product using magnetic beads (Figure 3E). Size selection: Use (0.8-0.61) magnetic beads to do double size selection of the RDD library.
- The final DNA library should predominantly range from 250 to 600 bp (Figure 3F). Ensure 10-30 ng of library DNA is measured by nucleic acid quantifier for sequencing.
- Sequencing: Subject for Illumina sequencing with 2x 150 bp. Sequencing depth depends on RNA expression, binding-site density, and genome-wide patterns. Here, roX2 saturates at ~23M reads and 7SK at ~8M reads, so the latter needs less depth. Start by species, then assess redundancy for any extra depth: ~5M for Drosophila, ~20M for human/mouse, adjusting by QC metrics.
Results
This protocol outlines the RDD method for detecting RNA-associated chromatin DNA-DNA interactions. The workflow begins with biochemical enrichment of RNA-chromatin complexes using biotinylated probes, followed by proximity ligation to link spatially adjacent DNA fragments. After constructing sequencing libraries, high-throughput sequencing is performed.
Bioinformatic analysis of RDD data is streamlined by the ChIA-PIPE platform13. Key steps in this analytical pipeline include: trimming sequencing linkers from raw reads, mapping paired-end reads to the reference genome, filtering for uniquely mapped read pairs, removing PCR duplicates, and assigning interactions to targeted RNA sites based on probe coordinates. Typically, about 50% of sequenced reads are successfully retained after linker and quality filtering. Valid interaction events were then aggregated to generate locus-specific contact maps, providing detailed profiles of RNA-guided chromatin architecture. For RDD data, we implemented three ChIA-PIPE adjustments: the RDD linker sequence ("ACGCGATATCTTATCTGACT") was used in place of the default ChIA-PET linker ("ACGCGATGGCTACTCTGACT"); loop clustering was performed with a shortened PET extension of 50 bp in addition to the default 500 bp to increase positional precision of RNA interaction sites; and RNA enrichment coverage was computed with deepTools (bamCoverage v3.5.1) using a 1 bp bin size. These modifications-linker configuration, reduced PET extension for finer clustering, and high-resolution coverage-adapt ChIA-PIPE for the RDD libraries.
Figure 4 displays representative RDD results for two non-coding RNAs: roX214 (Figure 4A,C; green), a dosage compensation complex RNA involved in regulating X-chromosome structure and gene expression in Drosophila, and 7SK15 (Figure 4B,D; purple), a highly conserved small nuclear RNA that modulates transcription elongation by regulating P-TEFb activity in metazoans. RNA binding and chromatin interactions detected by RDD are visualized together with RNAPII ChIA-PET data (blue arcs), highlighting the structural relationship between RNA-associated loops and key regulatory elements such as promoters (P), enhancers (E), and transcription start or end sites (TSS/TES). Prominent interaction peaks in the aggregated data support a model in which both roX2 and 7SK mediate critical enhancer-promoter or long-range chromatin contacts.
Multi-dimensional analysis is achieved by integrating RDD-anchored interactions with Hi-C genome-wide chromatin conformation maps (bottom panel red heatmaps) and epigenomic marks (H3K27ac, H3K27me3), nascent transcription (RNA-seq), and RNAPII ChIA-PET data (Figure 4C,D). In these regions, topologically associating domains (TADs) are clearly visualized, with RNA-guided chromatin loops often situated at TAD boundaries or spanning multiple TADs. Additional annotation with histone modification and transcription data enables discrimination between active and inactive chromatin regions. Key RNA-centric regulatory hubs are circled in the figure.
Distinct patterns emerge for different ncRNAs. roX2 is characterized by binding at TES regions and looping to TSSs, frequently localizing at TAD boundaries and forming long-range contacts that can cross multiple TADs. In contrast, 7SK predominantly binds to enhancers and forms shorter-range loops with neighboring promoters, generally without traversing TAD borders.
Collectively, these results affirm that RDD is a reliable and high-resolution method for dissecting RNA-specific 3D chromatin organization. This approach enables direct investigation into the spatial roles of regulatory RNAs in genome architecture and gene expression across diverse biological settings.
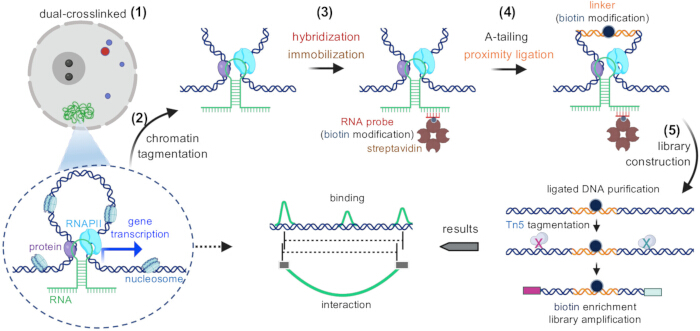
Figure 1: Schematic of the RDD library generation workflow. The central workflow steps for RDD library generation are shown in sequence and accompanied by corresponding schematic illustrations. The procedure begins with dual-crosslinking and chromatin tagmentation, followed by hybridization with a biotin-modified RNA probe and immobilization via streptavidin. Subsequent steps include A-tailing, proximity ligation with biotin-modified linkers, and library construction. After ligating the DNA, purification, Tn5-mediated fragmentation, biotin enrichment, and library amplification are performed. Please click here to view a larger version of this figure.
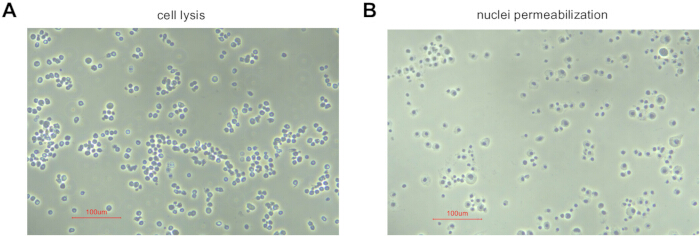
Figure 2: Representative microscopy images of Drosophila S2 cells demonstrating visual quality control criteria for cell lysis and nuclei permeabilization. (A) Successful cell lysis is characterized by plasma membrane permeabilization and cytoplasmic release, making the nuclei readily visible. (B) Successful nuclei permeabilization is indicated by cell swelling, partial detachment of the plasma membrane, and intact, clearly visible nuclei. Scale bar = 100 µm. Please click here to view a larger version of this figure.
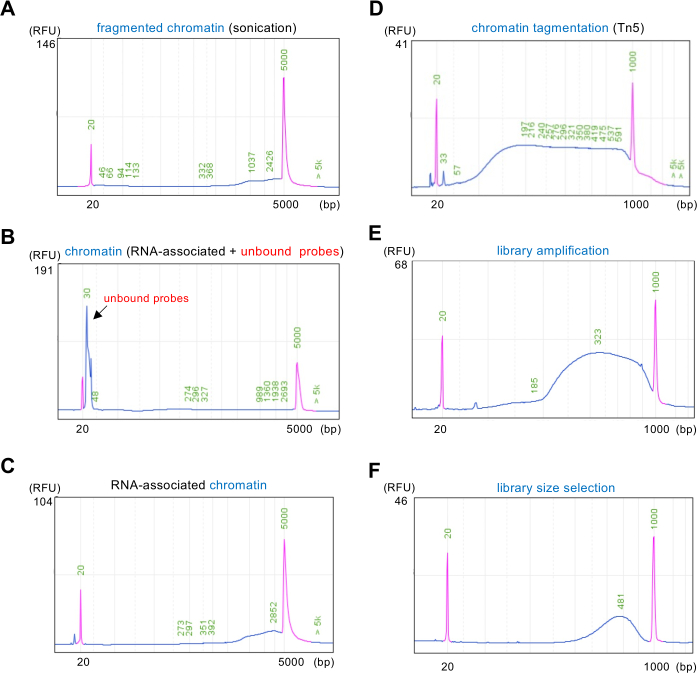
Figure 3: Electropherogram analysis of chromatin preparations. Screenshot of a capillary electrophoresis system electropherograms profiling various chromatin samples. (A) Displays fragmented chromatin (sonication) with a size ranging from approximately 1000 to 3000 bp, indicating successful fragmentation. (B) Illustrates chromatin associated with RNA (RNA-associated + unbound probes), with a smaller peak representing unbound probes, as indicated by the arrow. (C) Shows RNA-associated chromatin, also exhibiting a concentration range from 1000 to 3000 bp, reflective of RNA-protein complexes. (D) Depicts chromatin tagged with Tn5, revealing a range indicative of tagmentation efficiency. (E) Displays the fragment size distribution of the sequencing library after amplification, spanning approximately 180-1000 bp. (F) Shows the fragment size distribution of the sequencing library after size selection, with fragments predominantly enriched in the ~250-600 bp range. The RFU (relative fluorescence units) values are indicated for each sample, demonstrating effective quantification of chromatin integrity and size. The purple peaks represent the marker. Please click here to view a larger version of this figure.
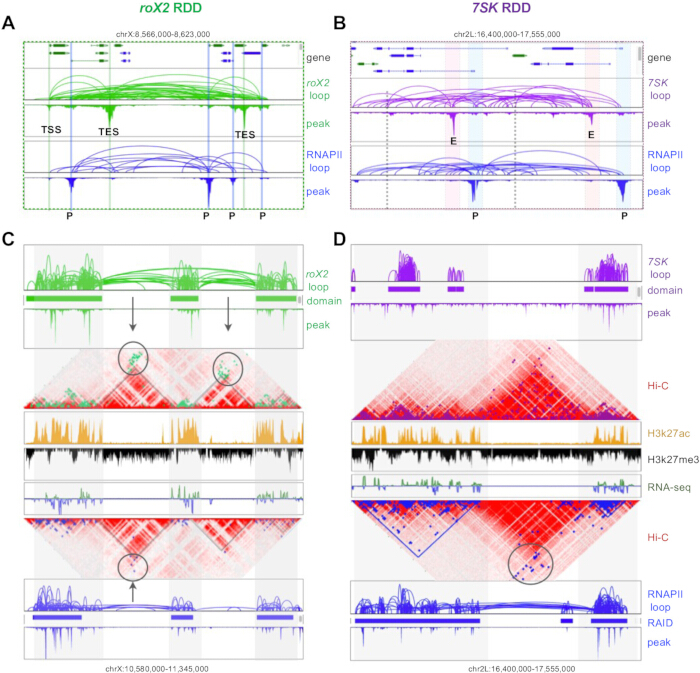
Figure 4: Representative results of RDD for ncRNA-associated chromatin interactions. (A-B) Displays the genomic locations of ncRNA roX2 (green) and 7SK (purple) binding, along with the corresponding remote chromatin interaction loops. Data from RNAPII ChIA-PET (blue) reveals a clear regulatory relationship between these ncRNAs and gene expression, with peaks indicating interaction strength. Abbreviations: TSS = transcription start site; TES = transcription end site; P = promoter; E = enhancer. (C-D) Provides a higher-dimensional view of the relationship between ncRNA roX2 and 7SK-related chromatin loops and TADs (red), as well as the differing active versus inactive chromatin states and gene expression levels. Circles highlight areas with significant interactions across TADs. Please click here to view a larger version of this figure.
Table 1: RDD reaction reagents. Please click here to download this Table.
Table 2: RDD buffer compositions. Please click here to download this Table.
Discussion
Critical steps in the method
Estimating the quantity of RNA probes and the corresponding RNA levels in chromatin is crucial. Excess probes can lead to unbound probes occupying streptavidin sites during the immobilization step, which can hinder the intended capture of target RNA interactions. Additionally, adding too much streptavidin wastes materials and requires more denatured IBP for effective blocking of vacant sites. Insufficient blocking can negatively impact the efficiency of subsequent proximity ligation, especially as the proximity ligation linker also features biotin modifications. If blocking is not adequately performed, portions of the linker may bind directly to the streptavidin beads, complicating results. Moreover, the ratio of linker to chromatin must be carefully estimated-too much linker can cause both ends of chromatin DNA to be tagged, inhibiting effective proximity ligation.
Modifications of the method
In this study, we illustrate the RDD method using Drosophila S2 cells with roX2 ncRNA as an example. The reagent volumes need adjustment based on cell type and ncRNA expression levels; if ncRNA expression is high, one can reduce cell quantity or increase RNA probe concentration, and vice versa. Although this protocol immobilizes chromatin on beads, an alternative approach involves performing in situ proximity ligation followed by enrichment with RNA probes.
Specificity, controls, and QC
We previously described and validated RDD and performed parallel RDDs on multiple RNAs, showing strong specificity; readers may refer to the prior work4,16. RDD requires probe-dependent, locus-specific enrichment that is reproducible and, where possible, orthogonally validated. True interactions meet three criteria: enrichment at probe-targeted loci versus nearby non-binding regions; probe dependence (absent or markedly reduced in negative controls); and reproducibility across biological replicates and independent validation (e.g., RT-qPCR). Antisense probes were designed with Stellaris, screened by BLAST/BLAT to remove off-targets, ordered with 3'-biotin, and validated by RT and qPCR (including DNA-contamination checks and site vs non-site enrichment). We recommend three controls -- no-probe, scramble/non-targeting, and unrelated-RNA or non-binding-region probes -- and assess specificity by comparing qPCR or sequencing coverage across target and control samples, reporting fold-enrichment and background. For low-abundance RNAs, increase probe density (within off-target constraints), raise sequencing depth, and perform orthogonal validation.
Troubleshooting the method
If captured RNA-chromatin interactions are notably low, the efficiency of proximity ligation may need optimization through adjustments of linker and chromatin quantities. Additionally, high peaks of unbound probes were observed through automatic capillary electropherograms. Results indicate that too many probes were added, which can be rectified by reducing the amount used.
Limitations of the method
A key advantage of the RDD method is its efficiency in capturing specific RNA-associated chromatin interactions, meaning each experiment can only focus on one specific RNA at a time. Furthermore, as proximity ligation is designed to detect pairwise interactions, multiple-site interactions cannot be assessed simultaneously.
Significance of the method
The RDD method not only reveals RNA binding sites but also elucidates the interaction relationships among those sites, enhancing our understanding of chromatin architecture.
Practical uses and future potential of RDD
RDD is suitable for various chromatin-associated RNAs, including endogenous host RNAs and exogenous RNAs from viruses or other microorganisms, highlighting its broad applicability in different research fields.
Disclosures
A patent (Chinese Patent No. ZL202210182253.X) related to the RDD technology described in this protocol has been granted.
Acknowledgements
This work was supported by grants from the National Key R&D Program of China (2022YFC3400400 and 2022YFC3400401) and the National Natural Science Foundation of China (32170644).
Materials
| Name | Company | Catalog Number | Comments |
|---|---|---|---|
| 0.5 M EDTA | Invitrogen | AM9260G | |
| 1 M Magnesium acetate | Sigma-Aldrich | 63052-100ML | |
| 1 M Tris-HCl pH 7.0 | Invitrogen | AM9851 | |
| 1 M Tris-HCl pH 8.0 | Invitrogen | AM9856 | |
| 1.5-mL Tubes | Eppendorf | 30108051 | |
| 10 mM dATP | Invitrogen | 18252015 | |
| 10% SDS (wt/vol) | Invitrogen | AM9822 | |
| 10× A-tailing buffer | NEB | B7002S | |
| 10× End-repair buffer | NEB | B6002S | |
| 10× T4 DNA ligase buffer | NEB | B0202S | |
| 10× TBE buffer | Invitrogen | AM9863 | |
| 14-mL Round-bottom test tubes | Corning | 352057 | |
| 2× PCR master mix | NEB | M0541 | |
| 20× SSC buffer | Invitrogen | AM9770 | |
| 200-μL PCR tubes | Sangon Biotech | F611541-0010 | |
| 250-mL Square PET storage bottles | Corning | 431531 | |
| 2-Mercaptoethanol (β-ME) | Sigma-Aldrich | M6250-100mL | ! CAUTION β-ME is toxic; always use it in a fume hood. |
| 2-mL Tubes | Eppendorf | 22431048 | |
| 3 M Sodium acetate pH 5.5 | Invitrogen | AM9740 | |
| 5 M NaCl | Invitrogen | AM9759 | |
| 5 M Potassium acetate | Sigma-Aldrich | 95843-100ML-F | |
| 500-mL Square PET storage bottles | Corning | 431532 | |
| Analytical balance | Sartorius | BP211D | |
| Automated cell counter | Counterstar | IC1000 | |
| Automatic capillary electrophoresis system | Bioptic | C100100 | |
| Biotinylated probes | GENEWIZ | Refer to Table 1 | |
| Blocking powder | Invitrogen | T2015 | |
| Bridge linker oligos | GENEWIZ | Refer to Table 1 | |
| CO2 incubator | Thermo Scientific | 51033549 | |
| Dimethyl sulfoxide (DMSO) | Sigma-Aldrich | D2650-100mL | |
| DNA library preparation kit V2 for Illumina | Vazyme | TD501 | |
| DNA purification kit | Zymo | D4013 | |
| Dulbecco’s phosphate buffered saline (DPBS) (1×) | Gibco | 14190250 | |
| EDTA-free protease inhibitor cocktail | Roche | 11836170001 | |
| EGS (Ethylene glycol bis[succiniMidylsuccinate]) | Thermo Scientific | 21565 | |
| Elution buffer | Qiagen | 19086 | |
| Ethyl alcohol, pure | Sigma-Aldrich | E7023-500mL | |
| Formaldehyde solution | Sigma-Aldrich | 47608-250mL-F | ! CAUTION Formaldehyde is toxic; always use it in a fume hood. |
| Formamide | Invitrogen | AM9342 | |
| Gel imaging system | Tanon | 3500R | |
| Glycine | Invitrogen | 50046-1kg | |
| Glycogen with blue dye | Invitrogen | AM9516 | |
| High sensitivity cartridge | Bioptic | C105105 | |
| High-density phase-lock tubes (1.5 mL) | Qiagen | 129046 | |
| High-sensitivity dsDNA fluorometric assay kit | Invitrogen | Q32851 | |
| Index kit V2 for Illumina | Vazyme | TD202 | |
| Iodoacetyl-PEG2-Biotin (IPB) | Thermo Scientific | 21334 | |
| Isopropyl alcohol | Sigma-Aldrich | I9030 | ! CAUTION Isopropyl alcohol is toxic; always use it in a fume hood. |
| Kilo base cartridge | Bioptic | C105106 | |
| Klenow fragment (3'→5' exo-) | NEB | M0212L | |
| Magnetic beads | Beckman | A63881 | |
| Magnetic separation rack for 15-mL tube | Invitrogen | 12301D | |
| Magnetic separation rack for 2-mL tube | Invitrogen | 12321D | |
| Magnetic separation rack for PCR tube | NEB | S1515S | |
| Microbiological incubator | Thermo Scientific | IMH180 | |
| Microscope | Nikon | Eclipse TS2 | |
| Mixer | ELMI | RM-2L | |
| N,N-Dimethylformamide (DMF) | Sigma-Aldrich | 227056-100ML | ! CAUTION DMF is toxic; always use it in a fume hood. |
| Non-refrigerated microcentrifuge | Eppendorf | 5405000204 | |
| Nuclease-free water (not DEPC-treated, 1000 mL ) | Invitrogen | AM9932 | |
| Nuclease-free water (not DEPC-treated, 50 mL) | Invitrogen | AM9937 | |
| Nucleic acid quantifier | Invitrogen | Q33226 | |
| Orbital shaker | Crystal | SYC-2102 | |
| Phenol:Chloroform:IAA | Solarbio | P1012-100mL | |
| Proteinase K solution | Invitrogen | AM2548 | |
| Refrigerated centrifuge | Eppendorf | 22628180 | |
| Refrigerated incubator | Thermo Scientific | IMP180 | |
| Refrigerated microcentrifuge | Eppendorf | 5404F1621754 | |
| Refrigerator | Haier | DW-25L262 | |
| RNase inhibitor | Ambion | AM2696 | |
| RNase-free 15-mL tubes | Invitrogen | AM12500 | |
| RNase-free 50-mL tubes | Invitrogen | AM12502 | |
| Sonicator | Sonics & Materials | VCX130 | |
| Streptavidin-coated magnetic beads C1 | Invitrogen | 65001 | |
| Streptavidin-coated magnetic beads M-280 | Invitrogen | 11205D | |
| T4 DNA ligase | NEB | M0202S | |
| T4 DNA polymerase | NEB | M0203S | |
| TE buffer pH 8.0 | Invitrogen | AM9849 | |
| Thermal cycler | Bio-Rad | 1851148 | |
| Thermomixer | Eppendorf | 5382000023 | |
| Triton X-100 | Acros Organics | 327371000-100mL | |
| Ultra-low temperature freezer | Thermo Scientific | 995 | |
| Vacuum concentrator | TOMY | MV-100 |
References
- Rao, S. S. P., et al. A 3D map of the human genome at kilobase resolution reveals principles of chromatin looping. Cell. 159 (7), 1665-1680 (2014).
- Fullwood, M. J., et al. An oestrogen-receptor-α-bound human chromatin interactome. Nature. 462 (7269), 58-64 (2009).
- Li, X., et al. GRID-seq reveals the global RNA-chromatin interactome. Nat Biotechnol. 35 (10), 940-950 (2017).
- Tian, S. Z., et al. 3D chromatin structures associated with ncRNA roX2 for hyperactivation and coactivation across the entire X chromosome. Sci Adv. 10 (30), eado5716(2024).
- Rinn, J., Guttman, M. RNA and dynamic nuclear organization. Science. 345 (6202), 1240-1241 (2014).
- Chu, C., Qu, K., Zhong, F. L., Artandi, S. E., Chang, H. Y. Genomic Maps of Long Noncoding RNA Occupancy Reveal Principles of RNA-Chromatin Interactions. Mol Cell. 44 (4), 667-678 (2011).
- Simon, M. D., et al. The genomic binding sites of a noncoding RNA. Proc Natl Acad Sci. 108 (51), 20497-20502 (2011).
- Yan, Z., et al. Genome-wide colocalization of RNA-DNA interactions and fusion RNA pairs. Proc Natl Acad Sci. 116 (8), 3328-3337 (2019).
- Quinodoz, S. A., et al. RNA promotes the formation of spatial compartments in the nucleus. Cell. 184 (23), 5775-5790 (2021).
- Li, X., et al. Long-read ChIA-PET for base-pair-resolution mapping of haplotype-specific chromatin interactions. Nat Protoc. 12 (5), 899-915 (2017).
- Fang, R., et al. Mapping of long-range chromatin interactions by proximity ligation-assisted ChIP-seq. Cell Res. 26 (12), 1345-1348 (2016).
- Mumbach, M. R., et al. HiChIP: efficient and sensitive analysis of protein-directed genome architecture. Nat Meth. 13 (11), 919-922 (2016).
- Lee, B., et al. ChIA-PIPE: A Fully Automated Pipeline for Comprehensive ChIA-PET Data Analysis and Visualization. Sci Adv. 6 (28), eaay2078(2020).
- Meller, V. H., et al. Ordered Assembly of roX RNAs into MSL Complexes on the Dosage-Compensated X Chromosome in Drosophila. Curr Biol. 10 (3), 136-143 (2000).
- Egloff, S., Studniarek, C., Kiss, T. 7SK small nuclear RNA, a multifunctional transcriptional regulatory RNA with gene-specific features. Transcription. 9 (2), 95-101 (2018).
- Tian, S. Z., et al. Landscape of the Epstein-Barr virus-host chromatin interactome and gene regulation. EMBO J. 44 (13), 3872-3915 (2025).
Reprints and Permissions
