This protocol describes a standardized workflow for collecting cetacean environmental DNA (eDNA) samples from whale-watching vessels. Feasibility for researchers and trained citizen scientists is prioritized, while environmental conditions, filtration time, turbidity, and onboard logistics define the practical limits of its application.
Method Article
Environmental DNA Sampling from Whale-Watching Vessels for Cetacean Monitoring
In This Article
Summary
Abstract
Environmental DNA (eDNA) offers a non-invasive approach for monitoring cetaceans, yet its widespread application from operational platforms requires standardized and feasible sampling workflows. This study describes a protocol for collecting cetacean eDNA from whale-watching vessels, designed for implementation by researchers and trained citizen scientists under defined environmental and logistical conditions. The approach integrates flukeprint-targeted seawater collection, onboard filtration with self-preserving filters, and downstream molecular analyses to support operationally feasible data generation in real-world conditions. The protocol was implemented during coordinated field campaigns conducted in 2024 across three regions in the North Atlantic and Mediterranean Sea (Iceland, Portugal, and Italy), encompassing multiple cetacean taxa. Method performance was evaluated using a newly developed species-specific quantitative PCR assay targeting mitochondrial DNA of humpback whale (Megaptera novaeangliae), demonstrating consistent detection rates under variable environmental and logistical conditions. By providing practical guidance for field implementation and contamination control, this protocol supports reproducible eDNA-based cetacean monitoring and facilitates cross-regional comparability in marine biodiversity studies.
Introduction
Effective conservation management of marine megafauna, including cetaceans and other wide-ranging species, is imperative for biodiversity protection. As top predators and ecosystem engineers, cetaceans contribute to trophic regulation, nutrient cycling, and ecological resilience across ocean basins1. However, generating comprehensive ecological knowledge for these highly mobile species remains challenging and often relies on resource-intensive monitoring programs2. Conventional approaches, such as biopsy sampling, photo identification, passive acoustic monitoring, satellite telemetry, and aerial surveys, have provided critical insights into cetacean ecology3,4,5,6,7, yet, these methods are often costly, logistically demanding, spatially constrained, or invasive, and subject to strict ethical and regulatory oversight8. As a result, sampling frequency, geographic coverage, and opportunities for stakeholder participation are often limited, especially for the study of wide-ranging or rare species.
Environmental DNA (eDNA, defined as genetic material shed by organisms into their environment) sampling has emerged as a powerful, non-invasive tool for detecting aquatic species from water samples9,10. Species-specific quantitative PCR (qPCR) assays targeting mitochondrial DNA fragments enable highly sensitive and specific detection of marine taxa, including cetaceans11,12,14. Beyond presence/absence detection, relative eDNA signal strength and target DNA sequences provide valuable information related to proximity, relative abundance, and population-level genetic patterns15,16,17,18,19. Additionally, environmental samples collected near whales frequently contain DNA from co-occurring taxa, including prey species, symbionts, and parasites, supporting broader ecological associations20,21,22. Collectively, these advances demonstrate the potential of eDNA-based approaches to complement traditional methods and expand the scope of cetacean research across marine systems23,24.
Despite these advantages, eDNA-based monitoring of marine megafauna faces persistent challenges related to representative sampling, spatial coverage, and methodological reproducibility, particularly in open marine systems where DNA is rapidly diluted25,26 and target species have extensive ranges and occur at low densities. Addressing these constraints requires scalable, operationally feasible sampling frameworks that can be applied across broad spatial and temporal scales. Citizen science initiatives have proven effective in expanding ecological data collection while promoting public engagement in marine conservation, thus, making them a promising avenue for large-scale eDNA-based monitoring27,28,29,30. Whale-watching vessels represent an underutilized yet highly suitable platform for eDNA sampling, offering regular access to cetacean habitats across seasons and regions31,32,33. The global whale-watching industry supports extensive operational networks34, and previous studies have demonstrated the feasibility of collecting cetacean eDNA from other opportunistic platforms, such as commercial vessels, ferries35, and through targeted sampling integrated with photo-identification and behavioral observations36,37. The rapid expansion of eDNA research has led to substantial methodological innovation, yet biological variability across marine systems and the pace of technological advancements complicate efforts to harmonize protocols and ensure comparability across studies. Standardized, yet adaptable field methodologies are therefore essential, particularly for large-scale multinational monitoring initiatives38.
eDNA detection is influenced by filtered water volume, filtration strategy, filter material, and pore size. Filtering larger volumes generally increases eDNA yields and detection probability for vertebrate targets, including cetaceans39,40,41,42. In productive or turbid waters, however, filtration efficiency may be constrained by rapid filter clogging43,44, necessitating trade-offs between achievable volume and operational feasibility45,46. Sampling from flukeprints — the surface disturbance created by a whale tail´s stroke — has consistently been shown to enhance cetacean eDNA detectability, as recently shed biological material is concentrated near the surface24,41,42,47,48. The use of enclosed, self-preserving filter systems reduces handling steps and contamination risks, making them well-suited for citizen science applications38,42. Additionally, the inclusion of biological replicates and routine field controls minimizes detection failure and enhances data reliability49,50,51.
Protocol development and validation
The eWHALE project52 is a transnational initiative integrating researchers, whale-watching operators, and citizen scientists across Europe to monitor marine megafauna using eDNA. Sampling efforts have targeted multiple cetacean taxa across the North Atlantic and Mediterranean Sea, using a core protocol with region-specific adaptations to account for local environmental and logistical conditions.
Here, we present a standardized, start-to-end protocol for collecting cetacean eDNA from whale-watching vessels, refined through the analysis of 308 seawater eDNA samples, including two replicates per sample and 21 field controls, collected during coordinated field campaigns in 2024 in Skjálfandi Bay (Iceland), the Azores (Portugal), and the Ligurian Sea (Italy). The method integrates flukeprint-targeted seawater collection, onboard filtration using self-preserving eDNA filters, and downstream molecular analyses.
This protocol is designed for implementation in real-world whale-watching conditions by trained researchers and citizen scientists, where onboard filtration can be completed under calm to moderate sea conditions without disrupting whale-watching activities. Its implementation requires coordination with participating organizations (e.g., whale-watching operators, non-profit organizations, research institutions) to define sampling strategies and research objectives. While core parameters must remain fixed to ensure reproducibility and cross-study comparability, protocol-aligned adjustments may be required at sites with high turbidity, vessel motion, or constraints in time, space, or personnel. Such adaptations include filter type, achievable filtered water volume, and auxiliary equipment. They must be applied consistently within each sampling campaign and transparently reported. Detailed operational guidance and logistical considerations are provided in the Protocol steps and Discussion to support data quality, transparency, and regional comparability.
qPCR assay design
To evaluate protocol performance, eDNA of humpback whales (Megaptera novaeangliae), a well-studied migratory species regularly encountered in Skjálfandi Bay (Iceland)53 and seasonally present in the Azores54, was amplified from samples collected in the field. DNA lysis, extraction, and qPCR workflows were initially optimized through an interlaboratory ring test involving four participating laboratories of the eWHALE project, thus improving consistency and applicability across institutions14.
To reliably detect the presence of humpback whale eDNA, a species-specific MGB (minor groove binder) qPCR assay targeting the mitochondrial ND5 region was designed and validated following established guidelines55 (Table 1). Oligonucleotide primers and a probe were generated using software for DNA sequence alignment and analysis56, aiming to maximize species specificity and amplification efficiency (Supplemental File 1-Supplemental Figure S1). Assay specificity was assessed in vitro using target and non-target taxa (Balaenoptera acutorostrata, Delphinus delphis, Physeter macrocephalus, Homo sapiens). DNA concentrations used to generate qPCR standard curves were quantified from a tissue-derived DNA standard42,57,58,59,60. The limit of detection (LOD) of the assay, defined as the lowest concentration yielding positive amplifications in 95% of the sample replicates, was determined11,61. Detections of humpback whale eDNA were evaluated for field samples by estimating the proportion of positive reactions and signal strength (i.e., Cycle Threshold, Ct value) for each sample replicate across triplicate qPCR measurements, to account for amplification variability and to improve detection reliability57,60,62. Species detections were then verified with bidirectional Sanger Sequencing, followed by confirmation via BLAST analysis63.
qPCR data are presented as the mean ± standard deviation (SD). Statistical significance between groups was assessed using the nonparametric Mann-Whitney U test and Welch's two-sample t-test. Differences were considered significant at p < 0.05. All analyses were performed using statistical analysis software64.
Protocol
Ethics and regulatory compliance
All cetacean observational efforts and subsequent water sampling must be conducted in accordance with national and regional wildlife regulations. Perform sampling exclusively from authorized vessels operating under valid whale watching or research permits. Maintain minimum approach distances from the target species as defined by local regulations and avoid any maneuvering intended solely for sampling purposes. Whale tissue samples used for assay validation were collected under respective regional permits and shared among eWHALE project partners in compliance with national and institutional regulations.
NOTE: Review the following documents prior to any sampling activity and gather the necessary equipment: Table of Materials, eDNA Sampling Kit (Supplemental File 1-Supplemental Figure S2) materials used to collect environmental DNA samples (Figure 1) and an overview of the sampling steps and onboard filtration workflow (Figure 2).
1. Preparation of eDNA sampling
- Prepare field documentation materials, including field data sheets and laminated field protocol (Supplemental File 2 and Supplemental File 3).
- Prepare spare gloves, spare filters (one filter per sample replicate), waterproof marker, and a dedicated waste container (Figure 1A).
NOTE: Use enclosed self-preserving eDNA filters (1.2 µm pore size) to minimize handling and contamination risks65,66. - Prepare one or more rigid buckets, suitable for the vessel type and onboard configuration (Supplemental File 1-Supplemental Figure S3).
- Mark buckets at 10 L using a permanent marker. Prepare multiple smaller buckets if handling 10 L is impractical.
- Attach a rope securely to the bucket if overboard reach is limited.
NOTE: Use lidded buckets to minimize spillage when vessel motion is excessive (Figure 1B). - Prepare a secondary eDNA container to combine smaller volumes and an additional transport box to ensure contamination-free transport of buckets if required (Figure 1C).
- Prepare a portable peristaltic or vacuum water pump (Figure 1D). Fully charge the pump before boarding and disconnect from power immediately prior to use.
- Assign sampling, filtration, and data-recording roles before departure.
CAUTION: Wear gloves during all equipment handling and change gloves between tasks.
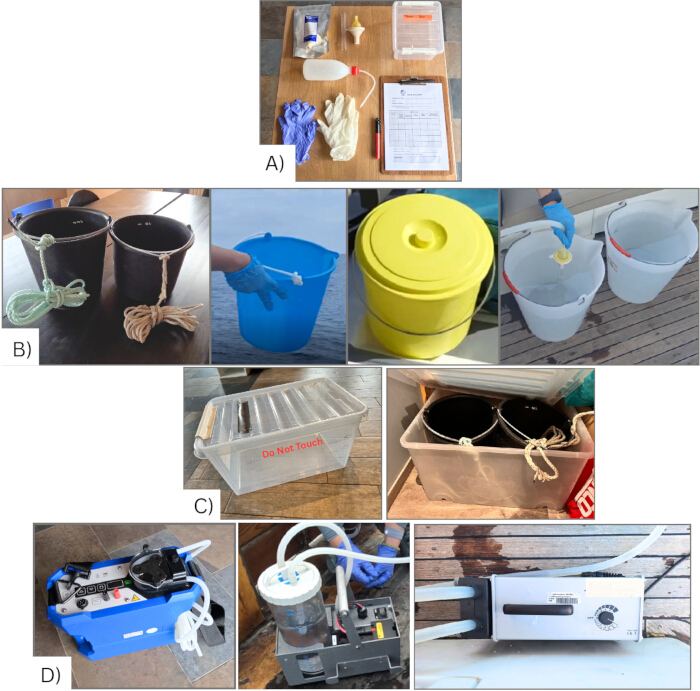
Figure 1: Fieldwork materials used to collect environmental DNA samples. (A) Toolkit with self-preserving eDNA filters, waste container, squeeze bottle with diluted household bleach (1:10), gloves, field datasheet, and waterproof pen; (B) examples of bucket types for eDNA sampling; (C) examples of additional eDNA container for transporting and filtering large volumes and container for transporting buckets onboard; (D) examples of portable pumps for water filtration. Please click here to view a larger version of this figure.
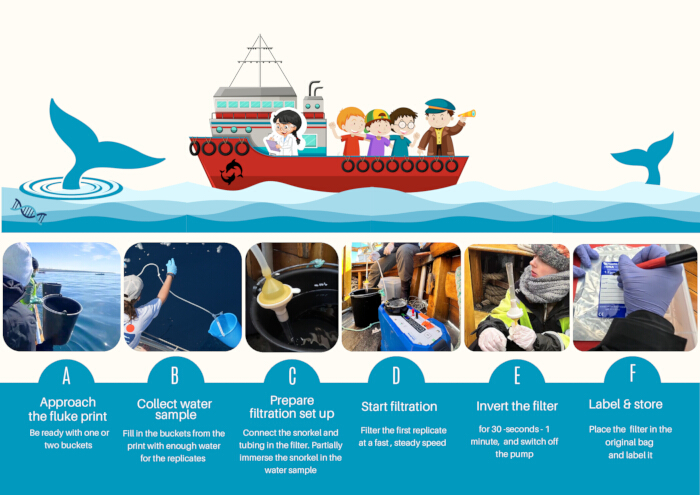
Figure 2: Conceptual diagram of environmental DNA sampling onboard whale-watching boats. The illustration describes guided steps, including water sample collection and onboard filtration. Please click here to view a larger version of this figure.
2. Equipment cleaning
- Put on disposable gloves before cleaning.
- Prepare a bleach solution by diluting household bleach (5-6% sodium hypochlorite) 1:10 with purified water (~50 mL per trip).
- Apply the solution by splashing evenly across all surfaces to all buckets, lids, containers, and pump tubing. Maintain a minimum bleach contact time of 2-5 min on all surfaces.
- Rinse thoroughly with tap water 3x (Figure 3).
- Air dry the materials in a secure location and store them in a safe and clean space prior to boarding.
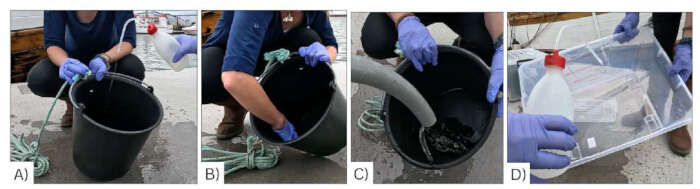
Figure 3: Steps for cleaning equipment. (A) Apply the (1:10) diluted household bleach solution; (B) spread evenly using DNA-free gloves; (C) rinse thoroughly three times with tap water; and (D) repeat the process for additional materials if applicable (e.g., eDNA containers). Please click here to view a larger version of this figure.
3. Water sample collection
NOTE: Comply with all safety regulations onboard each vessel or platform, including the use of life jackets or flotation overalls when required.
- Bring all the materials onboard before passengers arrive and store them in a designated, clean area.
- Coordinate sampling timing and positioning of the vessel with the vessel crew.
- Observe surfacing patterns to anticipate whale dives (Figure 4). Put on new gloves before sampling.
- Collect 20 L of seawater as soon as possible (no more than a 10 min time lapse) from the flukeprint after the whale dives, to generate two 10 L sample replicates.
- Transport the collected water to a designated filtration station on board, using lids or an additional sterilized container to avoid spillage (if required).
- Record species identity, GPS coordinates, time, and sample replicate ID in the data sheet.
- Change gloves immediately after reporting.
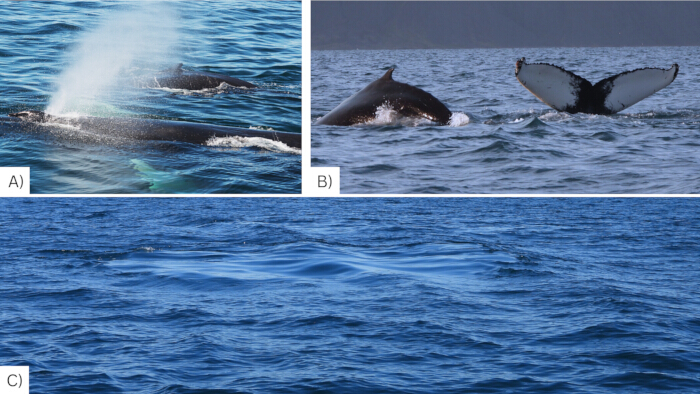
Figure 4: Humpback whale surfacing sequence. (A) Whale blow; (B) arching the back and lifting its tail before diving; (C) flukeprint pattern on the surface after the whale´s dive. Image attribution: Ocean Missions (A,B,C, 2024). Please click here to view a larger version of this figure.
4. eDNA filtration
- Open the filter bag and handle the filter only by the outlet (Supplemental File 1-Supplemental Figure S4).
- Insert the inlet into the snorkel and connect the pump tubing to the outlet (Figure 5A,B).
- Submerge the snorkel in the water sample without submerging the filter housing (Figure 5C).
- Set the pump (see Table of Materials for pump types) to a fast, steady flow rate.
- Filter 10 L continuously while monitoring flow stability (check for air bubbles, rips, tears, or sealing failures).
NOTE: Terminate filtration at a maximum duration of 45 min. - Invert the filter and run the pump for 30-60 s to remove residual water. Confirm that no visible moisture remains in the filter housing.
- Switch off the pump and disconnect tubing.
- Discard the snorkel in the waste container, place the filter in its original bag, and label it immediately.
- Store filters onboard in a closed rigid container or in a cooling box (if ambient temp. > 20 °C), away from direct sunlight and passenger areas.
- Change gloves and repeat filtration for the second replicate.
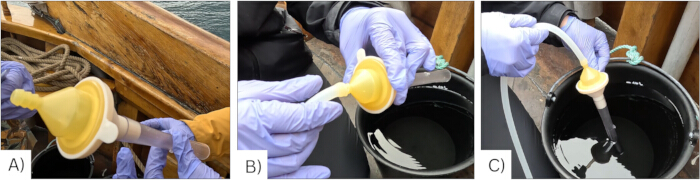
Figure 5: Steps for setting up the onboard filtration setup. (A) attach the filter inlet (white part) to the snorkel (tube); (B) connect the pump tubing to the filter outlet (yellow part); and (C) immerse part of the snorkel in the water sample. Please click here to view a larger version of this figure.
5. Field negative controls and data reporting
- Filter one field negative control after every five flukeprint samples.
- Use target DNA-free water immediately after returning to shore and before equipment cleaning.
- Transfer all data to the digital eDNA sampling spreadsheet after each trip (Supplemental File 4).
6. Filter storage and shipment
- Store self-preserving eDNA filters in a safe, dry container in a shaded, ambient-temperature room—or in a refrigerator if ambient temperature exceeds 20 °C—for no longer than 3 months before shipping.
- Inspect filter bags visually for moisture before shipment.
- Label and ship filters in insulated containers with ice packs to the designated laboratory.
7. Laboratory analysis
NOTE: Perform all the laboratory procedures in dedicated UV-sterilized rooms with adequate ventilation and separate workbenches for PCRs, using DNA-free gloves and protective clothing55,67,68.
- DNA Lysis
- Label a 2 mL reaction tube per filter.
- Place the filter in a 200 mL Erlenmeyer flask and discard the rubber top (Figure 6A).
- Using DNA-free forceps, fold the membrane (Supplemental File 1-Supplemental Figure S5) into a triangle and transfer it to the 2 mL reaction tube, with the tip oriented downward (Figure 6B-D).
- Add 380 µL of TES buffer and 20 µL of Proteinase K (see the Table of Materials) to each reaction tube, resulting in 400 µL of lysis buffer (Figure 6E).
- Vortex briefly and incubate at 56 °C for ≥3 h with agitation (Figure 6F).
- Centrifuge tubes at 18,626 × g for 10 min at room temperature.
NOTE: A clear to lightly colored lysate indicates successful digestion.
NOTE: The protocol may be temporarily stopped at this stage if lysates are stored at -20 °C.
- DNA extraction
- Incubate lysates at 56 °C for 10 min before extraction.
- Pipette extraction reagents in wash plates and elution plates, accounting for negative controls and pipetting errors69 (see Supplemental File 1-Supplemental Table S1).
- Include one extraction blank per plate using TES buffer.
- Transfer 300 µL of lysate into each well in the Bind plate. Add 300 µL of Buffer AL and 300 µL of Isopropyl alcohol to each well. Use multiple Bind plates if total lysate volume exceeds 300 µL. Vortex and add 30 µL magnetic particles for nucleic acid binding per well to the first Bind plate (Table of Materials).
- Cover the Bind plate with a Rod cover.
- Run the preliminary DNA uptake program for two bind plates (total of 400 μL lysate; see the Table of Materials and Figure 7) and the automated extraction protocol on a magnetic-bead-based laboratory robot.
- Dispose of extraction chemicals into designated waste containers.
- Transfer eluted DNA to labeled 1.5 mL reaction tubes and store at −20 °C.
NOTE: The protocol may be temporarily stopped at this stage. Addtitional inhibitor removal steps may be carried out at this point.
- qPCR
- Prepare and quantify target-species DNA standards using tissue extracts and a fluorescence-based high-sensitivity dsDNA assay, according to the manufacturer's instructions (Table of Materials). Generate an eight-point standard curve by serial dilution (1:10) starting at 10 ng/µL11,55. Aliquot standards prior to qPCR to minimize freeze-thaw cycles.
NOTE: The protocol may be temporarily stopped at this stage. - Prepare all qPCR reactions in triplicate using 96-well plates.
- Include one no-template control (molecular-grade water) and one extraction blank per qPCR plate.
- Prepare master mix according to Supplemental File 1-Supplemental Table S2 and Figure 8A.
- In a DNA-loading hood, add the previously prepared DNA standards and 3 µL of DNA extract to each well containing the master mix (Figure 8B).
- Seal the plate with a sealing film (Figure 8C).
- Centrifuge at 3,500 × g for 10 s and load it into the real-time quantitative PCR thermocycler (Figure 8D,E).
- Run the assay at optimized cycling conditions, specified in Table 2, and record data using the manufacturer's software (Table of Materials)11.
- Prepare and quantify target-species DNA standards using tissue extracts and a fluorescence-based high-sensitivity dsDNA assay, according to the manufacturer's instructions (Table of Materials). Generate an eight-point standard curve by serial dilution (1:10) starting at 10 ng/µL11,55. Aliquot standards prior to qPCR to minimize freeze-thaw cycles.
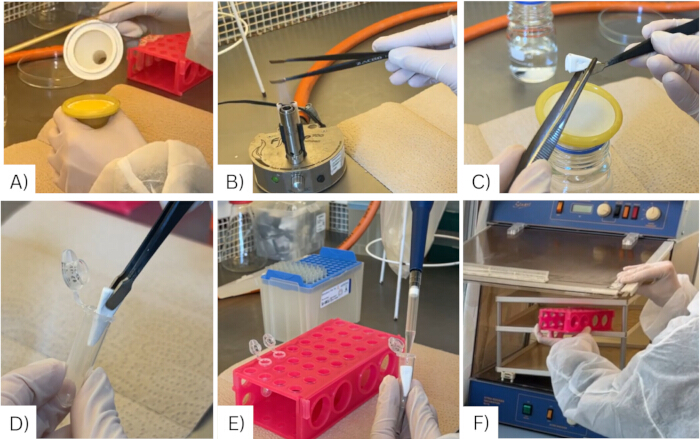
Figure 6: Workflow for DNA lysis. (A) Remove the rubber cap from the self-preserving eDNA filter and place it into an Erlenmeyer flask; (B) sterilize two pairs of forceps by flaming three times; (C) fold the filter membrane; (D) insert it into a 2 mL tube; (E) add lysis buffer and Proteinase K, and (F) incubate samples at 56 °C for 3 h. Please click here to view a larger version of this figure.
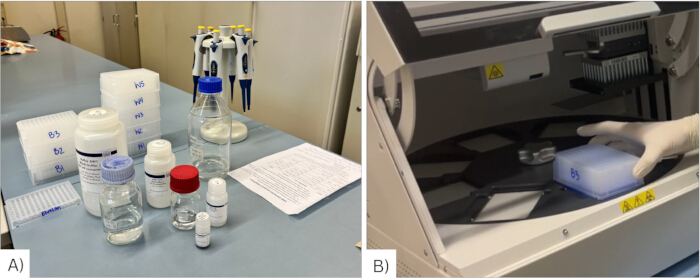
Figure 7: Materials and equipment used for DNA extraction. (A) Bind, wash, and elution plates, consumables, and reagents for extraction preparation; and (B) the magnetic-bead-based laboratory robot used for sample processing. Please click here to view a larger version of this figure.
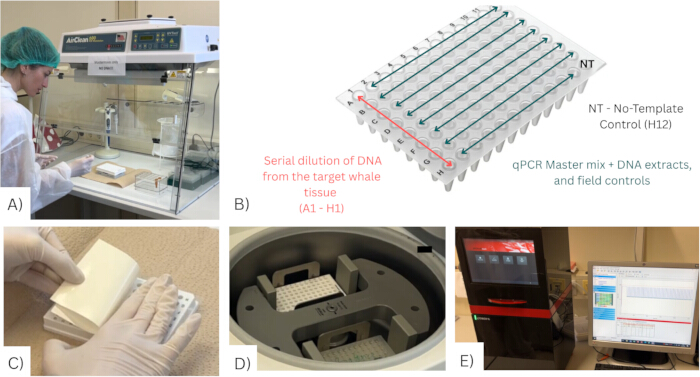
Figure 8: Workflow for qPCR. (A) Prepare master mix in a previously UV-sterilized room (under a working hood dedicated for preparing master mixes); (B) load DNA standards, extracts, and controls in a DNA loading station following the pattern shown; (C) seal plate; (D) centrifuge; (E) load into real-time quantitative PCR thermocycler . Please click here to view a larger version of this figure.
Results
A total of 154 flukeprint samples (308 eDNA filters) were collected in 2024 using this optimized protocol, including 96 filters in Skálfandi Bay (Iceland; 9 field controls and 76 humpback whale replicates) obtained from March to November, 151 filters in the Azores (Portugal; 12 field controls and 15 humpback whale replicates) obtained in July and 61 filters in the Ligurian Sea (Italy; 4 field controls) obtained from May to October. All samples involved the collection of up to 10 L of seawater (two replicates per flukeprint sample) using self-preserving eDNA filters (Table 3). Two types of negative controls were collected during fieldwork: purified water filtered after bleach-cleaning the equipment, and seawater collected upon re-entering the harbor(s)42. The latter was intentionally filtered before bleach cleaning to assess potential cross-contamination with cetacean eDNA during sampling. Samples were shipped from each sampling site in two batches to the Applied Animal Ecology Research Unit, Department of Zoology, University of Innsbruck (Austria) for laboratory processing.
Assay and control performance
A subset of 44 filters (30 replicates including 2 field controls from Skjálfandi Bay, Iceland and 14 filters including 1 field control from the waters surrounding the Island of Faial and Pico, the Azores, Portugal) were analyzed for humpback whale eDNA (Figure 9). The signal was measured in triplicate qPCR reactions. A sample (i.e., eDNA filter) was considered positive, if one out of three qPCR replicates amplified. The assay's limit of detection (LOD) in this study was calculated as 0.0001 ng/µL (Mean Ct of LOD = 35.8). Across the 41 analyzed filters, 20 (49%) yielded amplifications, whereas 24 (58%) showed no amplification. Non-detections (No Ct value) most likely reflect either the absence or extremely low concentrations of target DNA. Non-detections comprised 5 of 13 filters from the Azores (38%) and 19 of 28 filters from Iceland (68%). Extraction blanks were screened for marine vertebrate DNA using the MarVer3 assay70 and showed no detectable amplification, indicating no cross-contamination during DNA extraction. Field controls (NC) and qPCR controls (NT) yielded no amplifications, confirming the absence of contamination during field work and the qPCR screening (Table 4).
Among the 20 positive filters, nine (22%) yielded at least one Ct value below the assay's limit of detection (LOD; 0.0001 ng/µL) and were therefore classified as reliable detections. These included 4 of 8 filters from the Azores (50%) and 5 of 12 from Iceland (42%). An additional 11 filters (27%) produced one or more Ct values above the LOD, comprising 4 filters from the Azores (50%) and 7 from Iceland (58%), indicating plausible detections (Figure 10). Comparative analysis revealed a marginally lower mean cycle threshold (Ct) value for the Azores filters (34.7 ± 3.60; n = 8) compared to the Iceland filters (36.9 ± 3.60; n = 10). The Mann-Whitney U test demonstrated that this difference was not statistically significant (U = 199.0, p = 0.204). Given the inverse relationship between Ct value and the strength of the DNA signal, the results indicate slightly higher concentrations of target humpback whale eDNA in the Azores filters (Figure 11).
Feasibility constraints
The number of flukeprint samples per trip varied depending on trip duration and weather conditions. Approximately two to three samples (yielding up to six eDNA filters) were collected during 3 h tours in the Azores, two to four samples during ~8 h in Italy (yielding up to eight filters), and one to two samples (yielding up to 4 filters) during 3.2 h tours in Iceland. Filtration performance was generally high in the Azores and Italy. In the Azores, 10 L of seawater were consistently filtered within 10-15 min, while in Italy, the same volume was filtered in approximately 10 min. In Iceland, filtered volumes ranged from 4.5 to 10 L (mean = 8.5 L), with an average filtration time of ~40 min due to frequent filter clogging, likely due to particulate matter in the water in the study area. Specifically, 10 L were successfully filtered for 46 of the 98 filters (47%), volumes between 7 L and 10 L were obtained for 31 filters (32%), and volumes between 4 L and 7 L were obtained for 21 filters (21%) (Supplemental File 1-Supplemental Table S3).
The protocol recommends the filtration of one field-negative control after every five flukeprint samples. However, under operational whale-watching conditions, this could not be completely fulfilled in the described case study due to logistical constraints, including limited filter availability, time constraints, and shipping delays. This reduced the achievable control-to-sample ratios to 1:10.7 in Iceland (9/96), 1:12.6 in the Azores (12/151), and 1:15.3 in Italy (4/61). Despite these deviations, no field or laboratory negative controls showed amplification.
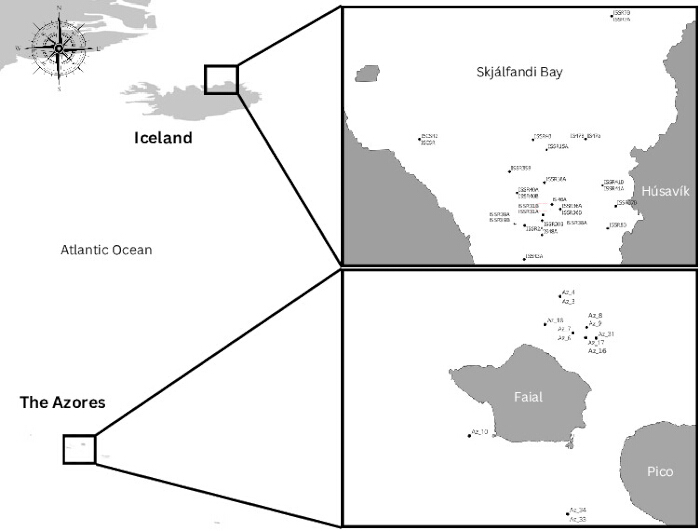
Figure 9: Overview of sample locations. Black dots in the map represent locations where samples were taken from a humpback whale flukeprint in Skjálfandi Bay (Iceland) and in the Azores. The name of the eDNA filter is indicated near the corresponding sampling region. Please click here to view a larger version of this figure.
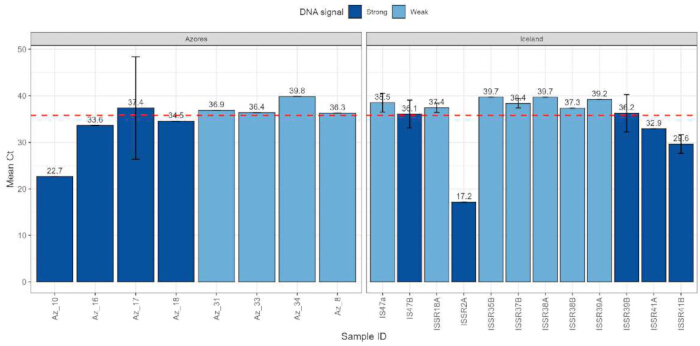
Figure 10: Detections from a subset of eDNA filters from the Azores and Iceland. qPCR mean Ct values and DNA signal strength for Azores and Iceland positive detections (at least one positive PCR replicate), with SD and LOD. Bars are colored by signal strength relative to the LOD: dark blue = strong signal (Ct ≤ 35.8) indicates reliable detections, light blue = weak signal (Ct > 35.8) indicates plausible detections. SD error bars represent variability between PCR replicates. The red dashed line indicates the LOD (Ct = 35.8). Mean Ct values are shown above each bar. Abbreviations: Ct = cycle threshold; SD = standard deviation; LOD = limit of detection. Please click here to view a larger version of this figure.
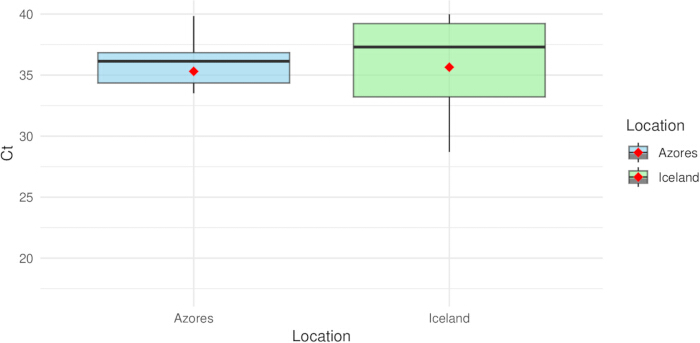
Figure 11: Mean cycle threshold values for humpback whale DNA detections from the Azores and Iceland. Black lines within the box plots indicate the median, and red squares represent the mean Ct values (SD), while whiskers represent the minimum and maximum values for the Azores and Iceland. The Mann-Whitney U test demonstrated that this difference was not statistically significant (U = 199.0, p = 0.204). Please click here to view a larger version of this figure.
Table 1: Primer and probe sequences for the ND5-targeted qPCR assay. These sequences include forward and reverse primers, MGB probe sequences (5′-3′), optimal annealing temperature, and assay limit of detection (LOD). (*) LOD is defined as the lowest DNA concentration (ng/µL) of the target species' DNA at which ≥95% of PCR replicates yielded positive amplification. Please click here to download this Table.
Table 2: Optimized cycling conditions for the humpback whale eDNA qPCR assay. These optimized qPCR settings are 95°C for 10 min (enzyme activation), then 40 cycles at 95°C for 15 s (denaturation) and 60°C for 90 s (annealing/extension). Please click here to download this Table.
Table 3: Overview of field sampling configuration. Overview of sampling regions, field partners, vessel types, target species, sampling periods, and sample replicates across the Azores, Iceland, and Italy. Please click here to download this Table.
Table 4: qPCR detection summary for environmental samples and controls. Positive detections (highlighted in yellow), qPCR replicate Ct values, and detection outcomes are shown; samples were classified as positive when at least one of the qPCR replicates showed amplification. "No Ct" indicates no amplification, negative controls showed no amplification, and the M. novaeangliae standard dilution series used to define assay performance and the LOD is included at the bottom of the table. Please click here to download this Table.
Supplemental File 1: Contains Supplemental Figures and Tables, providing additional information on the protocol application, including primer design eDNA sampling kit, whale-watching vessel types, self-preserving eDNA filter characteristics, reagent volumes for DNA extraction and qPCR reactions, and variations in filtration rates across sampling regions. Please click here to download this File.
Supplemental File 2: Field datasheet used during cetacean eDNA sampling. Standardized form for recording cruise metadata, cetacean observations, and sample and filter information. Please click here to download this File.
Supplemental File 3: Step-by-step field protocol for cetacean eDNA sampling aboard whale-watching vessels, including equipment cleaning, seawater collection and onboard filtration, sample reporting, and storage. Please click here to download this File.
Supplemental File 4: Cetacean eDNA sampling spreadsheet template. Standardized form for recording sampling information after sample collection and onboard filtration. Please click here to download this File.
Discussion
Operational feasibility and field implementation
The protocol presented here contributes a standardized, eDNA workflow that balances detection sensitivity with real-world constraints. By integrating large-volume, flukeprint-targeted sampling, onboard filtration using self-preserving enclosed filters, and standardized contamination control measures, the protocol provides a reproducible framework that can be applied across regions and sampling campaigns. This approach aligns with the growing recognition of eDNA as a cost-efficient and scalable complement to conventional marine monitoring techniques9,10,22.
Previous cetacean eDNA studies have relied largely on transect-based seawater sampling from large research vessels or opportunistic small-volume sampling near cetacean sightings. Transect-based approaches enable broad spatial coverage but often capture diluted and temporally decoupled DNA signals, limiting detections of rare or transient species71, even when sampling occurs near the surface, and typically requires specialized vessels and infrastructure25,37,72. Conversely, small-volume sampling near surfacing whales improves encounter specificity but remains prone to false negatives due to limited water volumes and inconsistent filtration practices72,73. By explicitly targeting flukeprints and filtering large volumes on board, the workflow presented here increases the probability of capturing low-concentration cetacean eDNA while remaining feasible under the time and space constraints typical of whale-watching operations. The use of enclosed, self-preserving filters further minimizes handling and contamination risks, eliminating the need for field-applied preservation buffers and simplifying logistics under constrained onboard conditions42,66.
To ensure cross-study comparability, the following parameters must remain fixed within a sampling campaign: collection of seawater directly from visible cetacean flukeprints; two 10 L biological replicates per flukeprint; use of self-preserving eDNA filters immetiate onboard filtration during standardized contamination control measures, including regular field negative controls at a defined minimum frequency; and species-specific qPCR screening performed in triplicate with appropriate controls. Other parameters may vary without compromising the methodological framework, provided they are applied consistently and transparently reported, including water-collection equipment and handling, filter pore size, pump type and tubing configuration, filtration duration and achievable filtered volume under clogging conditions, onboard sample logistics, and short-term storage conditions prior to shipment. As many processing steps in eDNA studies remain variable, rigorous reporting of all sampling and analytical steps is strongly recommended.
The feasibility of this protocol is highest under calm to moderate sea states (≤ Beaufort 3), with low to moderate turbidity, when onboard time and space allow the processing of two eDNA filters per flukeprint and a filtered water volume of 10 L per filter. In practice, trained scientists can sample up to Beaufort 3, but citizen scientists should only work in calm conditions (Beaufort 1-2), due to vessel motion and turbulence, despite whale-watching tours sometimes operating at Beaufort 3. Filtration should begin as soon as possible after water collection to minimize DNA degradation47,74. Sampling strategies that minimize propeller-induced dilution of surface eDNA, such as sampling from the leeward and lower sides of the vessel, further support targeting accuracy and reliable detections47. Avoiding reverse maneuvering and preventing ropes (attached to buckets) from contacting seawater samples further reduces contamination risk, consistent with aquatic eDNA best practices38. Depending on vessel configuration and logistics (e.g., vessel height, motion, and available onboard space), two sampling strategies are supported if applied consistently: (i) independent collection and filtration of two 10 L replicates using two separate buckets, or (ii) collection of a single 20 L water sample transferred to a sealed sterile container for safe onboard transport and subsequently split into two 10 L replicates for filtration. A filtration volume of 10 L per filter represents a practical compromise between detection probability and filtration effort under whale-watching conditions.
Larger volumes enhance the likelihood of capturing rare or low-concentration eDNA, and reduce false negatives common in cetacean studies39,40,75, while remaining operationally feasible when paired with self-preserving filters and large pore sizes42. Elevated particulate loads, vessel motion, limited deck space, or time constraints may reduce filtration efficiency and achievable volumes, thereby limiting the applicability of the protocol. In such cases, protocol-aligned adaptations, such as reduced water volumes or alternative filter pore sizes may be required and should be applied consistently within sampling campaigns to maintain data comparability. Trip duration, timing of whale encounters, and filtration capacity determine the achievable sample numbers. On standard 3 h whale-watching tours, one to two flukeprint samples (occasionally three) can typically be completed without disrupting operations or the citizen science experience. During longer expeditions, sampling capacity scales with daily whale-watching effort (e.g., ~8 h/day in our Italy case study). In practice, eDNA sampling could be implemented at all three locations during peak tourist activity.
eDNA amplification success and contamination control
Environmental samples, especially those collected in nutrient-rich waters, may contain PCR inhibitors capable of suppressing amplification and generating false negatives76. Although no inhibition was detected in prior analyses from Icelandic samples within the same project42, the inclusion of an inhibitor removal step ensured consistent amplification success (see Table of Materials) and aligns with best-practice recommendations for aquatic eDNA workflows14,55.
Consistent qPCR detection performance across regions indicates that the protocol reliably captures cetacean eDNA under diverse environmental conditions. Minor Ct variations likely reflect regional differences in temperature, turbidity, and productivity, which influence eDNA release, degradation, and dispersion75,76. The assay's limit of detection (0.0001 ng/µL) falls within the sensitivity range reported for other validated cetacean assays developed within the eWHALE project14,11,42. Detection rates were consistent with previously published flukeprint-based investigations, underscoring the influence of species behavior and surfacing frequency on detection success41,42,47. Tissue-derived DNA standards were used for qPCR quantification, reflecting a common practice in marine eDNA research57,72,77,78,79. While this approach may introduce variance in absolute quantification11,61,80,81,82,83, particularly for low-concentration and heterogeneous environmental samples84,85, it reflects real-world sample complexity55,86. The use of synthetic standards may improve quantitative reproducibility and inter-study comparability and is recommended for future applications11,87.
Potential contamination sources include cross-sample transfer, as well as the introduction of human or non-target environmental DNA during handling steps, which can lead to false-positive detections88. Strict contamination control is essential throughout field and laboratory processing, particularly under the constrained conditions typical of citizen science operations. Routine glove changes, the use of DNA-free equipment, enclosed filtration systems, standardized training, the routine inclusion of field and laboratory controls, documentation of potential contamination events, and assay validation following established frameworks are critical for ensuring data reliability and species detection11,31,49,51,55,89. Although plastic use is an unavoidable limitation of field-based molecular sampling, consumption was minimized where possible, and partially biodegradable filtration materials were used66.
Limitations, scalability and future implications
Filter clogging remains a key constraint in turbid or productive environments such as Skjálfandi Bay (Iceland), where suspended organic matter and plankton density likely reduced filtration efficiency43,90. Recording filtration duration, indicators of filter clogging such as reduced flow, visible air bubbles in the filter, or pump strain, and limiting filtration time to approximately 45 minutes per replicate supports downstream interpretation and comparison. Using a sterilized floating device to suspend the filter or gravity-fed filtration bags can potentially reduce handling time during filtration, though the latter may be incompatible with self-preserving eDNA filters and large volumes (≥1 L)91. Larger pore size filters (≥ 5 µm) may further improve filtration rates, though taxon-specific detection efficiency should be evaluated during pilot sampling for cetacean eDNA45,92.
Key considerations prior to full-scale sampling include: prioritizing onboard filtration over delayed processing, maintaining consistent water volumes and filter configuration, conducting pilot sampling to optimize filtration under local conditions, and aligning sampling effort with vessel capacity and trip duration. Digital data-entry tools that enable structured, in-field recording by citizen scientists are recommended for future applications93.
The successful application of this start-to-end workflow demonstrates robustness under operational constraints while highlighting limitations related to space, time, weather, and contamination risks inherent to citizen science contexts10,94. Despite these constraints, whale watching vessels represent a powerful and underutilized platform for eDNA cetacean monitoring when standardized training and supervision are provided31,32,42,95. Integrating this workflow with established cetacean monitoring tools, such as photo-identification, passive acoustics, and biopsy sampling, can link genetic detections with behavioral and demographic data. While this study focuses on species-specific qPCR-based detection, future applications could integrate DNA metabarcoding or population genetic analyses, further expanding the ecological and conservation value of cetacean eDNA monitoring.
As eDNA-based approaches continue to flourish, this workflow provides a scalable foundation for integrating genetic monitoring into existing marine observation and conservation programs, particularly in cetacean hotspots and sensitive ecosystems.
Disclosures
Belén García Ovide is the founder and executive director of Ocean Missions, a non-profit organization focused on ocean conservation and based in Húsavík, Northeast Iceland. Ocean Missions coordinates sampling from whale-watching vessels in Iceland, as well as from Arctic expedition vessels. She also serves as the representative of North Sailing, a whale-watching company in Húsavík, within the eWHALE project. These affiliations did not influence the study design, data collection, analysis, or interpretation of the results.
Acknowledgements
We would like to acknowledge all the people involved in fieldwork and laboratory work, namely:
i) Aidan Mabey, Matteo Tosato, Anouk Adolph, Jeanne Laporte, Romi Neerot and Isabell Österle, which participated in samples collected in Skjálfandi Bay, Iceland; ii) Dania Tesei, Michael Costa, Rita Norberto, Marlene Schwandt, Rita Leitão, Ricardo Ventura, Martijn Schouten, Giada Viscontini, Katharina Leeb, Anthony Le Floch, Francisco Nunes, Renato Cardoso, Faustine Darius, Monique Schouten, Laura Biet in the Azores (Portugal); iii) Sandra Schallhart, Jana Robertson in Austria; and iv) Sabina Airoldi, Mario Gabualdi, Marina Costa, Morgana Vighi, Nino Pierantonio, Roberto Raineri for data collection in the Pelagos Sanctuary (Italy).
This research was funded by Biodiversa+, the European Biodiversity Partnership under the 2021-2022 BiodivProtect joint call for research proposals, co-funded by the European Commission (GA No. 101052342) and with the funding organizations: 1) The Icelandic Center for Research (RANNÍS), (Grant No. 229030), 2) Ministry of Universities and Research (MUR), from the FIRST and IGRUE special account relating to the European partnership Biodiversa+ Call 2021 - eWHALE project, 3) the Austrian Science Fund (FWF) [doi: 10.55776/I6389] and the publication fund of the University of Innsbruck.
Materials
| Name | Company | Catalog Number | Comments |
|---|---|---|---|
| Alternative eDNA filters: SterivexTM /Waterra | Merck Millipore/Waterra Pumps Limited | SVHVL10RC/NA | 0.45 µm pore size. Require eDNA preservation buffers |
| AW1, AW2, AE buffers | Qiagen | 19081, 19072, 19077 | Buffer solutions used for DNA purification during extraction |
| Bleach solution (1:10) | DM - Denk mit, Hygienereiniger | Customized | Surface decontamination. All steps in laboratory processes |
| Buckets | Boating shops, fishing gear, Amazon | Rigid. Rubber or hard plastic (≥ 10 L). One or more depending on the sampling set-up and onboard logistics | |
| Cleanup Reagent, Express PCR | ExoSAP-IT | 75001.1.EA | PCR products preparation for Sanger sequencing |
| Cooling box | Housing | Insulated rigid container or cooling bag | |
| Disposable gloves, Large (L) and Medium (M) sizes, Powder-Free | Kimberly-Clark | 43431, 55090 | Disposable nitrile or latex gloves, 100-units box. Amount required: 1 box per 10 - 15 trips |
| DNA standards (3 μL) | NA | Customized | DNA tissue-derived- serial dilution (8 points, 10 ng/µL) from humpback whale. Calibration in qPCR |
| DNA-safe laboratory clothing | Falano, PP-Overall | 081-2900 | All steps in laboratory processes. |
| eDNA container | Housing or hardware stores | NA | Lidded, durable, transparent (≥ 10 L). |
| Elution plate, Rod cover, Wash plates, Bind plate | Qiagen | 19581, 997004, 1031656, 302570 | Plastics used for DNA extraction |
| Ethanol (8:10) | Endure , ACS ISO Rang | Various | Bench sterilization. All laboratory steps |
| Field data sheets | |||
| Fluorescence-based high sensitivity assay | Thermo Fisher Scientific | Q32851 | Qubit dsDNA High Sensitivity assay (Thermo Fisher Scientific, Waltham, USA) |
| High-speed centrifuge (24,000 rpm) | Hettich Zentrifugen | Separates DNA-containing supernatant from debris. DNA lysis | |
| Ice packs | Housing stores | Cooling of the samples inside shipping container | |
| IPC forward and reverse primers | Integrated DNA Technologies | NA | Custom product used for the amplification of target species DNA |
| IPC PrimeTime qPCR Probes | Integrated DNA Technologies | NA | Custom product used for the amplification of target species DNA |
| Laminar flow hood | Kendro Laboratory Products | VFS1206 | Sterile environment for reagent preparations in qPCR preparation |
| Laminated illustrated field protocol | Customized | ||
| Lysis buffer | Qiagen | 79216 | DNeasy lysis buffer AL. Alternative to TES Buffer + Proteinase K |
| Magnetic-bead–based DNA robot | KingFisher Apex 96 PCR head | 5400910 | Software: BindIx PC |
| Magnetic particles for nucleic acid binding (30 µL) | Qiagen | 67563 | MagAttract particles. Facilitates DNA binding to magnetic beads in DNA extraction |
| Master mix (5 μL) | EMM, Life Technologies | 4396838 | TaqMan Environmental Master Mix (2.0) |
| Mini Plate Spinner Centrifuge | Labnet | C1000 | Spin down liquid droplets and condensation from PCR and microplates |
| OneStep-96 PCR Inhibitor Removal Kit | ZYMO Research | D6035 | Purification and removal of contaminants in eDNA extracts |
| PCR Plates | Bio-Rad | HSP9601 | Hard-Shell 96-Well |
| Pipettes + sterile filtered tips | Pipettes: BIOHIT, Filter tips: Biozym Safe Seal Tips professional | Various | Manual or electronic pipettes can be used at various maximum volumes |
| Plate Spinner Centrifuge | NA | NA | Removes bubbles before qPCR |
| Proteinase K | Avantor VWR | A4392.0010 | Digests proteins to help release DNA during lysis |
| Purified water | MilliQ | NA | RNase free water, used for negative controls and cleaning solution |
| Reaction tubes (2 mL) | Eppendorf | 30120094 | DNA lysis |
| Real-time quantitative PCR thermocycler | Analytikjena | NA | QTower 3G platform. Amplifies and quantifies DNA in real time |
| Ropes | Boating, hardware stores, fishing harbors | NA | Strong material (e.g., polyethylene or braid rope). Length at least two times the height of the vessel |
| Sealing film, adhesive, optical | Bio-Rad | MSB1001 | Microseal 'B'. Seal PRC plate before PCR |
| Self-preserving eDNA filters | Smith-Root | 11579-25 | 1.2 µm pore size. Amount per sampling campaign: as needed |
| Shipping container | Laboratories, pharmacies, Amazon | Various | Styrofoam insulated |
| Software for biological sequence alignment and analysis | Bio Edit | Version 7 | User-Friendly Biological Sequence Alignment Editor and Analysis Program for Windows 95/98/NT |
| Squeeze bottle | Laboratories, pharmacies | Various | Filled with household bleach (1:10) |
| Statistical analysis software | R Studio Team. (2023) | Version 4.2.1 | |
| Sterilized DNA-free gloves | Sempercare edition | 79712 | All steps in laboratory processes. |
| TES buffer | Custom product, equivalent to DNeasy lysis buffer | ||
| Toxic waste container | Safe disposal of hazardous waste. All steps | ||
| UV lamp | SterilAIR | Hood sterilization for qPCR preparation | |
| Vortex-genie 2 vortex mixer | Thermo Fisher Scientific | 50728002 | Homogenizes and mixes reagents. DNA lysis, extraction |
| Waste container | Housing stores | Small rigid container | |
| Water pump (peristaltic/vacuum) | Eijkelkamp; Solinst/Smith-Root | 12.34.SB; 410/12099 | Portable pumps |
| Waterproof marker | Various |
References
- Hammerschlag, N., et al. Ecosystem function and services of aquatic predators in the Anthropocene. Trends Ecol Evol. 34 (4), 369-383 (2019).
- Sequeira, A. M. M., et al. Overhauling ocean spatial planning to improve marine megafauna conservation. Front Mar Sci. 6, 639(2019).
- Noren, D. P., Mocklin, J. A. Review of cetacean biopsy techniques: Factors contributing to successful sample collection and physiological and behavioral impacts. Mar Mamm Sci. 28 (1), 154-199 (2012).
- Evans, P. G. H., Hammond, P. S. Monitoring cetaceans in European waters. Mammal Rev. 34 (1-2), 131-156 (2004).
- Bittencourt, L., et al. Mapping cetacean sounds using a passive acoustic monitoring system towed by an autonomous Wave Glider in the Southwestern Atlantic Ocean. Deep Sea Res Part I. 142, 58-68 (2018).
- Balmer, B. C., et al. Advances in cetacean telemetry: A review of single-pin transmitter attachment techniques on small cetaceans and development of a new satellite-linked transmitter design. Mar Mamm Sci. 30 (2), 656-673 (2014).
- Angliss, R. P., et al. Comparing manned to unmanned aerial surveys for cetacean monitoring in the Arctic: Methods and operational results. J Unmanned Veh Syst. 6 (3), 109-127 (2018).
- Jahoda, M., et al. Mediterranean fin whale (Balaenoptera physalus) response to small vessels and biopsy sampling assessed through passive tracking and timing of respiration. Mar Mamm Sci. 19 (1), 96-110 (2003).
- Fu, M., Hemery, L., Sather, N. Cost efficiency of environmental DNA compared to conventional methods for biodiversity monitoring at marine energy sites. PNNL Rep. , PNNL-32310(2021).
- Sahu, A., et al. Environmental DNA (eDNA): Powerful technique for biodiversity conservation. J Nat Conserv. 71, 126325(2023).
- Klymus, K. E., et al. Development and testing of species-specific quantitative PCR assays for environmental DNA applications. J Vis Exp. (165), e61825(2020).
- Wilcox, T. M., et al. Robust detection of rare species using environmental DNA: The importance of primer specificity. PLoS ONE. 8 (3), e59520(2013).
- Wilcox Talbot, L. A., et al. Validated environmental DNA assay for detection of the rare Rice's whale (Balaenoptera ricei). Environ DNA. 7 (2), e70074(2025).
- Rodriguez, L. K., et al. Inter-laboratory ring test for environmental DNA extraction protocols: Implications for marine megafauna detection using novel qPCR assays. Metabarcoding Metagenomics. 9, e128235(2025).
- Adams, C. I., et al. Beyond biodiversity: Can environmental DNA cut it as a population genetics tool. Genes. 10 (3), 192(2019).
- Parsons, K. M., et al. Water everywhere: Environmental DNA can unlock population structure in elusive marine species. R Soc Open Sci. 5 (8), 180537(2018).
- Rourke, M. L., et al. Environmental DNA as a tool for assessing fish biomass: A review. Environ DNA. 4 (1), 9-33 (2022).
- Sard, N. M., et al. Comparison of fish detections using environmental DNA metabarcoding and traditional gears. Environ DNA. 1 (4), 368-384 (2019).
- Sigsgaard, E. E., et al. Population-level inferences from environmental DNA-Current status and future perspectives. Evol Appl. 13 (2), 245-262 (2020).
- Afonso, L., et al. Environmental DNA as a complementary tool for biodiversity monitoring. PLoS ONE. 19 (10), e0300992(2024).
- Silliman, K., et al. Evaluating prey availability for the Rice's whale based on environmental DNA. Ecol Evol. 16 (1), e72789(2026).
- Boyse, E., et al. Environmental DNA reveals fine-scale spatial and temporal variation of marine mammals and prey species. Environ DNA. 6 (4), e587(2024).
- Székely, D., Cammen, K. M., Olsen, M. T. Using environmental DNA to study marine mammals in the North Atlantic. NAMMCO Sci Publ. 12, (2021).
- Alter, S. E., et al. Using environmental DNA to detect whales and dolphins in the New York Bight. Front Conserv Sci. 3, 820377(2022).
- Parsons, K. M., et al. Environmental DNA for monitoring marine mammals: Challenges and opportunities. Front Mar Sci. 9, 987774(2022).
- Couton, M., Viard, F., Altermatt, F. Opportunities and inherent limits of using environmental DNA for population genetics. Environ DNA. 5 (5), 1048-1064 (2023).
- Leerhøi, F., et al. Exploring the potential of extreme citizen science with Danish high school students using environmental DNA for marine monitoring. Front Mar Sci. 11, 1347298(2024).
- Tøttrup, A. P., et al. Citizens in the lab: Performance and validation of eDNA results. Citiz Sci Theory Pract. 6 (1), (2021).
- Kelly, R., et al. Citizen science and marine conservation: A global review. Philos Trans R Soc B. 375 (1814), 20190461(2020).
- Church, E. K., et al. From citizen science experiences to stewardship action. Mar Policy. 173, 106537(2025).
- Barbaccia, E., et al. Combining citizen science, environmental DNA, and whale watching. Ocean Coast Manag. 269, 107827(2025).
- Barbaccia, E., et al. Willingness to engage in marine conservation through eDNA-informed citizen science. Sci Rep. 15 (1), 41983(2025).
- Broadhurst, H. A., et al. Citizen scientists' motivation to participate in environmental DNA (eDNA) surveys. Citiz Sci Theory Pract. 10 (1), (2025).
- O'Connor, S., et al. Whale Watching Worldwide. , Int Fund Anim Welfare. Yarmouth, MA. (2009).
- Valsecchi, E., et al. Ferries and environmental DNA: Underway sampling from commercial vessels. Front Mar Sci. 8, 704786(2021).
- Foote, A. D., et al. Investigating the potential use of environmental DNA (eDNA) for genetic monitoring of marine mammals. PLoS ONE. 7 (8), e41781(2012).
- Baker, C. S., et al. Environmental DNA (eDNA) from the wake of the whales. Front Mar Sci. 5, 342201(2018).
- Takahashi, M., et al. Aquatic environmental DNA: A review. Sci Total Environ. 873, 162322(2023).
- Govindarajan, A. F., et al. Improved biodiversity detection using a large-volume environmental DNA sampler. Deep Sea Res Part I. 189, 103871(2022).
- Bessey, C., et al. Maximizing fish detection with environmental DNA metabarcoding. Environ DNA. 2 (4), 493-504 (2020).
- Robinson, C. V., et al. DNA from dives: Species detection of humpback whales from flukeprint environmental DNA. Environ DNA. 6 (2), e524(2024).
- Rodriguez, L. K., et al. Enhancing environmental DNA sampling efficiency for cetacean detection. Environ DNA. 7 (3), e70103(2025).
- Jackman, J. M., et al. Performance of eDNA filtration methods in a hyper-tidal estuary. Environ DNA. 7 (5), e70206(2025).
- Majaneva, M., et al. Environmental DNA filtration techniques affect recovered biodiversity. Sci Rep. 8, 4682(2018).
- Liu, Q., et al. Optimization of pore size and filter material for better enrichment of environmental DNA. Front Environ Sci. 12, 1422269(2024).
- Li, J., et al. Effect of filtration method on environmental DNA capture efficiency. Mol Ecol Resour. 18 (5), 1102-1114 (2018).
- Robinson, C. V., et al. Temporal dynamics of flukeprint environmental DNA detection. Environ DNA. 7 (3), e70132(2025).
- Székely, D., et al. Environmental DNA captures the genetic diversity of bowhead whales. Environ DNA. 3 (1), 248-260 (2021).
- Bruce, K., et al. A practical guide to DNA-based methods for biodiversity assessment. Adv Books. 1, e68634(2021).
- Pogner, C. -E., et al. Airborne DNA: State of the art. Sci Total Environ. 957, 177439(2024).
- Goldberg, C. S., et al. Critical considerations for environmental DNA detection. Methods Ecol Evol. 7 (11), 1299-1307 (2016).
- Combining environmental DNA sampling, whale watching and citizen science. , eWHALE Project. accessed (2025).
- Klotz, L., et al. Annual and monthly fluctuations in humpback whale presence. J Cetacean Res Manag. 16, 9-16 (2017).
- Peres dos Santos, R., et al. First humpback whale re-sighting. Polar Biol. 45 (3), 523-527 (2022).
- Thalinger, B., et al. Validation scale for environmental DNA assays. Environ DNA. 3 (4), 823-836 (2021).
- Hall, T. A. BioEdit. Nucleic Acids Symp Ser. 41, 95-98 (1999).
- Benoit, N. P., et al. Using qPCR of environmental DNA to estimate salmon biomass. Environ DNA. 5 (4), 683-696 (2023).
- Skovhus, T. L., et al. Real-time quantitative PCR for marine bacteria. Appl Environ Microbiol. 70 (4), 2373-2382 (2004).
- Godhe, A., et al. Quantification of diatom and dinoflagellate biomasses. Appl Environ Microbiol. 74 (23), 7174-7182 (2008).
- Baudry, T., et al. Influence of distance and seasonality in eDNA detection. Environ DNA. 5 (4), 733-749 (2023).
- Hunter, M. E., et al. Detection limits of PCR assays. Mol Ecol Resour. 17 (2), 221-229 (2017).
- Lee, J., et al. Species-specific eDNA assay for Ascidiella aspersa. Ecol Evol. 15 (11), e72453(2025).
- National Center for Biotechnology Information. BLAST. , accessed (2025).
- R Foundation. R. , (2023).
- susannat, eDNA sampling protocol: Smith-Root citizen scientist sampler. , protocols.io. (2024).
- Thomas, A., et al. Self-preserving eDNA filter. Methods Ecol Evol. 10, 1137-1145 (2019).
- Thalinger, B., et al. eDNA shedding of freshwater fish. Front Ecol Evol. 9, 623718(2021).
- Hymus, C. [PhD Thesis]. , Murdoch Univ. (2016).
- Rodriguez, L. K., Thalinger, B. DNA extraction - Qiagen BioSprint® 96 Workstation using the Biosprint 96 tissue protocol UIBK eWHALE. , protocols.io. (2024).
- Valsecchi, E., et al. Universal primers for marine mammals. Environ DNA. 2 (4), 460-476 (2020).
- Rota, A., Valsecchi, E. Floating Lab SOP. J Vis Exp. 222, e67366(2025).
- Robinson, C. V., et al. Limited cetacean detection by low-volume eDNA. Environ DNA. 5 (6), 1641-1651 (2023).
- Pinfield, R., et al. False-negative detections in killer whale presence. Environ DNA. 1 (4), 316-328 (2019).
- Strickler, K. M., et al. eDNA degradation. Biol Conserv. 183, 85-92 (2015).
- Rishan, S. T., et al. Applications of eDNA metabarcoding. Environ Adv. 12, 100370(2023).
- Schrader, C., et al. PCR inhibitors. J Appl Microbiol. 113 (5), 1014-1026 (2012).
- Thomsen, P. F., et al. Detection of marine fish fauna. PLoS ONE. 7 (8), e41732(2012).
- Guri, G., et al. Detection sensitivity of qPCR and ddPCR. Ecol Evol. 14 (12), e70678(2024).
- Andruszkiewicz, E. A., et al. Persistence of marine fish eDNA. PLoS ONE. 12 (9), e0185043(2017).
- Venegas, V., Halberg, M. C. mtDNA copy number. Methods Mol Biol. 837, 327-335 (2012).
- Naue, J., et al. mtDNA copy number variation. Mitochondrion. 74, 101823(2024).
- Andreu, A. L., et al. mtDNA copy number. Mitochondrion. 9 (4), 242-246 (2009).
- Langlois, V. S., et al. Robust qPCR-based eDNA assays. Environ DNA. 3 (3), 519-527 (2021).
- Barnes, M. A., Turner, C. R. Ecology of environmental DNA. Conserv Genet. 17, 1-17 (2016).
- Mathieu, C., et al. Variability in eDNA data. Front Ecol Evol. 8, 466868(2020).
- Wilson, C. C., et al. Synthetic controls for eDNA. Methods Ecol Evol. 7 (1), 23-29 (2016).
- Lux, M. W., et al. Reproducibility in synthetic biology. Synth Biol. 8 (1), ysad014(2023).
- Sepulveda, A. J., et al. Contamination in eDNA studies. Front Ecol Evol. 8, 609973(2020).
- Minamoto, T., et al. An illustrated manual for environmental DNA research. Environ DNA. 3 (1), 8-13 (2021).
- Barnes, M. A., et al. Environmental conditions influence eDNA persistence. Environ Sci Technol. 48 (3), 1819-1827 (2014).
- Oka, S. I., et al. Gravity filtration of eDNA. MethodsX. 9, 101838(2022).
- Berran, M. S., et al. eDNA sampling strategies. Hydrobiologia. 852, 3485-3501 (2025).
- Esri. ArcGIS Survey123. , (2025).
- Ralson, M. J., et al. Translating eDNA into conservation action. Conserv Sci Pract. 7 (2), e70000(2025).
- Dela Cruz-Modino, R., Cosentino, M. Whale-watching industry value. Sustainability. 14 (20), 13471(2022).
Reprints and Permissions
