Optical trawl surveys offer a non-invasive method of sampling groundfish populations and provide finer-scale data than traditional trawl surveys. This article provides a generalized procedure for an optical trawl survey of groundfish in New England.
Method Article
Optical Trawl Surveys of Groundfish: A Video Trawl Survey of Western Gulf of Maine Atlantic Cod (Gadus morhua)
In This Article
Summary
Abstract
Optical trawl surveys provide a non-invasive method for quantifying groundfish populations and can be used to complement or enhance traditional bottom trawl survey data. This protocol describes the School for Marine Science and Technology (SMAST) video trawl survey, an optical trawl system developed in collaboration with commercial fishermen to assess groundfish abundance and distribution in the Western Gulf of Maine. Cameras and lights were mounted within the codend of a modified commercial trawl to record fish as they passed through the open net. Net mensuration sensors, environmental sensors, and GPS were integrated to calculate area swept and derive density and biomass estimates. The example survey followed a stratified random design, completing 47 tows during a 10-day cruise in spring 2024. Video data were annotated to enumerate target species and validated with periodic closed-codend tows, and representative results for Atlantic cod were presented. This protocol demonstrates a replicable and minimally invasive approach for conducting optical trawl surveys of groundfish that provides high-resolution spatial and abundance data while reducing catch mortality. The method can be adapted to other demersal species and habitats to support fishery-independent monitoring, stock assessment, and ecological research.
Introduction
Atlantic cod (G. morhua) have long been a foundation of the New England groundfish fishery1, but the Western Gulf of Maine stock is currently classified as overfished, with landings at <2% of the historical peak in 198222. Low total allowable catches, implemented to promote recovery, constrain the harvest of more abundant species within the multispecies groundfish complex, creating economic and management challenges. Cod now functions as a choke species, limiting fishery operations once individual vessel quotas are met3. From 2010 to 2015, only 32% of the Northeast multispecies groundfish annual catch limit was harvested on average4,5. Since 2010, approximately one million metric tons of groundfish quota, valued at over $6 billion, have gone unharvested, partly due to restrictions on cod. Discrepancies between high commercial catch rates and low survey abundance indices have fueled debate over the true population status3,6,7,8,9,10, which may stem from survey limitations11, deviations from assumed selectivity12,13, or population aggregation within fishing areas14,15. The School for Marine Science and Technology (SMAST) video trawl survey was developed to help supplement existing stock information and alleviate some of these issues.
The goal of the SMAST video trawl survey is to provide fishery resource managers, marine scientists, and the fishing industry with an independent, non-invasive assessment of groundfish resources, specifically Western Gulf of Maine Atlantic cod16,17. Developed collaboratively with commercial fishermen, the survey integrates cameras and lights into a modified commercial trawl to record fish as they pass through the open codend13,16. The system combines high-resolution video with net mensuration, environmental, and positional data to calculate the area swept and estimate species-specific density and biomass. The survey’s open codend design allows fish to pass freely through the gear, reducing mortality18,19 and permitting extended tow durations that improve spatial coverage and the precision of estimates20. In addition to its application to cod, the SMAST video trawl survey provides a generalized framework for optical trawl sampling of a variety of species. By minimizing mortality and capturing fine-scale distributional data20, this approach could complement and enhance traditional trawl-based monitoring programs. The method can be adapted to different habitats and target species, providing high-resolution video data suitable for both quantitative stock assessment and ecological research. The implementation of this method will depend on environmental conditions and gear configurations. In high turbidity environments, net modifications are required to maintain adequate visibility21,22, and closed-codend tows should be conducted to validate counts for each species of interest. Here, a generalized procedure for an optical trawl survey of groundfish is described using the spring 2024 SMAST video trawl survey of Western Gulf of Maine Atlantic cod to exemplify the procedure and provide representative results.
Protocol
NOTE: All biological sampling was conducted within the University of Massachusetts Dartmouth’s guidelines and protocols.
1. Survey Design
- Identify an offshore survey vessel with hydraulic winches for trawling.
NOTE: Offshore commercial trawl vessels should be large enough for the necessary crew and duration of survey operations. - Identify a trawl net suitable for the target species and habitat.
NOTE: For the rocky substrate present in the Western Gulf of Maine, a 27 m rock hopper sweep was appropriate. For softer substrates, a chain sweep may be more efficient. It is important to consult with local commercial fishermen when determining net configuration - Modify the net to accommodate optical equipment and negate sediment disturbance.
- Include at least two light-emitting diode (LED) lights, a camera capable of live feed over coaxial cable, and a high-resolution and framerate action camera or stereoscopic camera.
NOTE: If the cable configuration allows for high-resolution live feed video, only one camera may be needed. - Position cameras and lights inside the net facing the codend, using a rigid polyethylene cylinder sewn into the trawl net as a base for mounting and to provide rigidity to the net.
- Mount a junction box in the cylinder to relay power and video feed between the lights and cameras, and a custom coaxial cable.
NOTE: The coaxial cable should allow for a real-time video feed to be viewed and recorded in the vessel’s wheelhouse. - Modify the net to keep the codend extension off the bottom and reduce sediment suspension within the view of the cameras.
NOTE: Typical modifications include adding floatation to the cylinder, lengthening the codend extension to get the cameras further from the sediment plume, and adding tarps to the belly of the net to suppress the sediment21,22. - Include a small mesh liner to prevent escapement during closed-codend tows.
NOTE: The SMAST video trawl survey uses a 50.8 mm liner.
- Include at least two light-emitting diode (LED) lights, a camera capable of live feed over coaxial cable, and a high-resolution and framerate action camera or stereoscopic camera.
- Design a statistically rigorous survey that provides a sufficient sample size and is tailored to the distribution of target species and variability in substrate.
NOTE: The SMAST video trawl survey utilizes a stratified random design based on strata from existing surveys, with cod aggregation areas isolated to their own strata.- Identify the total number of stations that will be surveyed.
- Allocate stations in the manner prescribed by the chosen survey methodology.
NOTE: The SMAST video trawl survey allocates stations to stratum by percentage of surface area, and start locations are randomly selected. - Allocate several backup stations in case of interference by complex substrate or fixed fishing gear.
2. Data collection
- Conduct a stereoscopic camera calibration underwater, if applicable, prior to the survey to ensure accurate measurements of fish.
NOTE: Stereoscopic calibration and validation are ongoing for the SMAST video trawl survey, and results presented here use lengths from closed-codend tows.- Capture video or images of a checkered grid at varying distances and angles from the camera.
- Isolate and measure images of this grid in stereoscopic camera calibration software.
- Run stereoscopic calibration software.
- Load equipment onto the survey vessel.
- Set up equipment on the vessel’s deck and in the trawl net.
- Arrange the survey net and a pressure-sensitive winch, equipped with a coaxial cable and attached slip ring on the vessel’s deck.
- Attach the survey trawl doors to the vessel’s winch cables.
- Use a temporary weld to secure the pressure-sensitive winch to the deck.
- Wire pressure-sensitive winch power cable into the vessel’s breaker box.
- Attach a cable block to the vessel's A-frame (or similar structure) for the coaxial cable to run through to the stern of the boat next to the net drum.
NOTE: When arranging the block, ensure the coaxial cable can run from the winch to the codend of the net while in the water without chafing against the vessel’s winch wires. - Attach the junction box to the rigid polyethylene cylinder (Figure 1).
- Attach the cameras and lights to the cylinder (Figure 1).
- Connect the cameras and lights to the junction box using camera and light cables affixed with waterproof connectors.
- Run the coaxial cable through a cable block hung from the vessel’s A-frame and attach it to the junction box in the cylinder.
- Weave the cable through the mesh of the net at the top center line to prevent twisting of the codend.
- Lash a short length of the cable directly to the cylinder above the connection to the junction box for tension relief.
- Secure the net mensuration sensor array to the net and trawl doors.
- Mount two door sensors and two wing sensors on the trawl to provide real-time information on doorspread and wingspread.
- Mount the headrope sensor and bottom contact sensor on the trawl net to provide real-time information on bottom contact and headrope height.
NOTE: For many species, bottom contact is essential for efficient capture and must be monitored. For other vertically distributed species, headrope height can be important in determining efficiency. - Attach a depth and temperature sensor to the net.
NOTE: This data may be recorded by the net mensuration sensor or a separate sensor.
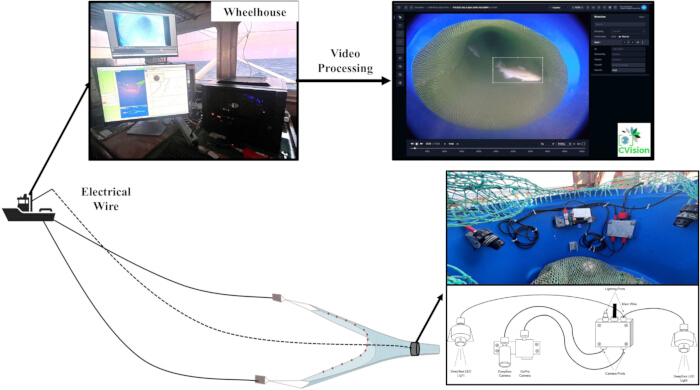
Figure 1: Diagram indicating the position and setup of the trawl codend and wheelhouse, with a screenshot of the video processing software. Please click here to view a larger version of this figure.
- Set up equipment in the vessel’s wheelhouse (Figure 1).
- Secure the computer and monitors for viewing video and running software to a suitable workstation in the wheelhouse.
- Connect global positioning systems (GPSs) devices to the computer.
- Connect the net mensuration receiver to the computer.
- Connect cameras and lights to power in the vessel’s wheelhouse.
- Attach the “deck end” of the wheelhouse run of coaxial cable to the slip ring in the pressure-sensitive winch.
- Attach the “wheelhouse end” of the wheelhouse run of coaxial cable to the computer, light power, and camera power.
- Open necessary software for recording data to ensure all gear is functioning properly before departure.
- Turn on the power to the cameras and open the video recording software to ensure the camera is functional.
NOTE: If the camera does not display, troubleshoot in a systematic manner. - Open the sensor software for recording temperature, depth, and net mensuration data.
- Open the software for recording location, speed, and heading.
- Open a mapping software to view vessel location in relation to randomly determined stations. Connect the second GPS device to the software by selecting the port it is plugged into.
- Turn on the power to the cameras and open the video recording software to ensure the camera is functional.
- Capture video and data for each tow.
- Launch mapping software to begin displaying vessel location.
- In the video recording software, ensure time and date stamps are displayed and correct.
- Enter the tow number to be overlayed on the video.
- Launch the net mensuration sensor software and begin recording.
- Slowly set the net and doors out using the vessel’s hydraulic winches.
NOTE: Ensure the vessel’s hydraulic winches are moving at a speed that the pressure-sensitive winch with coaxial cable can keep up with. Adjust the pressure of the winch to the sea conditions as needed. - Begin recording video and turn the power to the lights on once the cylinder enters the water.
NOTE: Underwater lights may overheat if left on while above water. - Begin recording location and speed data once the vessel’s hydraulic winches, controlling the net, are locked into position, indicating the start of the tow.
- Continue to tow for the allotted duration at each pre-determined tow location.
- Slowly haul back the net and doors using the vessel’s hydraulic winches.
- Stop recording location and speed data once the vessel’s hydraulic winches are engaged for haulback, indicating the end of the tow.
- Turn the power to the lights off once they reach the surface.
- Repeat all steps in section 2.5 for all stations.
- Conduct closed-codend tows to verify counts from video, verify stereoscopic measurements, and collect biological data on the catch.
- Close the codend of the net using the codend clip.
- Follow all steps under section 2.5 to collect video and sensor data for the tow.
- Empty codend of net onto the vessel deck.
- Sort catch into baskets by species.
- Measure, weigh, and sex (when possible) the first 100 individuals of each species.
- Collect basket weights and counts for the remainder of the catch.
- Offload all data from the wheelhouse computer to external hard drives.
- Review video to identify and enumerate target species (Figure 1).
- Upload all videos to the annotation software.
- Have trained technicians watch the video and annotate all target species and unidentified fish.
- Perform quality control of steps by viewing a subset of videos again using a second independent technician.
- Randomly select the videos to be reviewed by a second trained technician.
- Annotate any target species individuals that were missed by the previous technician.
- Delete any target species annotations for double-counted individuals.
- Verify species identification by having an expert review each annotated image to ensure the correct identifications have been made.
- Export data from annotation software.
- Include date, tow number, time stamps of annotated individuals, species of annotated individuals, and a unique identification number for each annotated individual in exported data.
3. Data products
- Calculate the area swept (km2) for each tow using either the doorspread or wingspread, depending on existing protocols for each species.
- Average doorspread (km) or wingspread (km) recorded between the start and end time of each survey tow.
- Average the vessel speed (km h-1) between the start and end time of each survey tow.
- Multiply the mean spread by mean vessel speed (km h-1) and tow duration (h).
- Convert the counts of each species in each open codend tow to weight (kg).
- Derive length-frequency distributions in centimeters for each species using measurements obtained from stereoscopic cameras or closed-codend tows.
- Assign size-class (cm) proportions by calculating the proportion of measured individuals in each length bin for each species.
- Estimate the number of fish in each size bin for all open codend tows by multiplying the total count by the proportion in each size bin (cm)
- Estimate mean weight (kg) per size bin using species-specific length-weight relationships derived from closed-codend samples or published literature.
- Convert counts from each open codend tow to catch in weight (kg) by multiplying the number of fish in each size bin by the mean weight (kg) of each size bin and summing the results.
NOTE: Uncertainty associated with the length–weight relationship was negligible relative to among-tow sampling variance and did not materially affect biomass estimates.
- Estimate the stratified mean density for each species, in abundance (fish m-1) and weight (kg m-1) across the survey area.
- Divide the catch in count and weight (kg) by the previously calculated area swept (km2) to get a density estimate for each tow.
- Calculate the stratified mean density (Xst) in count and weight (kg) for each species (Equation 123).
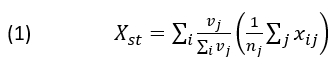
where nj = the number of tows in stratum j and xij = the density in tow i. The weighting is proportional to the area (km2) of stratum j (vj) within the survey area (km2)23. - Calculate variance of the stratified random density (
 ) as weighted average across strata (Equation 2),

where nj = the number of tows in a stratum j and = the variance of densities in stratum j23.
- Multiply the stratified mean density in count and weight (kg) by the total survey area to calculate abundance and biomass.
- Calculate the variance in abundance and biomass (kg2) by multiplying the variance in stratified mean density by survey area squared.
- Divide the biomass (kg) estimate by 1000 to report biomass in metric tons.
- Divide the biomass variance (kg2) estimate by 10002 to report in metric tons.
Results
The spring 2024 survey of the Western Gulf of Maine took place from May 9th-18th on the F/V Justice out of New Bedford, MA. The survey team consisted of a captain, three crew members, and three scientists. During the 10 days, 47 survey tows (four closed codend and 43 open codend) were completed during daylight hours (Figure 2). The survey tows were completed using the stratified random survey design described previously. The tows (n = 47) ranged from 0.04 to 3.15 h (Mean = 1.223 h; SD = 0.7477 h) in duration (Table 1). Mean vessel speed ranged from 4.6 to 6.6 km/h (Mean = 6.07 km/h; SD = 0.332 km/h) (Table 1). The mean doorspread varied from 34 to 56 m (Mean = 47.1 m; SD = 3.90 m) (Table 1). Doorspread was used to calculate the area swept due to the assumed herding behavior of cod 24,25.
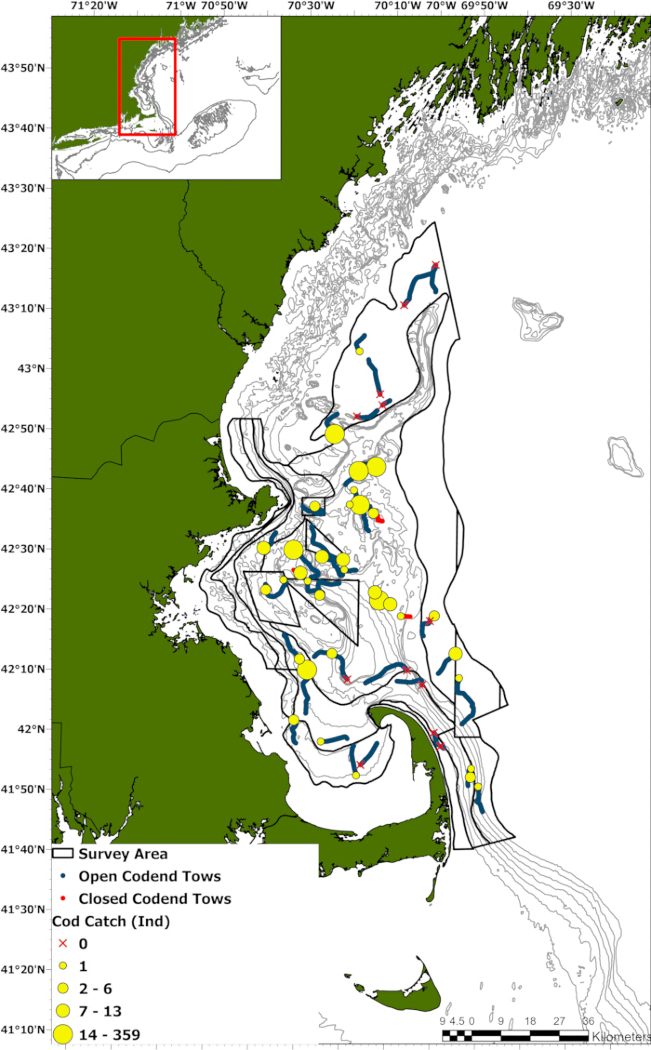
Figure 2: The open codend (blue) and closed-codend (red) tow tracks, from the spring 2024 SMAST video trawl survey, with cod catch (ind) indicated by the yellow bubbles. A red X indicates no catch. Please click here to view a larger version of this figure.
| Tow Number | Tow Type | Mean Depth (m) | Mean Temperature (Celsius) | Mean Doorspread (km) | Vessel Speed (km/h) | Area Swept (km2) | Catch (Ind) | Catch (kg) | Density (Ind/km2) | Density (kg/km2) |
| 1 | Open | 32.0 | 5.65 | 0.0469 | 6.3 | 0.44 | 1 | 2.01 | 2.3 | 4.70 |
| 2 | Open | 30.4 | 5.97 | 0.0490 | 6.1 | 0.42 | 0 | 0.00 | 0.0 | 0.00 |
| 3 | Open | 43.3 | 5.57 | 0.0475 | 5.9 | 0.40 | 1 | 2.01 | 2.5 | 5.00 |
| 4 | Open | 33.9 | 5.47 | 0.0344 | 6.1 | 0.29 | 3 | 6.04 | 10.4 | 16.61 |
| 5 | Open | 52.3 | 5.07 | 0.0469 | 6.1 | 0.69 | 14 | 28.18 | 20.3 | 46.86 |
| 6 | Open | 66.9 | 5.00 | 0.0482 | 6.0 | 0.29 | 6 | 12.08 | 20.8 | 49.90 |
| 7 | Open | 35.7 | 5.52 | 0.0411 | 6.1 | 0.38 | 0 | 0.00 | 0.0 | 0.00 |
| 8 | Open | 77.2 | 5.67 | 0.0480 | 5.9 | 0.40 | 1 | 2.01 | 2.5 | 4.90 |
| 9 | Open | 42.9 | 6.18 | 0.0431 | 6.2 | 0.12 | 2 | 4.03 | 16.0 | 31.51 |
| 10 | Open | 54.7 | 5.60 | 0.0428 | 5.8 | 0.06 | 1 | 2.01 | 16.8 | 28.66 |
| 11 | Open | 25.0 | 7.14 | 0.0410 | 5.9 | 0.05 | 0 | 0.00 | 0.0 | 0.00 |
| 12 | Open | 22.5 | 7.31 | 0.0447 | 5.9 | 0.18 | 0 | 0.00 | 0.0 | 0.00 |
| 13 | Open | 99.3 | 6.33 | 0.0479 | 6.0 | 0.91 | 1 | 2.01 | 1.1 | 2.00 |
| 14 | Open | 43.1 | 5.92 | 0.0448 | 6.1 | 0.70 | 0 | 0.00 | 0.0 | 0.00 |
| 15 | Open | 57.1 | 5.45 | 0.0476 | 6.1 | 0.45 | 0 | 0.00 | 0.0 | 0.00 |
| 16 | Open | 123.1 | 6.65 | 0.0540 | 6.1 | 0.46 | 9 | 18.11 | 19.7 | 50.47 |
| 17 | Open | 107.7 | 6.64 | 0.0470 | 6.4 | 0.31 | 0 | 0.00 | 0.0 | 0.00 |
| 18 | Closed | 116.5 | 6.46 | 0.0513 | 6.2 | 0.15 | 2 | 4.03 | 13.2 | 28.62 |
| 19 | Closed | 80.7 | 5.44 | 0.0499 | 5.7 | 0.14 | 1 | 2.01 | 7.0 | 13.26 |
| 20 | Open | 72.1 | 5.20 | 0.0429 | 5.3 | 0.05 | 9 | 18.11 | 192.9 | 274.60 |
| 21 | Open | 67.0 | 5.22 | 0.0458 | 5.7 | 0.14 | 31 | 62.40 | 216.5 | 360.85 |
| 22 | Open | 59.5 | 5.25 | 0.0486 | 4.6 | 0.01 | 8 | 16.10 | 870.7 | 1514.50 |
| 23 | Open | 88.9 | 5.16 | 0.0524 | 6.1 | 0.20 | 1 | 2.01 | 5.1 | 12.46 |
| 24 | Open | 87.2 | 5.16 | 0.0494 | 6.4 | 0.56 | 13 | 26.17 | 23.3 | 47.00 |
| 25 | Open | 35.4 | 5.51 | 0.0442 | 5.9 | 0.54 | 3 | 6.04 | 5.6 | 9.84 |
| 26 | Open | 31.7 | 5.79 | 0.0442 | 6.0 | 0.23 | 1 | 2.01 | 4.3 | 5.63 |
| 27 | Open | 84.0 | 5.27 | 0.0500 | 6.3 | 0.46 | 19 | 38.24 | 40.9 | 78.30 |
| 28 | Open | 74.9 | 5.21 | 0.0486 | 6.1 | 0.12 | 6 | 12.08 | 51.3 | 95.63 |
| 29 | Closed | 18.1 | 11.01 | 0.0445 | 9.1 | 0.21 | 1 | 2.01 | 4.7 | 13.67 |
| 30 | Open | 109.0 | 5.35 | 0.0502 | 6.6 | 0.22 | 1 | 2.01 | 4.6 | 10.11 |
| 31 | Open | 78.3 | 5.27 | 0.0512 | 6.3 | 0.67 | 359 | 722.59 | 536.0 | 1272.48 |
| 32 | Closed | 74.0 | 5.39 | 0.0532 | 5.6 | 0.15 | 46 | 92.59 | 316.3 | 906.69 |
| 33 | Open | 122.1 | 6.37 | 0.0469 | 5.8 | 0.41 | 0 | 0.00 | 0.0 | 0.00 |
| 34 | Open | 138.6 | 6.93 | 0.0460 | 6.1 | 0.74 | 0 | 0.00 | 0.0 | 0.00 |
| 35 | Open | 122.4 | 6.49 | 0.0486 | 6.3 | 0.30 | 1 | 2.01 | 3.3 | 7.24 |
| 36 | Open | 115.6 | 6.45 | 0.0463 | 6.1 | 0.53 | 0 | 0.00 | 0.0 | 0.00 |
| 37 | Open | 118.2 | 6.29 | 0.0463 | 5.9 | 0.12 | 0 | 0.00 | 0.0 | 0.00 |
| 38 | Open | 141.4 | 6.79 | 0.0473 | 5.9 | 0.33 | 0 | 0.00 | 0.0 | 0.00 |
| 39 | Open | 106.9 | 6.14 | 0.0489 | 6.4 | 0.43 | 35 | 70.45 | 81.8 | 177.05 |
| 41 | Open | 91.7 | 5.12 | 0.0465 | 6.4 | 0.50 | 5 | 10.06 | 10.0 | 21.47 |
| 42 | Open | 106.1 | 5.17 | 0.0461 | 6.0 | 0.75 | 7 | 14.09 | 9.3 | 20.98 |
| 44 | Open | 60.6 | 5.12 | 0.0438 | 6.3 | 0.28 | 11 | 22.14 | 39.0 | 82.14 |
| 45 | Closed | 25.2 | 7.67 | 0.0406 | 6.5 | 0.25 | 10 | 20.13 | 40.7 | 75.96 |
| 46 | Open | 67.2 | 5.97 | 0.0495 | 6.2 | 0.55 | 15 | 30.19 | 17.4 | 34.99 |
| 47 | Open | 75.9 | 5.13 | 0.0559 | 6.2 | 0.09 | 2 | 4.03 | 21.3 | 42.81 |
| 48 | Open | 80.4 | 5.09 | 0.0453 | 6.5 | 0.46 | 1 | 2.01 | 2.2 | 4.40 |
| 49 | Open | 57.3 | 5.03 | 0.0518 | 6.2 | 0.47 | 5 | 10.06 | 10.6 | 21.30 |
Table 1: A summary of the 47 usable tows completed on the spring 2024 SMAST video trawl survey. Please click here to download this Table.
Atlantic cod counts per tow, from the video, varied from zero to 359 individuals (Mean = 13.5; SD = 52.40) (Table 1; Figure 2). The four closed-codend tows used to collect biological data caught 54 cod which ranged from 41 to 81 cm in length (Mean = 58.9 cm: SD = 9.74 cm) (Figure 3), and from 0.7 to 7.0 kg in weight (Mean = 2.43 kg; SD = 1.300 kg) (Figure 4). When converted to weight, cod catch ranged from 0.0 to 722.6 kg (Mean = 27.06 kg; SD = 104.465 kg) (Table 1). The stratified mean cod density per km2 was 57.9 individuals (+4.9 individuals) and 118.2 kg (+9.7 kg). When multiplied by the 7,920 km2 survey area, the area-swept abundance and biomass for cod was 458,889 individuals (+38,458 individuals) and 936 t (+77 t), respectively.
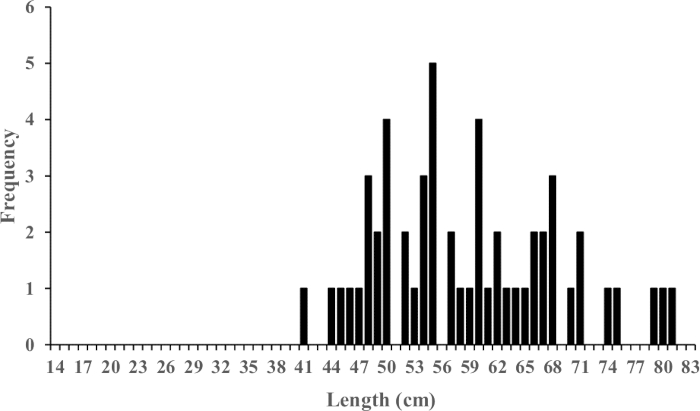
Figure 3: Length frequency distribution of Atlantic cod (n = 54) from the closed-codend tows during the spring 2024 survey. Please click here to view a larger version of this figure.
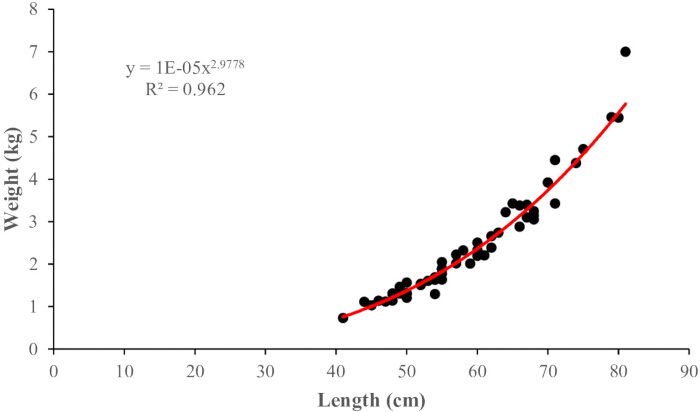
Figure 4: The length-weight relationship of Atlantic cod (n = 54) captured during the spring 2024 survey. Please click here to view a larger version of this figure.
Discussion
The data products produced by optical trawl surveys are analogous to those derived from traditional bottom trawl surveys; however, capture-related mortality is reduced18,19 and the catch data is collected on a finer spatial scale20. Since optical trawls collect continuous video data rather than discrete point-based catches, the time during each tow when a fish enters the codend can be deduced. This unique approach allows for the examination of fish distribution within individual tows, enabling assessment of factors such as tow duration, encounter rates, and within-tow variability20 without the need for paired or side-by-side experimental tows.
Considerations for survey design are fundamentally the same as those applied to traditional bottom trawl surveys and depend on target species behavior and the characteristics of the survey area. Stratified random designs are commonly used in marine fisheries, where the survey area is stratified by latitude and depth when sampling for multiple species26. Fish distribution is assumed to be uniform within strata23. This assumption is often violated by fish behavior (i.e., spawning), season, environmental changes, fishing practices, and within stratum habitat variability27,28,29,30. When surveying a single species, many of these assumptions can be validated by tailoring the survey design to the distribution and behavior of that species.
The survey vessel and equipment can also be modified based on target species and habitat. The survey vessel should be chosen based on the survey area, ensuring the size is adequate to house the equipment, crew, and researchers for the duration of the survey. The amount of coaxial cable necessary is dependent on the depth of the survey area and should be greater than three times the maximum depth to account for the scope of the trawl wire. Net selection should follow the same principles as traditional trawl surveys, using gear with known efficiency where available. When assuming 100% efficiency for conservative population estimates, it is beneficial to work with commercial fishermen to develop the most effective net configuration for the target species and habitat. If surveying in softer substrates, the net can be modified to suppress or avoid sediment suspension21,22. Tarps placed in the belly can suppress the sediment cloud. Lengthening the codend extension and providing flotation to the cameras can lift the codend above the sediment cloud.
In harsh operating environments, electrical equipment failures are common, with most issues first identified through signal loss or degraded video quality. These problems are often caused by twisting or excessive strain on the coaxial cables and can be minimized by routing the cable along the net centerline, providing strain relief near the camera junction, and maintaining appropriate tension on the pressure-compensated winch during deployment and retrieval. When issues arise, troubleshooting should proceed in a systematic manner by verifying power delivery and data continuity at each connection point, isolating components sequentially until the source of the failure is identified.
In recent decades, underwater technology has advanced substantially, with many reasonably priced, off-the-shelf options becoming widely available. However, the frame rate and shutter style are important considerations, especially when using stereoscopic cameras. Inadequate frame rates and rolling shutters can cause motion blur, making species identification and measurement difficult or impossible20. When possible, global-shutter cameras should be used to minimize distortion and blur around fast-swimming species, thus improving optical data processing. Manual annotation of video is time-intensive and is the primary limitation to producing timely results. Advances in computer vision and machine-learning image analysis offer significant potential to reduce this burden by automating species detection and counting; however, these approaches require large, well-annotated training datasets and rigorous validation before they can replace human review 31.
Optical trawl survey methods can provide non-invasive abundance estimates, which are of particular interest to endangered species. For example, during a Western Gulf of Maine survey, the SMAST video trawl captured 47 Atlantic sturgeon (Acipenser oxyrinchus oxyrinchus) passing through the net unharmed. A major advantage of optical data is that the video provides a permanent record of the catch, enabling future analysis and transparency of results. During the surveys targeting cod, multiple instances of sea lamprey (Petromyzon marinus) attached to hosts were also observed20,32. The methods described in this article can be generalized to many species effectively captured by trawls and provide a minimally invasive way of estimating population size. The design, protocols, and equipment can all be customized to the specific needs of the survey.
Disclosures
The authors have nothing to disclose.
Acknowledgements
We would like to thank the Sea Scallop Research Set Aside Program (Award #NA24NMFX454G0013-T1-01), Massachusetts Division of Marine Fisheries, and Marine Fisheries Institute (Award #UMASSDEMRKSTKSBYFY26) for funding this survey, in addition to the invaluable guidance from their personnel. The video trawl survey would not have been possible without the help of Danny Eilertsen, Ronnie Borjeson, Bob Kohl, Tim Barrett, Mike Matulaitis, and Andrew Earle, of the F/V Justice. We would also like to thank all of the SMAST faculty and students who assisted with this project, including Chris Rillahan, Travis Lowery, Craig Lego, Amanda Meli, Caitlyn Riley, Andie Painten, and Patricia Perez.
Materials
| Name | Company | Catalog Number | Comments |
|---|---|---|---|
| 8" Iceplast 1085 center hole trawl floats | Iceplast | 1085 | Provides buoyancy to the headrope of the trawl net to increase headrope height off bottom; provides buoyancy to the polyethylene cylinder to keep it off bottom |
| ArcGIS Pro v3.5 | ESRI | N/A | Mapping software |
| Benthic 4 Camera Housing | Group B LLC | CH-B4 | Underwater housing for HD video camera |
| Big Fin Measuring Board | Big Fin Scientific | DCS5 | Electronic measuring board for biological sampling on closed tows |
| Camera Cable | SubConn | IL4F-L4M Pigtail Custom | Transmission of power and electrical signals from camera to junction box |
| Camera Mounts | Electromechanica | Custom | Mounts the Deepsea and GoPro cameras in the polyethylene clylinder side-by-side |
| Camera Power Supply | B&K Precision Corp. | 9130 | Conversion of boat power to appropriate voltage for cameras |
| Coaxial Optical Cable | Seven Valley Specialty Cable | Custom | Transmission of power and electrical signals from junction box to vessel deck/wheelhouse |
| Deepsea Multi-SeaCam, Color Multi SeaCam, Titanium housing, Seacon BH4 connector, Pal Video format | DeepSea Power & Light | 740-048-101-0B-02 | Live video feed underwater camera |
| Deepsea Multi-SeaCam, LED Multi SeaCam, Low Light Black and White, Titanium Housing, Seacon BH4 Connector, EIA Video Format | DeepSea Power & Light | 740-067-001-0B-03 | Live video feed underwater camera with lights built in |
| Desktop Computer | Various | Custom | Windows based operating system with fiber optic interface |
| Digitizer | University of Massachusetts, Dartmouth | N/A | Video data collection program |
| Fiberglass sheave in metal housing | Diversified Marine | Custom | Attaches next to the net drum, guides coaxial cable over the side of the vessel and into the water |
| Fisheries Logbook Data Recording Software (FLDRS) | NOAA Fisheries | Version 4.1.7 | Software to document start and end times and locations of trawl tow; records speed, heading, and location during tow at 30 second time intervals |
| GoPro Hero9 | GoPro | CHDHX-901-MX/CHDHX-901-XX/TH | HD video camera |
| Hydraulic Winch | Diversified Marine | Custom | Tension sensitive winch for deployment and retrieval of coaxial optic cable |
| LED SeaLite 1000, Daylight White LEDs, Flood | DeepSea Power & Light | LSL-1000 | Underwater LED light |
| Light Cable | SubConn | MCIL3M-Ysplit-2xMCILF Custom | Transmission of power and electrical signals from lights to junction box |
| Light Power Supply | B&K Precision Corp. | XLN30052 | Conversion of boat power to appropriate voltage for lights |
| Marel M1100 PL2262 Portable Marine Scale | Marel | M1100 PL2262 | Portable scale for biological sampling on closed tows |
| Marel M1100e Marine Scale | Marel | M1100 PL4220 | Large marine scale for biological sampling on closed tows |
| Maruson True Double Conversion, DSP Technology, Rack and Tower Uninterruptible Power Supply | Maruson UPS Systems | ULT-1.5KRT | Stabilizes boat power so there are no interuptions for the wheelhouse set-up; provides back-up power if the boat power is cut |
| Open Broadcaster Software (OBS) | Version 32.0.1 | Software to display live video feed in the wheelhouse and record video | |
| Optical Slip Ring | Focal | ESR 1802674 | Transmission of power and electrical signals to rotating cable on winch |
| Polyethylene Cylinders | Graystone Industries | EP-PT6530 | Provides a rigid surface within the trawl net for mounting cameras, lights, and junction box |
| RBRduet3 T.D | RBR Global | SL3-M22_SEC23-ST21_SP21 | Provides continuous temperature and depth data |
| Samsung Galaxy Tab Active 2 Tablet | Samsung | Galaxy Tab Active 3 SM-T570 | Tablet connects to Merrel Scale and Big Fin Measuring Board to automatically collect measurement data |
| Simrad PX MultiSensor MK2 | Kongsberg | 420643, 420642, 419122 | Provides doorspread, wingspread, headrope height, and temperature data |
| Simrad SR15 Sensor Receiver | Kongsberg | 418973 | Receives signal from hydrophone |
| Stereoscopic camera housings | Sexton Co. | Custom | Underwater housing for HD stereoscopic video camera |
| Stereoscopic cameras | Lucid Vision Labs | TRI089S-MC | HD stereoscopic video cameras |
| Tator | CVision AI, Inc | N/A | Video annotator program |
| Trawl Hydrophone, Hull Mounted | Kongsberg | HYD-20524 | Records acoustic signals from Simrad sensors |
| Trawl net extension with 50.8 mm mesh liner | Reidar's Manufacturing, Inc. | Custom | Extends the trawl net to allow for sediment fall-out for clearer video |
| TV80 Processor | Kongsberg | PI5-201001-INC | Computer for displaying and collecting data from the Simrad PX MultiSensors |
| TV80 Software | Kongsberg | 321028 | Software to display data collected by Simrad PX MultiSensors |
| Two-bridle trawl net with 120 mm mesh, 3 mm twine, and a 27 m rock hopper sweep | Reidar's Manufacturing, Inc. | Custom | Trawl net for deploying cameras and lights |
| Underwater Junction Box | University of Massachusetts, Dartmouth | N/A | Connection of power and electrical signals from camera and lights to hybrid cable |
| USB GNSS GPS Receiver | USGlobalSat | USB GNSS GPS Receiver | Global Positioing System device for use in ArcGIS Pro and FLDRS |
| Wheelhouse Run | Electromechanica | Custom | Segment of coaxial optic wire adapted to plug into optical slip ring on one end and light power and computer on the other |
References
- Kurlansky, M. Cod: A biography of the fish that changed the world. , Penguin Books. (2000).
- Assessment of Gulf of Maine Atlantic cod (Gadus morhua). , Northeast Fisheries Science Center. (2024).
- Fisheries of the northeastern United States; northeast multispecies fishery; 2019 and 2020 sector operations plans and allocation of northeast multispecies annual catch entitlements. Fed Regist. 84 (103), Federal Register. (2019).
- Rothschild, B. J., Chen, C., Wilson, J. Discards and the groundfish fishery: An economic and management challenge. Mar Policy. 40, 1-5 (2013).
- Murphy, J., et al. Groundfish catch limits and utilization in the Gulf of Maine. NOAA Tech. Memo. NMFS-NE-239. , (2015).
- Abel, D. New England fishermen hit hard by drastic cod cuts. , Boston Globe. https://www.bostonglobe.com (2014).
- Goodnough, A. New England fishermen feel pinched by tightened catch rules. , N. Y. Times. https://www.nytimes.com/2011/02/25/us/25cod.html (2011).
- Abel, D. Cod collapse spurs anger and worry in New England. , Boston Globe. https://www.bostonglobe.com (2014).
- Bell, R. Fishery managers slash cod quotas. , Gloucester Daily Times. https://www.gloucestertimes.com (2014).
- Castañón, R. New England cod stocks still struggling. , Natl Fisherman. https://www.nationalfisherman.com (2017).
- Grabowski, J. H., et al. Fishery-independent surveys and the challenges of estimating abundance for structurally complex habitats. ICES J. Mar. Sci. 77 (2), 573-588 (2020).
- Butterworth, D. S., et al. Bias in fishery stock assessments due to incorrect selectivity assumptions. Fish Res. 158, 35-48 (2014).
- Dean, M. J., Hoffman, W. S., Armstrong, M. P. Changes in trawl survey catchability of Gulf of Maine cod. ICES J Mar Sci. 77 (2), 589-602 (2020).
- Kerr, L. A., Cadrin, S. X., Kovach, A. I. Consequences of a climate-driven shift in stock structure on the Gulf of Maine Atlantic cod fishery. ICES J Mar Sci. 71 (9), 2418-2431 (2014).
- Richardson, D. E. Spatial distribution and aggregation of Atlantic cod (Gadus morhua) in the Gulf of Maine. Can J Fish Aquat Sci. 71 (8), 1247-1259 (2014).
- DeCelles, G. R., Martins, D., Stokesbury, K. D. E. The SMAST video trawl survey: A non-lethal sampling method for groundfish. ICES J Mar Sci. 74 (8), 2223-2234 (2017).
- Stokesbury, K. D. E., Rillahan, C. B., Baker, J., Matulaitis, M. Development of an optical trawl survey for groundfish in the Gulf of Maine. Fish Res. 204, 209-220 (2018).
- DeAlteris, J. T., Reifsteck, D. M. Escapement and survival of fish from the codend of a demersal trawl. ICES Mar Sci Symp. 196, 128-131 (1993).
- Soldal, A. V., Isaksen, B., Marteinsson, J. E., Engås, A. Scale damage and survival of cod and haddock escaping from a demersal trawl. ICES Mar Sci Symp. , (1991).
- Calabrese, N. M. Look but don’t touch: Minimally invasive trawl survey technology. [Ph.D. Dissertation]. , University of Massachusetts Dartmouth. (2025).
- Tenningen, M., Rosen, S., Westergerling, E. H. T., Handegard, N. O. How to obtain clear images from in-trawl cameras near the seabed? A case study from the Barents Sea demersal fishing grounds. Fish. Res. 268, 106856(2023).
- Sokolova, M., O’Neill, F. G., Savina, E., Krag, L. A. Test and development of a sediment-suppressing system for catch monitoring in demersal trawls. Fish. Res. 251, 106323(2022).
- Krebs, C. J. Ecological methodology. , Harper and Row. New York. (1989).
- Wardle, C. S. Fish behavior and fishing gear. Behaviour of Teleost Fishes. Pitcher, T. J. , 2nd ed, Chapman and Hall. (1993).
- Nguyen, V. Y., Bayse, S. M., Einarsson, H. A., Ingólfsson, ÓA. Inferring fish behaviour at the trawl mouth from Escape Location. PeerJ. 11, e14746(2023).
- Grosslein, M. D., Azarovitz, T. R., Sissenwine, M. P. Design and conduct of bottom trawl surveys for demersal fish populations on the northeast continental shelf. J. Fish. Res. Board Can. 26, 123-132 (1969).
- Blanchard, J. L., Maxwell, D. L., Jennings, S. Power of monitoring surveys to detect abundance trends in depleted fish populations: The effects of density-dependent habitat use, patchiness, and climate change. ICES J Mar Sci. 65, 111-120 (2008).
- Vanderwal, J., Shoo, L. P., Williams, S. E. New approaches to understanding climate change impacts on species distributions. Ecography. 36, 001-013 (2013).
- Wang, Y., Chen, X., Li, G. Environmental influences on fish community structure in coastal systems. Fish Oceanogr. 27, 1-14 (2018).
- Maunder, M. N., Piner, K. R. Contemporary fisheries stock assessment: Many issues still remain. ICES J Mar Sci. 72, 7-18 (2015).
- Wilson, K. C., Lurbur, M., Yochum, N. Automated fish detection in videos to support commercial fishing sustainability and innovation in the Alaska walleye pollock (Gadus chalcogrammus) trawl fishery. ICES J Mar Sci. 82 (9), fsaf168(2025).
- Calabrese, N. M., Merhoff, S. L., Norton, H. L., Stokesbury, K. D. E. In situ observations of juvenile sea lampreys (Petromyzon marinus) in the Gulf of Maine from a noninvasive trawl survey. Mar Coast Fish. 17 (5), vtaf028(2025).
Reprints and Permissions
