This article presents a live-cell LysoTracker protocol to measure lysosomal remodeling during senescence in IMR-90 human fibroblasts.
A subscription to JoVE is required to view this content. Sign in or start your free trial.
Method Article
Lysosomal Profiling With LysoTracker For Quantitative Assessment of Cellular Senescence In Human Fibroblasts
In This Article
Summary
Abstract
Cellular senescence is a stable cell-cycle arrest state associated with characteristic phenotypes, including enlarged cell morphology, altered secretory signaling, and pronounced lysosomal remodeling. Senescent cells commonly exhibit expansion of the acidic endo-lysosomal compartment, accompanied by changes in luminal acidity and degradative capacity, creating an opportunity for simple live-cell readouts of senescence-linked organelle remodeling. This work describes a live-cell imaging protocol that uses LysoTracker Deep Red, an acidotropic fluorescent dye, to provide an indirect, pH-dependent proxy for the acidic organelle compartment as a correlate of senescence burden. The method is demonstrated in IMR-90 human lung fibroblasts undergoing replicative senescence across serial passaging. The protocol details cell culture and passage tracking, LysoTracker staining, fluorescence imaging, and image-based quantification of lysosomal signal intensity and signal-positive area per cell. Senescence-associated β-galactosidase (SA-β-Gal) staining on parallel cultures is included as an optional confirmatory marker rather than a reference standard. Representative outcomes show higher acidotropic fluorescent dye signal and larger lyso-positive regions in late-passage cultures than in early-passage controls, consistent with expansion of the acidic organelle compartment during senescence. Because the readout depends on compartment volume, proton gradient, and dye availability, it is best interpreted as an indirect correlate of lysosomal remodeling rather than a direct measure of lysosome number or biogenesis. The protocol is simple to adopt and can be adapted to other cell types or senescence-inducing stresses, providing a practical, quantitative complement to conventional endpoint assays.
Introduction
Cellular senescence is a durable cell-cycle arrest program activated by various stresses and aging-related triggers1,2,3,4. Senescent cells are classically identified by a constellation of markers, since no single marker is completely specific. Hallmarks include enlarged, flattened cell morphology, senescence-associated β-galactosidase (SA-β-Gal) activity, formation of DNA damage foci, and a pro-inflammatory secretory profile (SASP)2,4,5. Among these features, lysosomal remodeling has emerged as a prominent and functionally significant trait of senescence6,7. Senescent cells display profound lysosomal changes, including a dramatic expansion in lysosomal size and number along with altered function (often involving partial neutralization of lysosomal pH and accumulation of undegraded material)6,7,8,9. This lysosomal expansion contributes to increased SA-β-Gal activity, an established senescence marker that reflects elevated lysosomal β-galactosidase activity in senescent cells10,11,12. Indeed, SA-β-Gal staining exploits this phenomenon by using a suboptimal pH (6.0) incubation to selectively precipitate dye in senescent-cell lysosomes, which have accumulated the enzyme and exhibit a higher pH than young cells10,12,13.
Lysosomes play central roles in protein turnover and signaling, and their dysregulation is now considered a hallmark of aging and senescence1,2,4,6. Senescent cells often exhibit lysosomal dysfunction, evidenced by elevated luminal pH, altered enzyme activity, and accumulation of lipofuscin (an autofluorescent pigment of oxidized macromolecules)6,14. Lysosomal biogenesis is frequently upregulated or altered through the coordinated lysosomal expression and regulation (CLEAR) network under the control of transcription factor EB (TFEB) and related factors6,7,15. This process can increase lysosomal mass in senescent cells as they adapt to stress by expanding the degradative compartment6,7,10. Conversely, senescent cells may also experience lysosomal functional decline (e.g., reduced acidity), which can impact processes such as autophagy and confer resistance to certain stresses, including ferroptotic cell death6,8. Measuring lysosomal content and function is therefore central to understanding and identifying senescence6,16.
LysoTracker Deep Red is a membrane-permeant fluorescent probe that accumulates selectively in acidic organelles through protonation-driven trapping across the lysosomal membrane16,17. The resulting signal reflects the combined acidic-compartment volume, proton gradient strength, and local dye availability rather than lysosomal mass, and can shift with changes in lysosomal pH or membrane state that occur independently of total lysosome number6,16. In the context of cellular senescence, cells exhibit expanded and more intensely labeled LysoTracker-positive compartments compared to pre-senescent counterparts9, consistent with the expansion of the acidic organelle compartment and increased lysosomal biogenesis reported by biochemical and ultrastructural studies6,7,10. This live-cell approach offers several advantages over conventional endpoint SA-β-Gal staining: it enables quantitative and spatially resolved analysis of individual cells, can be combined with other fluorescent reporters, does not require fixation, and captures heterogeneity by reporting continuous features rather than a binary endpoint6,16. Throughout this protocol, LysoTracker signal is used as a readout of the acidic organelle compartment in living cells, and condition-dependent changes are interpreted accordingly rather than treated as an absolute measure of lysosome number6,16.
This protocol details the use of LysoTracker Deep Red to profile lysosomal changes in IMR-90 fibroblasts undergoing replicative senescence. IMR-90 is a normal human diploid fibroblast line (female, fetal lung origin) widely used in aging research; like other primary-like fibroblasts (e.g., WI-38), IMR-90 cells enter senescence after ~50–60 population doublings (the Hayflick limit) due to telomere shortening and DNA damage signaling18,19. The protocol describes how to culture IMR-90 cells to induce senescence via serial passaging, verify senescence by morphology and SA-β-Gal staining, and stain live cultures with LysoTracker Deep Red for fluorescence imaging5,10,12,13. Image acquisition and analysis are included, with quantitative readouts such as lysosomal count per cell, total lysosomal area per cell, and mean fluorescence intensity. Experimental controls and safety considerations are emphasized, including careful handling of dyes and fixatives, minimizing phototoxicity during imaging, and accounting for cellular autofluorescence in aged cells. The method is demonstrated using replicative senescence but can be adapted to other models, including drug-induced senescence (e.g., doxorubicin or etoposide treatment) or stress-induced premature senescence (SIPS) by oxidants2,3,4,19,20. In each case, LysoTracker-based readouts should be compared to appropriate controls (proliferating or quiescent cells) and, when possible, cross-validated with at least one traditional senescence marker (such as SA-β-Gal or p16INK4a expression)3,5,12,13.
Live-cell lysosomal profiling fills a practical gap in senescence assays by providing a reproducible, single-cell resolution measurement of a key organelle phenotype—lysosomal expansion—directly linked to senescent cell function (e.g., enhanced degradative capacity and secretory activity)2,3,4,6. Because LysoTracker staining is compatible with high-throughput imaging and flow cytometry, the protocol can be scaled for applications such as drug screening (e.g., testing senolytics or modulators of lysosomal function)2,3,6. As a future direction, per-cell lysosomal features generated by this protocol are amenable to downstream classification approaches, including machine-learning models; training and validation of such classifiers are beyond the scope of this protocol. Overall, this method (Figure 1) enables visualization and quantification of the lysosomal dimension of senescence biology, providing insight into how lysosomal biogenesis and morphology change during aging or stress and offering a platform for testing interventions targeting lysosomes in senescent cells. The image-analysis workflow used to segment nuclei, derive cell-associated regions, threshold, and quantify LysoTracker features, and reproduce the per-well and per-cell analyses presented here is implemented as an open-source companion package (SenTrackLite v0.5.0), provided as Supplementary File 1 and archived with a persistent DOI for citation and reuse21.
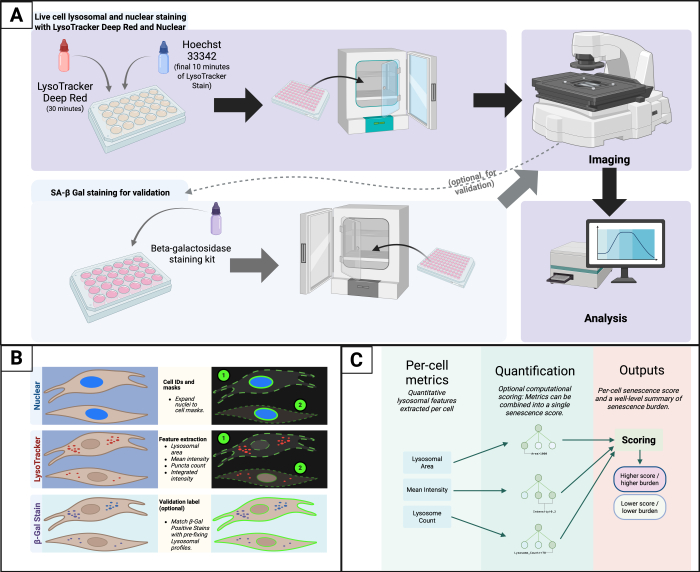
Figure 1: Overview of the live-cell lysosomal senescence assay. (A) Experimental workflow. Cells are stained live with LysoTracker Deep Red and a nuclear dye, imaged by standard fluorescence microscopy, and optionally processed in parallel for SA-β-Gal staining for validation. (B) Image-derived per-cell measurements. The nuclear channel is used to identify individual cells, and nucleus-anchored expansion defines a per-cell region for extracting lysosome-associated measurements from the LysoTracker channel. Representative per-cell measurements include lysosomal area, mean LysoTracker intensity, and lysosome count. SA-β-Gal staining can be used as an optional validation label when generating or confirming reference datasets. (C) Quantification and outputs. Per-cell lysosomal measurements are combined into a single per-cell senescence score or probability using a simple scoring approach. Outputs include per-cell values and well-level or condition-level summaries of senescence burden, which can be compared across senescence-induction or senolytic-treatment conditions. Created with BioRender.com
Please click here to view a larger version of this figure.
Access restricted. Please log in or start a trial to view this content.
Protocol
IMR-90 cells are an established human fibroblast cell line and do not constitute human subjects research. No ethical approval or informed consent was required. All procedures were conducted in accordance with the biosafety guidelines of the University at Albany, State University of New York for work with human-derived cell lines under Biosafety Level 2 (BSL-2) conditions.
1. General preparation and workflow overview
- Define the experimental goal as a live-cell lysosomal profiling assay using LysoTracker Deep Red staining and a live nuclear dye to quantify lysosomal remodeling as a continuous readout of senescence burden in IMR-90 cells. Define the primary biological comparison as one of the following designs:
- Senescence induction vs. matched non-induced control.
- Senescence-high vs. senescence-low conditions across a dose or time series.
- Senescence-high condition treated with a senolytic vs. vehicle-treated senescence-high control.
- Senolytic treatment series including both a senescence-low baseline group and a senescence-high group.
- Establish the minimum control structure for all experiments.
- Include a senescence-low control group matched for plating density, staining timing, and imaging settings.
- Include a senescence-high group generated by a defined senescence trigger or by late-passage replicative senescence.
- Include biological replicates per condition and perform staining and imaging with identical timing across conditions.
- Define assay readouts as direct image-based measures of lysosomal remodeling:
- Measure per-cell mean LysoTracker intensity within the lyso-positive mask using a consistent intensity threshold as the primary assay readout. At the single-cell level, this metric separates senescence-low from senescence-high conditions with the largest effect size and is insensitive to field-level nuclear density (Supplementary Figure 1).
- Record the following as secondary readouts, which document compartment expansion but are more sensitive to segmentation choices or field-level nuclear density: lysosome-enriched area per cell and integrated LysoTracker intensity per nucleus at the field level. Integrated intensity per nucleus is informative in well-populated fields but becomes unstable when a field contains a small number of nuclei, as per-nucleus normalization becomes dominated by individual cells.
- Record optional lysosome puncta count and size metrics when imaging resolution supports puncta discrimination.
- Use senescence-associated β-galactosidase (SA-β-Gal) staining as an optional validation step performed on parallel wells or matched samples, depending on experimental constraints. Use this validation to confirm that late-passage cultures exhibit increased SA-β-Gal positivity compared with early-passage cultures.
- Standardize the assay across conditions by fixing the following variables prior to data collection:
- LysoTracker working concentration (75 nM) and staining duration (30 min).
- Nuclear dye identity and working concentration range (e.g., Hoechst 33342 at 1 µg/mL to 2 µg/mL).
- Imaging parameters, including objective magnification, exposure time, illumination intensity, binning, and focus strategy.
- Plate format and imaging configuration (clear-bottom imaging plates or glass-bottom dishes), including replicate well layout.
- Threshold selection and intensity normalization.
- Apply a single fixed intensity threshold to the LysoTracker channel across all wells within an experiment to define the lyso-positive mask.
- Select the threshold once during assay setup using a calibration set of fields spanning the expected intensity range (e.g., two senescence-low and two senescence-high fields), and hold it constant across all wells within that session; allowing the threshold to vary per well introduces circular dependence between measurement and outcome.
- For cross-experiment comparisons, acquire all conditions in a single session under identical laser power, exposure, and gain settings and report these settings in the figure legend.
- If absolute intensity comparisons across sessions are required, include a fluorescent reference standard (e.g., a reference bead plate or fixed reference well) and normalize measured intensities accordingly.
NOTE: Do not compare raw intensity values across sessions without identical acquisition settings or reference-based normalization.
- Nuclear density normalization.
NOTE: Because senescent cultures typically exhibit reduced proliferation and lower nuclear density at comparable seeding times7,10, field-level metrics based on absolute pixel counts (e.g., total lyso-positive area) may be influenced by cell number per field.- Report both raw and per-nucleus normalized values (raw value divided by the number of Hoechst-segmented nuclei).
NOTE: Per-nucleus normalization controls for density-related confounds and is the appropriate comparison for per-cell interpretation. For area-based readouts, the normalized value serves as the primary metric, while the unnormalized total is retained for completeness.
- Report both raw and per-nucleus normalized values (raw value divided by the number of Hoechst-segmented nuclei).
- Acquire images under conditions that preserve live-cell signal quality and minimize technical variability. Keep early- and late-passage plates protected from light during staining and transport, and minimize time outside controlled culture conditions during imaging.
- Save fluorescence images as single-plane, single-channel, lossless TIFF files. Use a consistent naming scheme that preserves pairing between nuclear and LysoTracker images and maintains traceability to plate, well, condition, and replicate. Use a shared base name with channel suffixes (e.g., _Hoechst.tif and _Lyso.tif). Store images in a dedicated folder organized by experiment, with subfolders as needed.
NOTE: A practical pause point is after establishing early- and late-passage cohorts and confirming that late-passage cultures show slowed growth and senescence-like morphology. - (Optional) Include oxygen as an experimental variable by maintaining matched IMR-90 cohorts under ambient and low oxygen conditions. Process all groups identically.
2. Cell culture and induction of replicative senescence
- Thaw IMR-90 human lung fibroblasts according to standard cell culture practices and expand cells in Minimum Essential Medium (MEM) supplemented with 10% fetal bovine serum. Add penicillin-streptomycin at 1% if consistent with laboratory practice and experimental design. Maintain cells at 37 °C in 5% CO₂.
- Maintain cultures in logarithmic growth and passage before 70% to 80% confluence. Use consistent media handling and feeding schedules to reduce variability across experimental runs. Replace the complete culture medium every 2 to 3 days between passages.
NOTE: Do not allow medium to remain unchanged for more than 72 h, as nutrient depletion and accumulation of secreted factors can promote stress-induced phenotypes that confound replicative senescence. - Define the senescence-low baseline group as actively proliferating IMR-90 cultures maintained under conditions that preserve normal growth behavior. Match plating density and handling to all experimental groups.
- Generate a senescence-high group using one of the following approaches, chosen based on experimental aims.
- Induce replicative senescence by serial passaging with population doubling tracking until slowed proliferation and senescence-associated morphology are evident.
NOTE: Population doubling level (PDL) and passage number are distinct measures and are tracked separately. PDL refers to cumulative post-thaw doublings and is calculated at each passage as:
PDLi = PDLi-1 + log2(cells harvested / cells seeded)18,
whereas passage number counts the number of subcultures since thaw. Because cultures are typically split 1:4 at approximately 70%–80% confluence, each passage contributes about two population doublings, so passage number and cumulative PDL are not interchangeable.
NOTE: Senescence-high cultures are typically observed at advanced population-doubling levels, when proliferation slows, and senescence-associated morphology becomes evident. Exact thresholds should be determined empirically for each IMR-90 lot, as PDLs vary between vendors. - Stress-induced senescence by applying a defined senescence trigger and allowing an appropriate phenotypic development window.
- Treatment-induced senescence by exposing cells to the condition under study when the goal is to test whether that condition induces senescence.
- Induce replicative senescence by serial passaging with population doubling tracking until slowed proliferation and senescence-associated morphology are evident.
- Validate that the selected approach produces a senescence-high phenotype using at least one orthogonal readout performed on parallel wells. Perform SA-β-Gal staining as an optional validation method and document the fraction of positive cells per condition when included.
- A culture qualifies as senescence-high when at least 50% of cells show unambiguous blue perinuclear SA-β-Gal staining after 12 to 16 h incubation at pH 6.0, while the matched senescence-low control shows no more than 10% positive cells under identical staining conditions13.
- Values outside these bounds indicate incomplete senescence induction or elevated background and warrant re-optimization before proceeding to imaging.
NOTE: Pause after establishing senescence-low and senescence-high cohorts and confirming a clear phenotypic difference by morphology and optional validation staining.
- Optional: Senolytic treatment design
- Plate senescence-low and senescence-high conditions in replicate wells and allow cells to adhere and recover prior to treatment.
- Treat senescence-high wells with senolytic compound(s) and include a vehicle-treated senescence-high control.
- Include a senescence-low group treated with the same vehicle and, when relevant, the same compound concentration(s) to monitor non-senescent sensitivity.
- Proceed to live LysoTracker and nuclear staining at a consistent time after treatment across all conditions.
- Monitor cultures during late-passage/treatment progression and document morphology and growth patterns. Identify senescent cultures by slowed proliferation, enlarged and flattened morphology, and increased cytoplasmic granularity. Once growth arrest is evident, maintain the culture as the senescence-high cohort for staining and imaging rather than passaging further.
- Minimize confounding stressors during culture maintenance by using consistent media preparation, consistent feeding schedules, and consistent handling time outside the incubator. Treat temperature fluctuations, extended time outside controlled CO₂, and inconsistent media warming as sources of avoidable technical variability.
- Optional: Maintain matched cultures under ambient oxygen and low oxygen. Maintain cultures under 21% O₂ and under 5% O₂ as separate cohorts and keep each cohort under its assigned oxygen condition during routine culture handling when feasible. Limit exposure to ambient oxygen during transfers and imaging preparation for low oxygen cohorts.
NOTE: A practical pause point is after defining and stabilizing early-passage and late-passage cohorts and confirming that late-passage cultures show consistent slowed growth and senescence-associated morphology.
3. Live-cell lysosomal and nuclear staining with LysoTracker Deep Red and a nuclear dye
- Plate IMR-90 cells for all experimental conditions in clear-bottom imaging plates or glass-bottom dishes. Include a senescence-low control condition and at least one senescence-high condition generated by the selected trigger, and include biological replicates for each condition.
- Seed cells to achieve a subconfluent monolayer on the day of staining. Record the seeding density and the time between plating and staining for each experiment to support run-to-run comparability.
- Warm complete culture medium to 37 °C. Prepare a LysoTracker Deep Red working solution at 75 nM in the warmed medium and protect it from light. The working solution is prepared by diluting the 1 mM LysoTracker Deep Red stock (supplied by the manufacturer in DMSO) 1:13,333 in warmed complete culture medium (for example, 0.75 µL of 1 mM stock per 10 mL of warmed medium).
NOTE: Late-passage and stress-induced senescent cells accumulate lipofuscin and other non-specific autofluorescent material that emits across broad wavelength ranges and can contribute to apparent LysoTracker signal in unstained controls14. To estimate the contribution of autofluorescence in a given experiment, include at least one unstained well per condition and acquire it under identical imaging settings. Subtract the mean unstained-well signal from stained-well measurements, or report both raw and background-subtracted values.
NOTE: In practice, the unstained LysoTracker-channel signal in IMR-90 cultures is small relative to stained senescent signal (approximately 5% to 10% of the stained senescent mean in the present dataset), but the contribution increases with passage number and can become substantial (greater than 20%) in deeply senescent or oncogene-induced senescent cultures6,14. Always verify the autofluorescence magnitude when adopting this protocol for a new cell type or senescence-induction model. - Prepare sufficient LysoTracker working solution for all wells that will be stained in the run. Mix the working solution by gentle inversion and keep it protected from light until use.
- Aspirate spent medium from each well. Add LysoTracker working solution gently along the wall of the well to avoid disturbing the monolayer and maintain a consistent staining volume across wells.
- Incubate cells with LysoTracker for 30 min at 37 °C in 5% CO₂. Keep all experimental groups under the same incubation duration and temperature.
- Add a live nuclear dye during the final 10 min of LysoTracker incubation. Add Hoechst 33342 directly to the LysoTracker-containing medium at the manufacturer-recommended working concentration, for example 1 µg/mL to 2 µg/mL, and mix by gentle rocking of the plate.
- Remove the staining medium at the end of the incubation. Rinse cells once with pre-warmed phosphate-buffered saline to reduce background fluorescence.
- Add pre-warmed phenol red-free culture medium or an imaging buffer immediately after the rinse. Proceed directly to live imaging and maintain a consistent time between buffer exchange and image acquisition across all wells in the experiment.
- Protect plates from light during transfers and imaging setup. Minimize time spent outside controlled-temperature and CO₂ conditions during handling and image acquisition.
CAUTION: Handle fluorescent dyes using gloves and eye protection. Dispose of dye-containing liquids and contaminated consumables according to institutional chemical safety procedures.
NOTE: Use a pause point after Step 3.9 if imaging requires staging multiple plates. Keep plates protected from light at 37 °C and resume imaging as soon as possible to limit staining drift.
NOTE: If experimental design includes oxygen as a variable, maintain each cohort under its assigned oxygen condition during staining and incubation, and record the handling time outside the assigned condition.
4. SA-β-Gal staining for validation (optional)
- Use SA-β-Gal staining as an optional validation step to confirm that the senescence-high condition shows increased SA-β-Gal activity relative to the senescence-low control. Perform validation on parallel wells processed in the same plate format and under the same handling timeline as the imaging wells.
- Complete live imaging for the validation wells before fixation. When matched pre- and post-fixation comparisons of the same field are desired (Figure 2), record the stage coordinates at acquisition, re-locate each field manually after fixation and staining, and visually spot-check nuclear position and cell morphology to confirm that matched fields correspond before including them in downstream analysis.
- Fix cells using the fixation solution provided in the SA-β-Gal staining kit prepared at the recommended 1x working concentration containing 2% formaldehyde and 0.2% glutaraldehyde. Incubate for 10 min to 15 min at room temperature. For reference, the fixation solution contains 2% (w/v) formaldehyde and 0.2% (w/v) glutaraldehyde in phosphate-buffered saline. The SA-β-Gal staining solution at pH 6.0 contains 1 mg/mL X-gal (5-bromo-4-chloro-3-indolyl-β-D-galactopyranoside) dissolved in dimethylformamide immediately before use, 40 mM citric acid / sodium phosphate buffer at pH 6.0, 5 mM potassium ferrocyanide, 5 mM potassium ferricyanide, 150 mM NaCl, and 2 mM MgCl₂12,13. Commercial kits that match these specifications may be used interchangeably, provided the staining buffer pH is verified at 6.0.
- Remove fixative and rinse wells twice with phosphate-buffered saline. Add SA-β-Gal staining solution at pH 6.0 containing X-gal substrate to each well.
- Seal the plate to limit evaporation during incubation. Place the plate in a 37 °C, CO₂-free incubator for 12-16 h.
- Inspect wells by brightfield microscopy and document the staining pattern. Acquire representative images for each condition and report the fraction of SA-β-Gal-positive cells per well when validating results.
CAUTION: Formaldehyde and glutaraldehyde are toxic and volatile. Prepare and use fixation solution in a chemical fume hood and wear appropriate personal protective equipment including gloves, eye protection, and a lab coat.
NOTE: If SA-β-Gal staining shows high background in the senescence-low control or weak staining in the senescence-high condition, repeat validation after adjusting plating density, fixation duration, incubation duration, and temperature consistency while keeping buffer pH at 6.0.
Access restricted. Please log in or start a trial to view this content.
Results
Applying this protocol to IMR-90 fibroblasts across senescence-low and senescence-high conditions yields quantitative lysosomal readouts that can be summarized at the single-cell level and, when desired, at the whole-field level.
The representative dataset shown in the figures and tables derives from a single biological experiment comparing IMR-90 cultures at passage 13 (P13; senescence-low, ~PDL 26) and passage 23 (P23; senescence-high, ~PDL 46). Two wells per condition were imaged, with 44 f...
Access restricted. Please log in or start a trial to view this content.
Discussion
This protocol describes a live-cell imaging workflow that measures senescence via lysosomal remodeling and yields per-cell and per-well quantitative readouts of senescence burden. Several steps are particularly critical for obtaining a reliable assay. First, the biological model itself must be well controlled. Induction of replicative senescence in IMR-90 fibroblasts requires careful tracking of population doublings and parallel maintenance of early passage cultures as the non-senescent reference2...
Access restricted. Please log in or start a trial to view this content.
Disclosures
The authors have no conflicts of interest to disclose.
Acknowledgements
The research was funded by NIH grants R15CA274603 to JAM and TJB, R56DE033253 to ML, ST, and JAM, and R01GM125870, 1R41AG081123 to ST and JAM. Schematic figures were created with BioRender.com.
Access restricted. Please log in or start a trial to view this content.
Materials
| Name | Company | Catalog Number | Comments |
|---|---|---|---|
| 24-well tissue culture plate (flat bottom, TC-treated) | CellTreat Scientific Products | 229124 | Any clear-bottom multi-well culture plate compatible with live-cell fluorescence imaging (e.g., 6-, 12-, or 24-well TC-treated polystyrene plates; glass-bottom imaging plates may be preferred for higher-resolution imaging). |
| Beta-galactosidase staining kit (senescence assay) | Cell Signaling Technology | 9860 | Any commercial SA-β-galactosidase kit with verified staining buffer at pH 6.0. For reference, the fixation solution contains 2% formaldehyde and 0.2% glutaraldehyde in PBS, and the staining solution contains 1 mg/mL X-gal in DMF, 40 mM citrate/phosphate pH 6.0, 5 mM potassium ferrocyanide, 5 mM potassium ferricyanide, 150 mM NaCl, 2 mM MgCl2. |
| BioRender (scientific illustration software) | BioRender | N/A — web application | Used to create schematic figures (Figures 1–3). https://www.biorender.com |
| Carbon dioxide gas (CO2), compressed cylinder | Airgas (or similar supplier) | N/A | Medical-grade CO2 used to maintain 5% atmosphere in cell culture incubator and on-stage imaging chamber. |
| Fetal bovine serum (FBS), heat-inactivated | Thermo Fisher Scientific (Gibco) | 10082147 | Any cell-culture-grade FBS, heat-inactivated at 56 °C; used at 10% v/v in complete culture medium. |
| Fluorescence microscope with live-cell capability | Thermo Fisher Scientific | AMF7000 | Any widefield or confocal fluorescence microscope with live-cell temperature and CO2 control, filter sets for far-red (excitation ~647 nm / emission ~670 nm) and DAPI/Hoechst (excitation ~405 nm / emission ~460 nm) channels, and a 20×-40× objective with sufficient NA for resolving lysosomal features. The EVOS M7000 Imaging System was used in this study. |
| Hoechst 33342 nuclear stain | Thermo Fisher Scientific | H3570 | Cell-permeable DNA dye for live-cell nuclear staining (blue fluorescence, excitation ~405 nm). Not interchangeable with DAPI, which is not cell-permeant under physiological conditions. |
| Image analysis software | Python Software Foundation | N/A | Any scientific computing environment supporting nucleus segmentation, nucleus-to-cell region expansion, intensity thresholding, and basic image statistics (e.g., Python with scikit-image, MATLAB, ImageJ/Fiji, CellProfiler). The SenTrack pipeline (see Supplemental File S1) was developed for this study. |
| IMR-90 human lung fibroblasts (cell line) | ATCC | CCL-186 | Normal human fetal lung diploid fibroblast cell line used to model replicative senescence; any similarly characterized human fibroblast line may be substituted. |
| LysoTracker Deep Red | Thermo Fisher Scientific (Invitrogen) | L12492 | Acidotropic fluorescent dye for live-cell staining of acidic organelles; supplied as 1 mM stock in DMSO. Working concentration is 75nM in prepared cell culture media. Far-red emission (ex 647 nm / em 668 nm) minimizes overlap with lipofuscin autofluorescence but does not eliminate it. |
| Minimum Essential Medium (MEM) | Thermo Fisher Scientific (Gibco) | 11-095-080 | Basal culture medium for IMR-90 fibroblasts; supplemented with 10% FBS and 1% penicillin-streptomycin. Any standard formulation of Eagle's Minimum Essential Medium with Earle's salts and L-glutamine may be substituted. |
| Penicillin-streptomycin solution (100×) | Thermo Fisher Scientific (Gibco) | 15140122 | Antibiotic supplement for complete culture medium; used at 1% v/v (final concentration 100 U/mL penicillin, 100 μg/mL streptomycin). Any standard pen-strep solution may be substituted. |
| Phenol red-free imaging medium | Thermo Fisher Scientific (Gibco) | A1896701 | Phenol red-free DMEM or HBSS used for live-cell imaging to reduce background fluorescence during acquisition. FluoroBrite DMEM is one commonly used option; any phenol red-free imaging buffer supplemented with 10% FBS may be substituted. |
| Phosphate-buffered saline (PBS), pH 7.4 (1×) | Thermo Fisher Scientific (Gibco) | 10010023 | Isotonic buffer for cell washing and reagent dilution; any sterile 1× PBS at pH 7.4 may be substituted. |
| SenTrackLite v0.5.0 (software) | Open-Source (Estrada / Melendez Lab) | v0.5.0 | Open-source single-file Python / Tkinter application for lysosomal senescence image analysis. Distributed as Supplemental File S1. Archived at Zenodo, doi:10.5281/zenodo.19701255. MIT license. Source: https://github.com/goldbader-hub/Sentrack |
| Stage-top environmental chamber | Thermo Fisher Scientific | AMC2000 | Environmental chamber for on-microscope live-cell imaging with temperature (37 °C) and CO2 (5%) control. The EVOS Onstage Incubator was used in this study; any equivalent stage-top incubator may be substituted. |
Reprints and Permissions
