Here, we present a protocol to identify potential anti-tuberculosis drug candidates through phenotypic screening, encompassing the chemical synthesis of a 4-aminoquinoline compound, determination of its minimum inhibitory concentration against Mycobacterium tuberculosis, and assessment of its cytotoxicity in mammalian cell lines.
Method Article
Identification of Potential Anti-TB Candidates: A Step-by-Step Guide to Synthesis, MIC Determination, and Cytotoxicity Assessment in Mammalian Cells
* These authors contributed equally
In This Article
Summary
Abstract
Tuberculosis (TB) remains one of the leading causes of death from a single infectious agent worldwide, with rising rates of drug resistance making the development of novel therapeutic agents a global health priority. This protocol describes a phenotypic screening approach for identifying potential anti-TB drug candidates through three integrated stages. First, a compound from the 4-aminoquinoline class is synthesized via a three-step route and fully characterized by high-performance liquid chromatography (HPLC), nuclear magnetic resonance (NMR) spectroscopy, and high-resolution mass spectrometry (HRMS). Second, the antimicrobial activity of the compound is evaluated against Mycobacterium tuberculosis using the colorimetric resazurin reduction microplate assay (REMA), which determines the minimum inhibitory concentration (MIC) through a simple visual color-change readout. Third, the compound's cytotoxicity is assessed in two mammalian cell lines, Vero (African green monkey kidney) and HepG2 (human hepatocellular carcinoma), using the MTT assay (3-[4,5-dimethylthiazol-2-yl]-2,5-diphenyl tetrazolium bromide) and the neutral red uptake (NRU) assay. These two complementary assays measure distinct cellular parameters, enabling cross-validation of cytotoxicity results. Together, the MIC and cytotoxicity data allow calculation of a selectivity index (SI) to assess the therapeutic potential of each compound. This protocol provides a reproducible, step-by-step framework for early-stage anti-TB hit identification and preclinical evaluation.
Introduction
Caused predominantly by the bacillus Mycobacterium tuberculosis (Mtb), tuberculosis (TB) is an infectious respiratory disease in humans that primarily targets the lungs, although extrapulmonary variants can also occur. TB spreads through airborne Mtb bacilli released by individuals with active disease1. Depending on disease progression, a person infected with TB may immediately acquire active tuberculosis. Usually, however, a newly infected individual will develop latent tuberculosis, where Mtb cells with low metabolic activity survive inside granulomas1,2. A person with latent tuberculosis may eventually develop the active form of the disease, manifesting clinical symptoms3. Currently, it is estimated that one-fourth of the world’s population has latent tuberculosis infection4.
Despite many advances, TB remains a serious public health problem worldwide. Data from the most recent Global Tuberculosis Report show that 10.7 million people developed the disease in 2024. During the same year, 1.23 million deaths from TB were registered worldwide, making TB the leading cause of death by a single infectious agent5. Besides the pathology and complex biology of Mtb, socio-economic aspects such as poverty and malnutrition, along with health-related factors such as smoking, diabetes, and HIV co-infection, make disease control even more challenging5. This contributes to TB’s long-standing permanence as a global health issue.
Furthermore, the current TB treatments have limitations that complicate the fight against the disease. Against susceptible strains of Mtb, the standard treatment consists of a combination therapy of 4 drugs: isoniazid (INH), rifampicin (RIF), ethambutol (EMB), and pyrazinamide (PZA). These antibiotics are administered for a minimum of 6 months, requiring strict adherence throughout the treatment. This therapeutic regimen, despite being efficient for most cases and having a success rate of around 85%, still faces many challenges5,6. Among the biggest issues are the side effects and prolonged duration, which often lead to premature interruption by the patient. This discontinuation, along with incorrect administration of the antibiotics, favors the selection of resistant Mtb strains, which require more toxic, expensive and extensive therapeutic regimens7,8.
Considering this scenario, the development of new, potent anti-TB drugs is urgent. This protocol outlines the early stages of researching new drug candidates using phenotypic screening. To illustrate the application of this protocol, we selected a 4-aminoquinoline compound derived from LABIO-17 for evaluation. LABIO-17 was previously identified by our research group as an inhibitor of the enoyl-ACP-reductase (InhA) enzyme in Mtb, which is the same molecular target as isoniazid (INH)9,10. InhA is involved in mycolic acid biosynthesis in M. tuberculosis and is essential for the survival of the bacillus, highlighting its relevance as a promising molecular target11
Protocol
1. Chemical Synthesis and Characterization
NOTE: Synthesis and characterization of the chemical compound are performed as previously described10. All steps from 1.1 through 1.4 should be done in a well-ventilated fume hood using nitrile gloves.
- Preparation of reagents
- Preparation of MeOH/CH₃CN (1:1) with 0.1% formic acid
- Measure equal volumes of methanol (MeOH) and acetonitrile (CH₃CN) to prepare a 1:1 (v/v) mixture (HPLC grade).
- Combine the solvents in a clean, dry container (e.g., a volumetric flask). Add formic acid to achieve a final concentration of 0.1% (v/v) (e.g., add 1 mL of formic acid to 1 L of solvent mixture).
- Mix thoroughly by gentle swirling or stirring. Store in a tightly closed container at room temperature, protected from light.
- Preparation of 1% (v/v) Acetic Acid in Ultrapure water
- Rinse the volumetric flask with Ultrapure water, then place it on the bench. Add ~80% of the final Ultrapure water volume to the flask (i.e., 80 mL for a 100 mL flask; 800 mL for a 1 L flask).
- Using a calibrated pipette, add glacial acetic acid to achieve 1% (v/v): for 100 mL final volume → add 1.0 mL acetic acid; for 1 L final volume → add 10.0 mL acetic acid.
- Mix thoroughly by swirling or stirring. Top up the flask to the final mark with Ultrapure water and mix.
- Degas the solution by sonication using an ultrasonic cleaner (tank frequency ~40 kHz) set to degassing mode for 20 min at ambient temperature.
- Transfer to a labeled amber bottle (label: content, concentration, solvent grade, date, preparer). Store tightly closed at room temperature.
- Preparation of Acetonitrile:Methanol (1:1, v/v), HPLC Grade
- Measure equal volumes of acetonitrile and methanol: For 100 mL final volume → 50.0 mL acetonitrile + 50.0 mL methanol; for 1 L final volume → 500 mL acetonitrile + 500 mL methanol.
- Combine the solvents in a clean volumetric flask or bottle and mix by inversion or stirring. Filter the mixture through a 0.45 µm filter into a clean container to remove particulates.
- Degas the solution by sonication using an ultrasonic cleaner (tank frequency ~40 kHz) set to degassing mode for 20 min at ambient temperature.
- Transfer to a labeled amber bottle (label: composition, solvent grade, date, preparer). Store tightly closed at room temperature, away from heat and light.
- Preparation of Hexane/Ethyl Acetate 7:3 (v/v) solution for column chromatography
- Measure 70% of the final volume in hexane. Example: for 100 mL final volume → 70 mL hexane.
- Measure 30% of the final volume in ethyl acetate. Example: for 100 mL final volume → 30 mL ethyl acetate.
- Combine both solvents in a clean, dry container (e.g., volumetric flask or bottle).
- Mix thoroughly by inverting or stirring until homogeneous. Label the container with composition, date, solvent grade, and preparer.
- Preparation of Hexane/Ethyl Acetate 1:1 (v/v) solution for column chromatography
- Measure 50% of the final volume in hexane. Example: for 100 mL final volume → 50 mL hexane.
- Measure 50% of the final volume in ethyl acetate. Example: for 100 mL final volume → 50 mL ethyl acetate.
- Combine both solvents in a clean, dry container (e.g., volumetric flask or bottle). Mix thoroughly by inverting or stirring until homogeneous.
- Label the container with composition, date, solvent grade, and preparer.
- Preparation of a Saturated Sodium Bicarbonate (NaHCO₃) Solution
- Weigh an excess amount of sodium bicarbonate (NaHCO₃) (approximately 15–20 g for every 100 mL of water).
- Add the sodium bicarbonate to a clean beaker containing a known volume of distilled water (for example, 100 mL). Stir the mixture continuously at room temperature (20–25 °C) using a magnetic stirrer or glass rod.
- Continue stirring until no more solid dissolves and a small amount of undissolved sodium bicarbonate remains at the bottom — this indicates that the solution is saturated.
- Allow the suspension to rest for 10–15 min to let the undissolved solid settle. Filter the mixture through a paper filter or sintered glass funnel to remove the excess undissolved bicarbonate.
- Collect the clear filtrate, which is the saturated sodium bicarbonate solution.
- Store the solution in a tightly closed bottle, properly labeled with the compound name, concentration (saturated), date of preparation, and your initials.
- Keep the solution at room temperature and prepare fresh when needed, since CO2 can slowly escape and alter the concentration over time.
- Preparation of MeOH/CH₃CN (1:1) with 0.1% formic acid
- Synthesis of 6-bromo-2-methylquinolin-4-ol (3)
- Prepare a solution containing 4-bromoaniline (1.2 g, 7.3 mmol) and anhydrous magnesium sulfate (1.08 g, 9.0 mmol) in ethanol (15 mL).
- Add glacial acetic acid (0.33 mL) and ethyl acetoacetate (1.8 mL, 14.1 mmol) to the solution. Stir the reaction mixture at 90 °C for 16 h.
- Filter the reaction mixture through cellulose, 11 µm retention, qualitative filter paper to remove the suspended magnesium sulfate.
- Evaporate the ethanol using a rotary evaporator to obtain the acrylate intermediate.
- Heat the intermediate using an appropriate oil bath containing a high-performance synthetic heat transfer fluid (see Table of Materials) (15 mL) at 230–250 °C for 15 min to complete the reaction.
- Cool the mixture to room temperature. Filter the precipitate formed and wash it with hexane and chloroform.
- Concentrate the final product under reduced pressure using a rotary evaporator until all residual solvents are removed (see Table of Materials).
- Synthesis of 6-bromo-4-chloro-2-methylquinoline (4)
- Prepare a solution of 6-bromo-2-methylquinolin-4-ol (0.65 g, 2.8 mmol) in toluene (10 mL). Add phosphorus(V) oxychloride (0.65 mL, 6.9 mmol) to the solution.
- Stir the reaction mixture at 110 °C for 2 h. Remove the excess phosphorus(V) oxychloride using a rotary evaporator.
- Cool the residue in an ice bath. Neutralize the reaction mixture with saturated sodium bicarbonate solution.
- Extract the product with ethyl acetate (3 x 50 mL). Combine the organic phases and dry them over anhydrous sodium sulfate.
- Evaporate the solvent using a rotary evaporator to obtain a solid residue. Dry the resulting solid using a rotary evaporator to afford the crude product.
- Purify the compound by flash chromatography on silica gel (35–70 mesh) using hexane:ethyl acetate (7:3) as the eluent.
- Synthesis of 6-Bromo-2-methyl-N-(4-(piperidin-1-yl)phenyl)quinolin-4-amine (6)
- Prepare a reaction mixture containing 6-bromo-4-chloro-2-methylquinoline (0.53 g, 2 mmol), 4-(piperidin-1-yl)aniline (0.57 g, 3 mmol), pyridine (0.24 mL), and HCl 37% (0.2 mL) in isopropanol (20 mL).
- Stir the reaction mixture at 85 °C for 16 h. Remove the solvent using a rotary evaporator.
- Treat the residue with saturated sodium bicarbonate solution.
- Filter the resulting solid through a cellulose, 11 µm retention qualitative filter paper and dissolve it in chloroform (50 mL).
- Wash the chloroform solution with water (3 x 15 mL). Dry the organic phase over anhydrous sodium sulfate.
- Evaporate the solvent using a rotary evaporator to obtain a green solid. Purify the product by successive washes with hot hexane (4 x 10 mL).
- Perform final purification by flash chromatography on silica gel (35–70 mesh) using hexane:ethyl acetate (1:1) as the eluent.
- Thin-Layer Chromatography (TLC)
- Monitor the reaction progress using thin-layer chromatography (TLC) on TLC Silica gel 60 F254 plates.
- Use starting material 4 as a reference to monitor the reaction and assess its consumption.
- Melting Point (m.p.)
- Add a spatula tip of the compound to the melting point apparatus. Record the melting point range.
- Do not apply any corrections to the measured values. Perform the experiment in triplicate.
- High-Performance Liquid Chromatography (HPLC)
- Weigh 1–2 mg of compound 6. Prepare a stock solution of the compound at 1.0 mg/mL in acetonitrile/methanol (1:1, v/v).
- Dilute the stock solution to 0.5 mg/mL for analysis. Analyze the samples using an HPLC system (see Table of Materials) equipped with a dual pump, automatic injector, and UV detector.
- Acquire and process data using chromatography data acquisition software (see Table of Materials).
- Set the chromatographic conditions as follows: use a reverse-phase C18 column, 5 µm (250 x 4.6 mm) (see Table of Materials). Set the flow rate to 1.5 mL/min and monitor UV detection at 254 nm. Maintain the mobile phase at 100% water (0.1% acetic acid) from 0 to 7 min; apply a linear gradient from 100% water (0.1% acetic acid) to 90% acetonitrile/methanol (1:1, v/v) from 7 to 15 min; return to 100% water (0.1% acetic acid) over 5 min and hold for an additional 10 min.
- Nuclear Magnetic Resonance (1H, 13C)
- Weigh 15–20 mg of compound 6 into an NMR tube. Add DMSO-d6 as solvent.
- Acquire 1H and 13C NMR spectra on an NMR spectrometer (see Table of Materials) using standard pulse sequences.
- Operate the instrument at 400 MHz for 1H nuclei and 100 MHz for 13C nuclei. Use tetramethylsilane (TMS) as the internal reference.
- Express chemical shifts (δ) in parts per million (ppm). Use the FID file obtained from the experiment to visualize and process the NMR data.
- High-Resolution Mass Spectrometry (HRMS)
- Weigh 1–2 mg of compound 6. Prepare the sample in a 1:1 mixture of MeOH/CH3CN containing 0.1% formic acid.
- Perform the analysis on a high-resolution Orbitrap mass spectrometer (see Table of Materials), which combines a linear ion-trap mass spectrometer with an Orbitrap mass analyzer.
- Introduce the sample by direct infusion at a flow rate of 10 µL/min in positive-ion mode using electrospray ionization (ESI).
- Determine the elemental composition using the elemental composition tool in the mass spectrometry data analysis software (see Table of Materials).
- Column Chromatography – Compound 4
- Prepare a silica gel column using silica gel 60 Å (70–230 mesh, 0.063–0.200 mm). Pack the column appropriately with the silica gel.
- Use hexane/ethyl acetate (7:3, v/v) as the mobile phase. Load the crude compound 4 onto the column. Elute the compound and collect fractions.
- Monitor the fractions by TLC and combine those containing the pure product.
- Column Chromatography – Compound 6
- Prepare a silica gel column using silica gel 60 Å (70–230 mesh, 0.063–0.200 mm). Pack the column appropriately with the silica gel.
- Use hexane/ethyl acetate (1:1, v/v) as the mobile phase. Load the crude compound 6 onto the column. Elute the compound and collect fractions.
- Monitor the fractions by TLC and combine those containing the pure product.
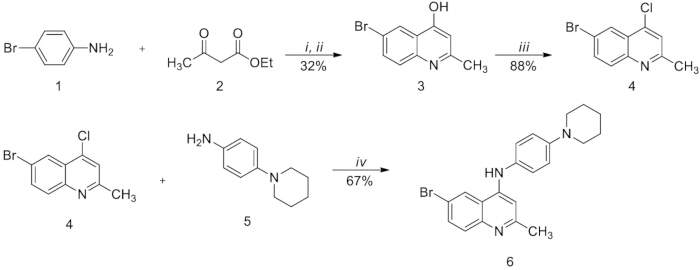
Figure 1. Reagents and conditions: i = MgSO4, AcOH, EtOH, 90 °C, 16 h; ii = C12H10, C12H10O, 230-250 °C, 15 min; iii = POCl3, Toluene, 110 °C, 2 h; iv = Pyridine, HCl, (CH3)2CHOH, 85 °C, 16 h. Please click here to view a larger version of this figure.
2. Determination of Minimum Inhibitory Concentration
- Experimental design and plate layout
- Evaluate the compounds for their ability to inhibit the growth of M. tuberculosis using the colorimetric resazurin reduction microplate assay (REMA) to determine the Minimum Inhibitory Concentration (MIC), as previously described11,12,13.
- Perform three independent experiments (three biological replicates) for each compound tested without technical replicates (one row per compound and one plate per experiment).
- Evaluate compounds acting as positive controls together with test compounds to ensure that the assay conditions allow growth inhibition.
- Assay Isoniazid (INH) and Rifampicin (RIF) as positive controls.
- Assign rows A and B for control compounds (INH and RIF, respectively).
- Assign subsequent rows for test compounds (compounds A to F in Figure 2).
- Prepare columns 1 to 10 with two-fold serial dilutions of control and test compounds, each compound occupying one row, with the higher concentration at column 10 and the lower concentration at column 1.
- Prepare column 11 as a viability control containing growth medium and bacteria at a final DMSO concentration of 2.5%, without any control or test compound added.
- Prepare column 12 as a sterility control by adding control or test compounds at the higher concentration of the serial dilution (same as column 10) to growth medium without bacterial cells.
- Refer to Figure 2 for a representative layout of a MIC plate.
- Preparation of Reagents
- Preparation of Middlebrook 7H9 Broth supplemented with Oleic Acid, Albumin, Dextrose and Catalase (OADC).
- To a 200 mL glass bottle containing 90 mL of ultrapure water, add 0.47 g of 7H9 powder, 0.24 mL of 85% glycerol, and 0.5 mL of 10% Tween-80.
- Autoclave the medium for 10 min at 121 °C and 98.07 kPa.
- Allow the medium to cool until it is warm to the touch (approx. 45–50 °C).
- Add 10 mL of OADC (we use commercially available OADC; see Table of Materials for details).
- Store at 4 °C.
NOTE: Prepare the appropriate amount for the experiment, considering the proportions of the reagents.
- Preparation of Middlebrook 7H9 Broth with ADC
- To a 200 mL glass bottle containing 90 mL of ultrapure water, add 0.47 g of 7H9 powder. Autoclave the medium for 10 min at 121 °C and 98.07 kPa.
- Allow the medium to cool until it is warm to the touch (approx. 45–50 °C). Add 10 mL of ADC. Store at 4 °C.
NOTE: Prepare the appropriate amount for the experiment, maintaining the proportions of the reagents.
- Preparation of Compound Stock Solutions
- Prepare a stock solution of each compound at 2 mg/mL dissolved in DMSO.
- Store at –20 °C.
NOTE: Prior to the experiment, the maximum test concentration is defined based on a solubility assessment. To determine the solubility limit, visually inspect the solutions for the presence of crystals. If crystals are observed, further dilute the aliquot to half of the previous concentration. Perform this assessment using 5% DMSO.
- Preparation of Compound Working Solutions
NOTE: Working solutions should be freshly prepared at the time of the experiment by diluting the stock compounds in 7H9 broth supplemented with 10% ADC. The final DMSO concentration in the working solution should be 5%, and the compound concentration should be twice the highest intended test concentration. Notably, the final DMSO concentration that bacteria are exposed to during the assay is 2.5%, as the volume is doubled after the addition of the bacterial suspension (see section 2.3, step 2.3.8).
NOTE: DMSO 2.5% is tolerated by the bacterial strains used in our laboratory (M. tuberculosis H37Ra, H37Rv and clinical isolates). If working with other strains or other bacterial species, perform a preliminary MIC experiment using DMSO as the test compound to determine the highest DMSO concentrations that can be used without promoting growth inhibition. - Preparation of Resazurin Solution
- Prepare a 0.01% resazurin solution by dissolving 1 mg of resazurin in 10 mL of ultrapure water.
- Sterilize the solution using a 0.22 µm filter.
NOTE: Filter-sterilized resazurin can be stored at 4 °C for 1 week14. However, prepare this solution immediately before use as standard practice.
- Preparation of Middlebrook 7H9 Broth supplemented with Oleic Acid, Albumin, Dextrose and Catalase (OADC).
- Preparation of Mycobacteria
- Inoculate a single colony of M. tuberculosis into a 50 mL centrifuge tube containing 10 mL of 7H9 broth supplemented with 10% OADC, 0.2% glycerol, and 0.05% Tween-80.
- Incubate with constant shaking (100 rpm) at 37 °C until the culture reaches an optical density at 600 nm (OD600) of 0.6 to 0.8 (approximately 3 to 4 weeks).
CAUTION: M. tuberculosis H37Rv is classified as a Risk Group 3 pathogen, capable of airborne transmission and causing potentially lethal disease in humans. Conduct all manipulations in a certified biosafety cabinet within a biosafety level 3 (BSL-3) laboratory, using appropriate personal protective equipment (PPE). - Homogenize the bacterial culture by vortexing with sterile glass beads (1 mm) for 3 min.
- Allow the suspension to rest for 15 min to settle clumps.
- Measure the OD600 of the supernatant and store aliquots at −80 °C.
NOTE: For experiments, dilute the bacterial suspension to a theoretical OD600 of 0.006 in fresh 7H9 broth supplemented with 10% ADC. Dispense 100 µL per well into 96-well plates during the assay.
- Preparation of 96-Well Plates
- Add 100 µL of 7H9 broth supplemented with 10% ADC to column 12.
- Add 100 µL of 7H9 broth supplemented with 10% ADC (containing 5% DMSO) to columns 11 and 9 through 1.
- Add 200 µL of the compound solution (prepared at twice the highest test concentration) to column 10 (assign one row per compound).
- Add 100 µL of the compound solution to column 12. Perform a twofold serial dilution: transfer 100 µL from column 10 to column 9 and mix well by pipetting.
- Continue the serial dilution from column 9 across to column 1. Discard the final 100 µL from column 1.
- Add 100 µL of the bacterial suspension (theoretical OD600 of 0.006) to columns 11 through 1.
- Cover the plate, seal with parafilm, and incubate at 37 °C for 7 days.
NOTE: Figure 2 is a representative layout of a MIC plate. Refer to this figure to interpret steps 2.3.1 through 2.3.9.
- Addition of Resazurin and Data Analysis
- Add 60 µL of 0.01% resazurin solution to each well of the plate. Cover the plate, seal with parafilm, and incubate at 37 °C for 48 h.
- Observe the color change from blue (growth inhibition) to pink (bacterial growth).
NOTE: In some experiments, an incomplete color change results in a purple well. Interpret this as bacterial growth.
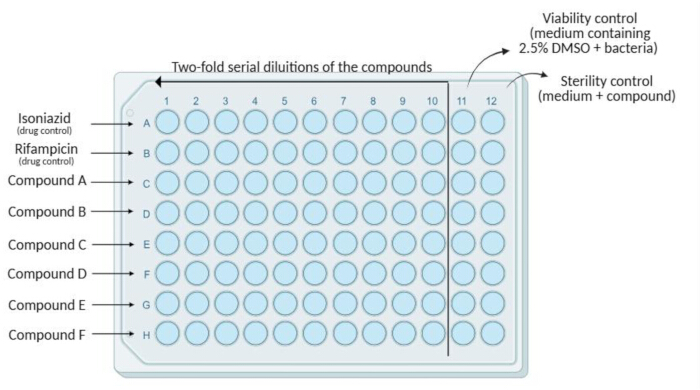
Figure 2. Schematic representation of a broth microdilution plate used for determination of the Minimum Inhibitory Concentration (MIC). Two-fold serial dilutions of the tested compounds were distributed across columns 1–10, the subsequent dilutions are performed sequentially from column 10 to column 1, with the highest compound concentration in column 10. Rows A and B correspond to positive controls containing the reference drugs isoniazid and rifampicin, respectively. Rows C–H correspond to the tested compounds. Column 11 represents viability control (medium containing 2.5% DMSO and bacterial inoculum), whereas column 12 corresponds to the sterility control (medium containing the compounds in the absence of bacterial inoculum). Please click here to view a larger version of this figure.
3. Cytotoxicity Assessment in Mammalian Cell Lines
NOTE: Perform all cell culture manipulations under sterile conditions in a certified Class II biological safety cabinet.
- Preparation of Mammalian Cell Lines
- Culture human liver carcinoma (HepG2) and African green monkey kidney (Vero) cell lines in Dulbecco's Modified Eagle Medium (DMEM).
- Supplement the medium with 1.8 g/L sodium bicarbonate, 10% Fetal Bovine Serum (FBS), 1% penicillin/streptomycin, and 0.1% amphotericin B (referred to as complete medium).
- Incubate the cell cultures at 37 °C in a humidified atmosphere containing 5% CO2.
- Harvest sub-confluent cells (70%–80%) by treating them with a 0.25% trypsin-EDTA solution for 5–10 min.
- Neutralize the trypsin by adding an equal volume of complete medium. Transfer the cell suspension to a 15 mL conical tube and centrifuge at 200 x g for 5 min.
- Discard the supernatant and resuspend the cell pellet in 10 mL of fresh complete medium.
- Determine cell concentration and viability using an automated cell counter or a hemocytometer with trypan blue exclusion.
NOTE: For trypan blue exclusion, mix 10 µL of cell suspension with 10 µL of 0.4% trypan blue solution and load onto the hemocytometer (or counting slide). Dead or membrane-compromised cells appear blue, while viable cells remain unstained. Calculate viability as % viability = (unstained cells / total cells) x 100. Proceed with seeding only if viability is ≥ 90%. - Dilute the cell suspension to the target seeding density. Seed 100 µL of cell suspension into each well of columns 2 to 12 of a 96-well flat-bottom plate.
Seeding densities: 4,000 cells/well for Vero cells; 5,000 cells/well for HepG2 cells.
NOTE: Optimize these densities to ensure cells remain in the logarithmic growth phase and do not reach 100% confluence before the 48 h assay endpoint. - Fill column 1 with 100 µL of complete medium (without cells) to serve as a blank for absorbance measurements.
- Prepare four identical plates for each cell line: two for the MTT assay and two for the NRU assay.
- Incubate the plates for 24 h at 37 °C, 5% CO2 to allow for cell attachment.
- Compound Dilution and Cell Treatment
- Prepare stock solutions for each test compound in Dulbecco's Phosphate Buffered Saline (DPBS) or an appropriate solvent (e.g., dimethyl sulfoxide; DMSO).
NOTE: Verify that the compound is soluble in the cell culture medium and that the solvent concentration is non-toxic (e.g., <0.1% v/v for DMSO) prior to the assay. - Design the plate layout to include blanks, appropriate controls, and technical replicates. A representative layout for testing up to 9 compounds across 8 concentrations is shown in Figure 3.
- Prepare serial dilutions of the test compound(s) in complete medium to cover the intended concentration range. Ensure sufficient volume is prepared for all replicate plates.
NOTE: If using a solvent (e.g., DMSO), supplement the dilution medium so that the final solvent concentration remains constant across the entire serial dilution series.
NOTE: Solvent-treated wells (vehicle control) serve as the functional negative control, defining 100% cell viability against which compound-treated wells are normalized. For assay validation, include a cytotoxic reference compound (e.g., 0.1% Triton X-100 or 1 mM sodium dodecyl sulfate) at a concentration known to produce complete cell death (0% viability). Absorbance values in these positive control wells should not significantly differ from blank wells, confirming 0% viability. - After the 24 h cell attachment period, visually inspect the plates under an inverted microscope to confirm that cells are attached, spread, and cover approximately 70%–80% of the well surface with homogeneous confluence. Discard plates showing contamination or insufficient attachment.
- Carefully aspirate the culture medium using a pipette tip, angling the tip to the side of each well to avoid disturbing the cell monolayer. Process plates in sections to prevent desiccation.
- Immediately add 100 µL of the appropriate test compound dilutions or control media to the corresponding wells.
- Incubate the treated plates for 48 h at 37 °C, 5% CO2.
- Prepare stock solutions for each test compound in Dulbecco's Phosphate Buffered Saline (DPBS) or an appropriate solvent (e.g., dimethyl sulfoxide; DMSO).
- MTT Assay Protocol
- Prepare a 0.5 mg/mL MTT solution in serum-free DMEM. Filter through a 0.22 µm syringe filter and protect from light.
- After the 48 h treatment, visually inspect the cells to confirm expected treatment effects.
- Carefully aspirate the medium from the MTT plates. Add 50 µL of the 0.5 mg/mL MTT working solution to each well.
- Incubate for 3 h at 37 °C, 5% CO2, protected from light.
NOTE: While 2–4 h is common, a 3 h incubation is typically sufficient for Vero and HepG2 cells. Optimize if necessary. - Add 100 µL of 100% DMSO to each well to dissolve the formazan crystals. Place the plates on an orbital shaker at 100 rpm for 15 min, protected from light. Inspect control wells to ensure complete crystal dissolution. Read the absorbance at 570 nm using a microplate reader. If available, set a reference wavelength of 630–690 nm.
- Neutral Red Uptake (NRU) Assay Protocol
- Prepare a 40 µg/mL Neutral Red (NR) solution in serum-free DMEM and filter. Prepare the NR Desorption Solution: 1% (v/v) glacial acetic acid, 49% (v/v) ethanol, and 50% (v/v) ultrapure water.
CAUTION: Glacial acetic acid is corrosive; handle in a fume hood. - After the 48 h treatment, visually inspect the cells. Carefully aspirate the medium from the NRU plates.
- Add 100 µL of the 40 µg/mL NR working solution to each well. Incubate for 2 h at 37 °C, 5% CO2.
NOTE: A 2 h incubation is sufficient for maximal dye uptake in these cell lines. - Aspirate the NR working solution. Gently rinse each well once with 150 µL of sterile PBS.
- Add 150 µL of the NR Desorption Solution to each well. Place on an orbital shaker at 150 rpm for 15 min to extract the dye.
- Inspect control wells to ensure complete dye extraction. Read the absorbance at 540 nm using a microplate reader.
- Prepare a 40 µg/mL Neutral Red (NR) solution in serum-free DMEM and filter. Prepare the NR Desorption Solution: 1% (v/v) glacial acetic acid, 49% (v/v) ethanol, and 50% (v/v) ultrapure water.
- Data Analysis
- Perform background subtraction by calculating the average absorbance of the blank columns and subtracting this value from all wells.
- Perform solvent toxicity check by comparing solvent control wells to untreated controls. If viability is below a defined threshold (e.g., 80%), consider solvent cytotoxicity.
- Calculate percent viability relative to solvent control wells:
% viability = (absorbance of treated well / mean absorbance of solvent control) x 100. - Plot % viability (y-axis) against log10 of compound concentration (x-axis). Use a non-linear regression model (sigmoidal dose-response, variable slope) to determine CC50.
- Calculate the Selectivity Index (SI) by dividing CC50 by MIC.
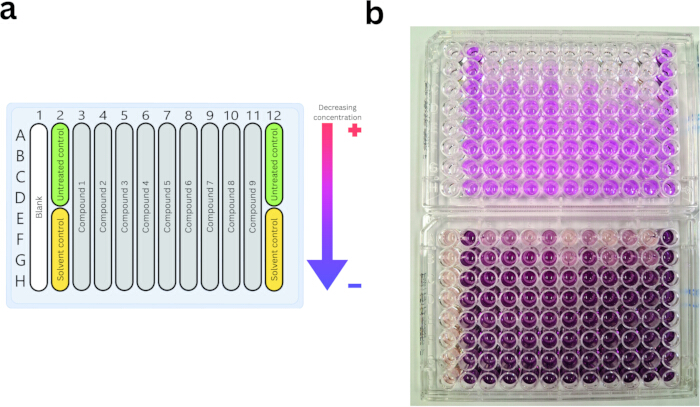
Figure 3. Plate design example for MTT/NRU cell viability assay early screening setup for testing cytotoxicity of up to 9 compounds. (A) Plate design scheme. Column 1 is assigned "blank”, without cells, and filled with DPBS or complete medium. Columns 2 and 12 are seeded with cells and treated with complete media (“untreated control”) or complete media with solvent (“solvent control”). Columns 3 through 11 are seeded with cells and treated with serial dilutions of the compounds being tested, up to 9 compounds with one replicate per concentration tested per compound. (B) Representative photographs of a Vero NRU plate (above) and a Vero MTT plate (below) after the 48 h treatment and final assay steps. Please click here to view a larger version of this figure.
Results
The synthesis yielded the target compound 6 as a light green solid (0.53 g, 67% yield). The compound exhibits a melting point of 227–229 °C and a UHPLC purity of 99% (tR = 14.11 min) (Figure 4). The chemical structure was confirmed by nuclear magnetic resonance (NMR) spectroscopy and high-resolution mass spectrometry (HRMS). The 1H NMR spectrum (Figure 5) showed signals corresponding to the piperidine moiety between 1.50 and 3.13 ppm. The methyl group at the 2-position appeared as a typical singlet at 2.38 ppm. The hydrogen at the 3-position appeared as a singlet at 6.56 ppm. The phenyl ring displayed two doublets at 6.97 and 7.17 ppm, with a coupling constant of 8.9 Hz. The hydrogens at the 7- and 8-positions generated a multiplet at 7.63–7.75 ppm, while the hydrogen at the 5-position of the quinoline core produced a doublet at 8.59 ppm (J = 2.0 Hz). The amine hydrogen was observed as a singlet at 8.66 ppm. The 13C NMR spectrum (Figure 6) exhibited a signal at 23.81 ppm attributed to the methyl group at the 2-position, while signals between 24.85 and 49.70 ppm corresponded to the piperidine moiety. The carbon at the 3-position appeared at 100.52 ppm. Remaining downfield signals were attributed to the quinoline core and phenyl ring carbons. HRMS confirmed the molecular formula of compound 6, showing an [M+H]+ ion at m/z 396.1063 (calcd for C21H23BrN3: 396.1070).
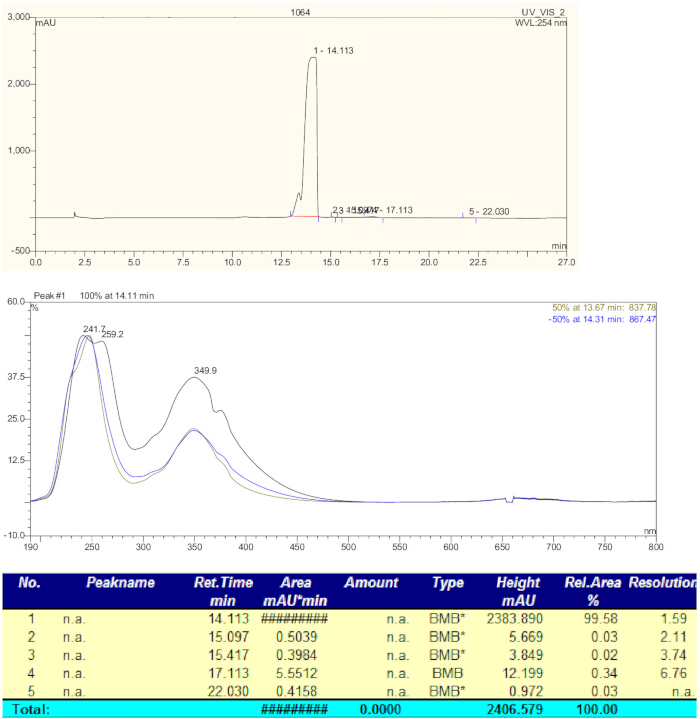
Figure 4. HPLC chromatogram and UV spectra of compound 6. Please click here to view a larger version of this figure.
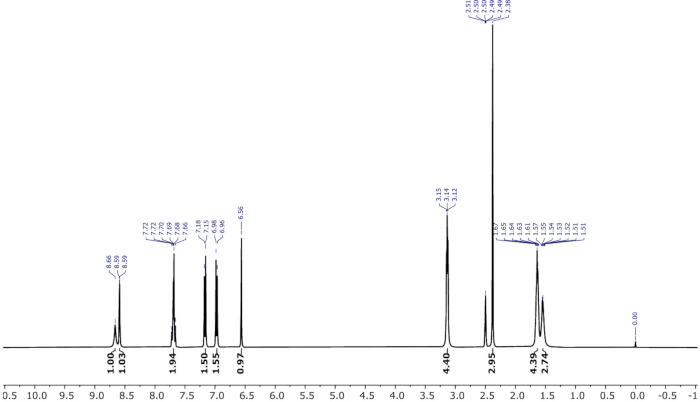
Figure 5. 1H NMR (400 MHz, DMSO-d6) spectra of compound 6. Please click here to view a larger version of this figure.
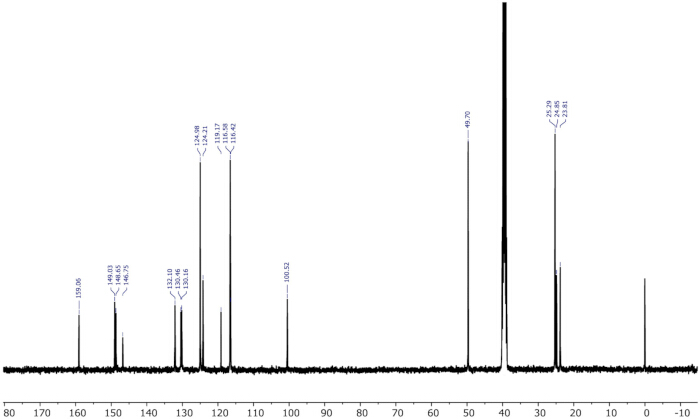
Figure 6. 13C NMR (101 MHz, DMSO-d6) spectra of compound 6. Please click here to view a larger version of this figure.
The inhibitory activity of the compound against M. tuberculosis was evaluated by determining the MIC, defined as the lowest concentration of a compound that completely prevents visible bacterial growth. In the REMA assay, a lack of color change (remaining blue) indicates growth inhibition, while a shift to pink indicates bacterial growth. Isoniazid (INH) and rifampicin (RIF) served as drug controls. The results are presented in Figure 7. Each plate included a growth control (column 11, without drugs) and a sterility control (column 12, without mycobacteria). Compounds were serially diluted from column 10 (highest concentration) to column 1 (lowest concentration). As shown in Figure 7, the MIC value for the compound in row A (isoniazid) is observed in column 4, while the MIC values for the compounds in rows B (rifampicin) and C (synthesized compound) are observed in column 5. In our hands, MIC values for INH are 0.31 µg/mL for H37Rv strain and 0.16 µg/mL for H37Ra, while for RIF we obtain 0.08 µg/mL for H37Rv and 0.01 µg/mL for H37Ra strain.
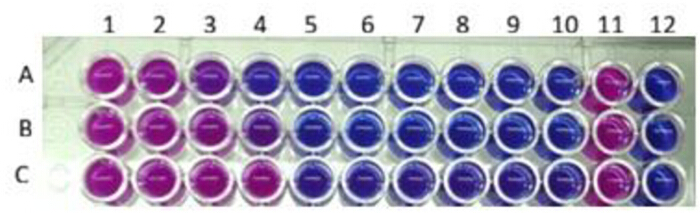
Figure 7. Determination of the minimum inhibitory concentration (MIC) in Mycobacterium tuberculosis using the resazurin microplate assay (REMA). Rows A–C, columns 1–10: Two-fold serial dilutions of isoniazid (row A), rifampicin (row B), and the synthesized compound (row C). Column 11: Viability control (medium containing 2.5% DMSO + bacteria). Column 12: Sterility control (medium + compound). A blue color indicates inhibition of bacterial growth, whereas a pink color indicates bacterial viability due to the reduction of resazurin to resorufin. Please click here to view a larger version of this figure.
A representative 96-well plate for both the NRU (Vero, top) and MTT (Vero, bottom) assays is shown in Figure 3B. In the MTT plate, a clear color gradient is visible, shifting from translucent (no viable cells) at high compound concentrations to a deep purple (high cell viability) at low concentrations. Similarly, the NRU plate shows a gradient from translucent to deep pink, indicating the uptake of the neutral red dye into the lysosomes of viable cells.
Microscopy provides a visual confirmation of the assay status after the 48 h incubation time (Figure 8). Figure 8A compares healthy, untreated control cells (Vero and HepG2) with cells treated with a cytotoxic concentration of the compound. The treated cells appear rounded, detached, and non-viable. Figure 8B provides a critical visual checkpoint prior to the final solubilization step. It shows the expected formation of dark purple formazan crystals inside viable cells (MTT assay) and the accumulation of red dye within the lysosomes (NRU assay) in both cell types.
Raw absorbance data were normalized to the vehicle control and analyzed via non-linear regression to generate dose-response curves as detailed in protocol step 3.5. For the target compound 6 (derived from LABIO-17), this analysis yielded a CC50 of 12.2 µM (Vero) and 18.3 µM (HepG2) in the NRU assay, and a CC50 >20 µM for both cell lines in the MTT assay. This resulted in a Selectivity Index (SI) ranging from 30.5 to >50, as previously reported10.
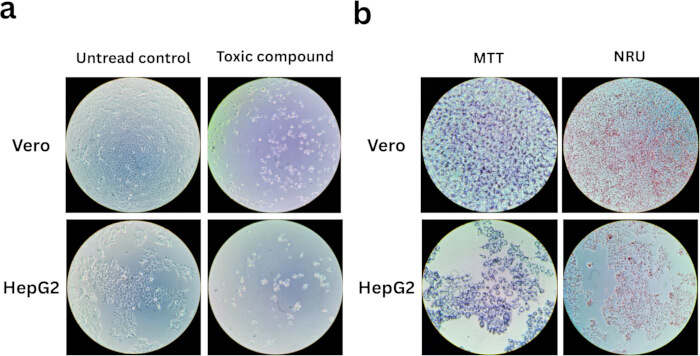
Figure 8. Representative microscopy images of cytotoxicity assays in Vero and HepG2 cells. All images were taken at 100x magnification. (A) Comparison of cell morphology after 48 h of treatment. Untreated control wells for Vero (top) and HepG2 (bottom) cells show a healthy, confluent monolayer. In contrast, cells treated with a cytotoxic concentration of a compound appear rounded, shrunken, and detached from the plate surface. (B) Critical visual checkpoints after reagent addition and prior to solubilization. In the MTT assay (left panels for each cell line), viable cells contain visible dark purple formazan crystals. In the NRU assay (right panels for each cell line), viable cells show an accumulation of red dye within intact lysosomes. Please click here to view a larger version of this figure.
Discussion
A phenotypic screening approach, which relies on whole-cell activity rather than isolated enzymes, is an effective strategy for identifying active compounds against M. tuberculosis. Here, we described the initial steps of this approach, encompassing the chemical synthesis of a candidate compound, the evaluation of its inhibitory activity via minimum inhibitory concentration (MIC) determination, and the assessment of its cytotoxicity in mammalian cells (Vero and HepG2) using MTT and NRU assays.
The synthetic route consisted of three main steps (Figure 1), that provides the target compound in high purity using operationally straightforward transformations. Several critical steps were identified as determinant for reproducibility and efficiency. The initial condensation requires precise stoichiometric control and sustained reflux to ensure complete intermediate formation. Incomplete solvent removal prior to thermal cyclization may negatively affect ring closure efficiency. The cyclization step itself demands strict temperature control, as insufficient heating results in incomplete aromatization, whereas excessive or prolonged heating may promote byproduct formation. During chlorination, careful control of reaction temperature and gradual addition of phosphoryl chloride are recommended to minimize side reactions and ensure selective activation at the 4-position. During method optimization, minor procedural adjustments improved robustness. In cases of incomplete precipitation after cyclization, gradual cooling rather than rapid quenching enhanced solid recovery. If reduced yields were observed in the nucleophilic substitution step, extending reaction time or verifying amine purity proved beneficial.
The method's main limitations are the need for high-temperature cyclization and corrosive chlorinating reagents like phosphoryl chloride, requiring specific lab infrastructure and safety. Substituent electronic effects may necessitate re-optimization for different anilines or amines, limiting broad scaffold diversification without adaptation. However, the Conrad–Limpach approach is operationally simpler than Skraup-type syntheses (harsh oxidizers) or transition-metal-catalyzed protocols (specialized catalysts/inert atmospheres). This metal-free strategy efficiently yields functionalized quinoline intermediates for medicinal chemistry.
The protocol used to determine the MIC is a colorimetric assay that relies on visual inspection. A potential challenge with this method is incomplete color change, resulting in a purple well instead of distinct blue (inhibition) or pink (growth). If this occurs, it should be interpreted as a failure to inhibit mycobacterial growth. Additionally, as the compound is assessed through serial dilution, the maximum testable concentration is dictated by the compound’s solubility. As a result, in some cases, the outcome may be inconclusive if no inhibition is observed at the maximum soluble concentration. Moreover, It is important to acknowledge that other laboratories may adapt certain steps of the protocol to their specific conditions, which may lead to variations in the results obtained. To increase throughput, this protocol can be adapted for automation. Implementing liquid handling systems for 96-well plate preparation would reduce pipetting errors, thereby improving accuracy and reproducibility.
The cytotoxicity evaluation protocol utilizes two distinct mammalian cell lines (Vero and HepG2) and two complementary viability assays (MTT and NRU). Several steps within this protocol are critical for ensuring data reproducibility and accuracy, and each laboratory should perform its own validation. For instance, the initial cell seeding density must be carefully optimized, as over-confluence can lead to contact inhibition and altered metabolic states, confounding the results, while under-seeding can make cells more susceptible to minor insults, potentially overestimating toxicity15. Furthermore, the highest tested concentration is often limited by compound solubility, and precipitation can lead to inaccurate results. Also, the suggested plate layout (Figure 3A) is designed for primary screening, maximizing the number of tested compounds by forgoing technical replicates and ignoring edge effects in favor of validation through independent biological replicates.
A key strength of this protocol is the parallel implementation of both MTT and NRU assays. While both are well-established, they measure different cellular parameters. The MTT assay quantifies the metabolic activity of mitochondrial dehydrogenases, which generally correlates with cell viability16. However, this assay is susceptible to interference from compounds with reducing or oxidizing properties or those that perturb mitochondrial respiration, leading to potential false results15. Running the NRU assay in parallel helps troubleshoot such artifacts. The NRU assay measures the ability of viable cells to maintain lysosomal integrity and pH gradients required for dye uptake17. Discrepancies between MTT and NRU results can reveal specific mechanisms of toxicity, such as mitochondrial dysfunction, warranting further investigation.
In summary, this protocol outlines the fundamental steps for identifying potential anti-tubercular drug candidates. Compounds demonstrating promising selectivity and potency can be subsequently advanced to more complex infection models, such as in vivo studies.
Disclosures
No potential conflict of interest was reported by the author(s).
Acknowledgements
This work was supported by the National Institute of Science and Technology on Tuberculosis (MCTI/CNPq/SECTICS/MS/CAPES/FAPERGS, Grant No. 404838/2024-0), CNPq/MCTI N° 44/2024 – Universal (Grant N° 420934/2025-1) and FAPERGS 06/2025 – PqG (Grant N° 25/2551-00002734-9). C.V.B (CNPq, Grant No. 311949/2019-3), L.A.B. (CNPq, Grant No. 303499/2021-4), and P.M. (CNPq, Grant No. 310888/2022-0) are Research Career Awardees of CNPq. This study was financed in part by the Coordenac̨ão de Aperfeic̨oamento de Pessoal de Nível Superior – Brasil (CAPES), Finance Code 001.
Materials
| Name | Company | Catalog Number | Comments |
|---|---|---|---|
| CELL LINES | |||
| HepG2 (human hepatocellular carcinoma) | ATCC | HB-8065 | Human liver carcinoma cell line |
| Mycobacterium tuberculosis H37Ra | ATCC | 25177 | |
| Mycobacterium tuberculosis H37Rv | ATCC | 27294 | |
| Vero (African green monkey kidney) | ATCC | CCL-81 | Primate kidney epithelial cell line |
| CHEMICALS – SYNTHESIS | |||
| 4-(Piperidin-1-yl)aniline | Sigma-Aldrich | TCI: P0887 | Amine precursor for compound 5/6 |
| 4-Bromoaniline | Sigma-Aldrich | 108-67-8 | Starting material for quinoline synthesis |
| Acetic acid (glacial) | Sigma-Aldrich | 695092 | Reagent in synthesis and mobile phase preparation |
| Acetonitrile (HPLC grade) | Sigma-Aldrich | 34967 | HPLC mobile phase component and NMR solvent |
| Chloroform | Sigma-Aldrich | C2432 | Solvent for product extraction |
| DMSO-d6 (deuterated) | Sigma-Aldrich | 175641 | NMR solvent |
| Dowtherm A (heat transfer fluid) | Sigma-Aldrich / Solutia | TBD | High-boiling solvent for thermal cyclization (230–250 °C); formerly listed as Dowtherm® A |
| Ethanol (absolute) | Sigma-Aldrich | 459836 | Reaction solvent for Conrad–Limpach step |
| Ethyl acetate (HPLC grade) | Sigma-Aldrich | 270989 | Column eluent component |
| Ethyl acetoacetate | Sigma-Aldrich | E12806 | β-ketoester reagent for quinoline ring formation |
| Formic acid (HPLC grade) | Sigma-Aldrich | F0507 | 0.1% additive in mobile phase for HPLC and HRMS |
| Glass beads (1 mm, sterile) | Sigma-Aldrich | G8772 | For homogenization of M. tuberculosis culture |
| HCl (hydrochloric acid, 37%) | Sigma-Aldrich | 320331 | Acid catalyst in nucleophilic substitution |
| Hexane (HPLC grade) | Sigma-Aldrich | 34859 | Non-polar eluent for column chromatography |
| Isopropanol | Sigma-Aldrich | 278475 | Reaction solvent for synthesis of compound 6 |
| Magnesium sulfate (MgSO4, anhydrous) | Sigma-Aldrich | M7506 | Drying agent and reaction catalyst |
| Methanol (HPLC grade) | Sigma-Aldrich | 34860 | HPLC mobile phase and NMR solvent component |
| Phosphorus(V) oxychloride (POCl3) | Sigma-Aldrich | 201170 | Chlorination reagent for intermediate 4 |
| Pyridine | Sigma-Aldrich | 270970 | Base catalyst in nucleophilic substitution |
| Silica gel (35–70 mesh) for flash chromatography | Macherey-Nagel | 815349 | Stationary phase for flash chromatography steps |
| Silica gel 60 Å (70–230 mesh) for column chromatography | Macherey-Nagel | 815381 | Stationary phase for column chromatography |
| Sodium sulfate (Na2SO4, anhydrous) | Sigma-Aldrich | 239313 | Drying agent for organic phase |
| TLC Silica gel 60 F254 plates | Merck | 1.05554 | Thin-layer chromatography monitoring |
| Toluene | Sigma-Aldrich | 244511 | Solvent for chlorination step |
| Ultrapure water | Millipore / equivalent | N/A | Used in mobile phase preparation; formerly referenced as Milli-Q water in text |
| EQUIPMENT & INSTRUMENTS | |||
| 0.22 µm syringe filter | Millipore / any | SLGP033RS | Sterilization of resazurin solution (2.1.4); filtration of MTT working solution (3.3); filtration of Neutral Red working solution (3.4) |
| 0.45 µm syringe filter | Millipore / any | SLHA033SS | Filtration of mobile phase solutions |
| 15 mL conical tube (sterile) | Falcon / any | 352097 or equivalent | Collection and centrifugation of cell suspension after trypsinization |
| 96-well plate (flat bottom, tissue culture treated) | Corning / any | 3596 | For cytotoxicity and MIC assays |
| Aluminum foil | Any | — | Light protection of plates during MTT and NRU incubation and shaking steps |
| Autoclave | Any | — | Sterilization of media (121 °C, 98.07 kPa, 10 min) |
| Biosafety cabinet (Class II, certified) | Any (BSL-3 certified) | — | Required for M. tuberculosis manipulations (BSL-3) |
| Cell counter (automated) or hemocytometer | e.g., Bio-Rad TC20 / Neubauer | TBD | For cell concentration and viability determination |
| Centrifuge (capable of 200 × g) | Any | — | Cell pelleting step |
| CO2 incubator (37 °C, 5% CO2, humidified) | Any | — | Cell culture and treatment incubation |
| Heating mantle | Fisotom | 12M | Temperature-controlled heating mantle with Dowtherm® A |
| HPLC system (Dionex UltiMate 3000) | Thermo Fisher Scientific | 5035.9200 | Dual pump, automatic injector, UV detector; for purity analysis of compound 6 |
| Inverted microscope (or equivalent) | Any | — | Visual inspection of cells at attachment (3.2), during treatment checkpoint (3.3, 3.4), and for assay status verification |
| Magnetic stirrer / hotplate | Any | — | Solution preparation and reaction mixing |
| Mass spectrometer (LTQ Orbitrap Discovery) | Thermo Fisher Scientific | — | High-resolution Orbitrap combined with LTQ XL; for HRMS of compound 6 |
| Melting point apparatus | Any (e.g., Stuart SMP10) | — | Melting point determination of compound 6 |
| Microplate reader (absorbance) | Any (e.g., BioTek Epoch) | — | Reads absorbance at 570 nm (MTT) and 540 nm (NRU) |
| NMR spectrometer (Avance III HD, 400 MHz) | Bruker Corporation | N/A | 1H and 13C NMR acquisition; located at PUCRS facility |
| Orbital shaker | Any | — | 100 rpm (MTT crystal dissolution); 150 rpm (NRU extraction) |
| Parafilm M | Bemis / Sigma-Aldrich | P7793 | Sealing of 96-well plates during incubation |
| Qualitative filter paper | UNIFIL | 50,11,250 | Whatman Grade, cellulose; 11 µm retention; ~80 g/m² |
| Reverse-phase C18 HPLC column (250 × 4.6 mm, 5 µm) | Macherey-Nagel (Nucleodur C18) | 760201.46 | Analytical column for HPLC purity analysis |
| Rotary evaporator | IKA | — | Evaporate the solvent under reduced pressure |
| Ultrasonic Cleaner | Branson | Model 2510 | Ulltrasonic tank for degassing solutions |
| Vortex mixer | Any | — | Homogenization of bacterial culture with glass beads |
| GROWTH MEDIA & SUPPLEMENTS | |||
| ADC (Albumin-Dextrose-Catalase) enrichment | BD Biosciences | 212352 | 10% supplement for 7H9 broth (assay wells) |
| Amphotericin B solution (250 µg/mL) | Gibco/Thermo Fisher | 15290026 | Antifungal supplement, 0.1% in complete medium |
| DMEM (Dulbecco's Modified Eagle Medium) low glucose | Gibco/Thermo Fisher | 31600034 | Basal medium for HepG2 and Vero cells |
| FBS (Fetal Bovine Serum) | Gibco/Thermo Fisher | 12657029 | 10% supplement in complete medium |
| Middlebrook 7H9 broth powder | BD Biosciences | 271310 | Base medium for M. tuberculosis culture |
| OADC (Oleic Acid-Albumin-Dextrose-Catalase) enrichment | BD Biosciences | 212240 | 10% supplement for 7H9 broth (culture) |
| Penicillin/streptomycin solution (10,000 U/mL) | Gibco/Thermo Fisher | 15140122 | 1% in complete medium |
| Sodium bicarbonate | Sigma-Aldrich | S5761 | 1.8 g/L supplement in DMEM; also used for NaHCO3 saturated solution |
| Trypsin-EDTA solution (0.25%) | Gibco/Thermo Fisher | 25200072 | For cell detachment from culture flasks |
| Tween-80 (Polysorbate 80), 10% solution | Sigma-Aldrich | P4780 | 0.05% supplement for 7H9-OADC broth |
| REAGENTS & ASSAY COMPONENTS | |||
| DMSO (dimethyl sulfoxide) | Sigma-Aldrich | D8418 | Solvent for compound stock solutions |
| DPBS (Dulbecco's Phosphate Buffered Saline) | Gibco/Thermo Fisher | D565210X1L | For compound dilution (3.2) and PBS wash in NRU assay (3.4) |
| MTT (3-[4,5-dimethylthiazol-2-yl]-2,5-diphenyl tetrazolium bromide) | Sigma-Aldrich | M2128 | Cell viability reagent for MTT assay |
| Neutral Red (NR) dye | Sigma-Aldrich | N2889 | Cell viability reagent for NRU assay |
| Resazurin sodium salt | Sigma-Aldrich | R7017 | Colorimetric indicator for REMA assay |
| Trypan blue solution (0.4%) | Gibco/Thermo Fisher | 15250061 | For cell viability determination by exclusion |
| SOFTWARE | |||
| Chromeleon 6.80 SR11 (chromatography data acquisition) | Thermo Fisher Scientific | Build 3160 (183147) | HPLC data acquisition and processing |
| Xcalibur 2.0.7 (mass spectrometry data analysis) | Thermo Fisher Scientific | Release 2.0.7 | Elemental composition determination (Qual Browser module) |
References
- Pai, M. Tuberculosis. Nat Rev Dis Primers. 2, 16076(2016).
- Salgame, P., Geadas, C., Collins, L., Jones-López, E., Ellner, J. J. Latent tuberculosis infection – Revisiting and revising concepts. Tuberculosis. 95 (4), 373-384 (2015).
- Lyon, S. M., Rossman, M. D. Pulmonary tuberculosis. Microbiol Spectr. 5 (1), (2017).
- Houben, R. M., Dodd, P. J. The global burden of latent tuberculosis infection: a re-estimation using mathematical modelling. PLoS Med. 13 (10), e1002152(2016).
- Global tuberculosis report 2025. , World Health Organization. (2025).
- Larkins-Ford, J., et al. Systematic measurement of combination-drug landscapes to predict in vivo treatment outcomes for tuberculosis. Cell Syst. 12 (11), 1046-1063.e7 (2021).
- Khawbung, J. L., Nath, D., Chakraborty, S. Drug resistant Tuberculosis: A review. Comp Immunol Microbiol Infect Dis. 24 (6), 101574(2021).
- Alsayed, S. S. R., Gunosewoyo, H. Tuberculosis: Pathogenesis, Current Treatment Regimens and New Drug Targets. Int J Mol Sci. 24 (6), 5202(2023).
- Pauli, I. Discovery of new inhibitors of Mycobacterium tuberculosis InhA enzyme using virtual screening and a 3D-pharmacophore-based approach. J Chem Inf Model. 53 (9), 2390-2401 (2013).
- Paz, J. D., et al. Novel 4-aminoquinolines: Synthesis, inhibition of the Mycobacterium tuberculosis enoyl-acyl carrier protein reductase, antitubercular activity, SAR, and preclinical evaluation. J Med Chem. 245 (Pt 1), 114908(2023).
- Quemard, A., et al. Enzymatic characterization of the target for isoniazid in tuberculosis. Biochemistry. 34, 8235-8241 (1995).
- Parish,, Tanya,, Roberts,, David, M. Mycobacteria Protocols. , Third edition, Humana Press. New York. (2015).
- Franzblau, S. G., DeGroote, M. A., Cho, S. H., Andries, K., Nuermberger, E., Orme, I. M., Mdluli, K., Angulo-Barturen, I., Dick, T., Dartois, V., Lenaerts, A. J. Comprehensive analysis of methods used for the evaluation of compounds against Mycobacterium tuberculosis. Tuberculosis (Edinburgh, Scotland). 92 (6), 453-488 (2012).
- Palomino, J. C., Martin, A., Camacho, M., Guerra, H., Swings, J., Portaels, F. Resazurin microtiter assay plate: simple and inexpensive method for detection of drug resistance in Mycobacterium tuberculosis. Antimicrob Agents Chemother. 46 (8), 2720-2722 (2002).
- Riss, T. L. Cell Viability Assays. Assay Guidance Manual. , Eli Lilly & Company and the National Center for Advancing Translational Sciences. (2016).
- Mosmann, T. Rapid colorimetric assay for cellular growth and survival: Application to proliferation and cytotoxicity assays. J Immunol Methods. 65 (1-2), 55-63 (1983).
- Repetto, G., del Peso, A., Zurita, J. L. Neutral red uptake assay for the estimation of cell viability/cytotoxicity. Nat Protoc. 3 (7), 1125-1131 (2008).
Reprints and Permissions
