Drosophila melanogaster serves as a powerful model organism for aging research. This protocol details the steps required to generate a reproducible, population-based measurement of both lifespan and functional healthspan.
Method Article
Semi-Automated Integration of Motor Healthspan and Lifespan Analysis Using FlyTrDT Pipeline in Drosophila melanogaster
* These authors contributed equally
In This Article
Summary
Abstract
Aging is characterized by progressive functional decline and reduced lifespan; these two parameters are often evaluated independently in experimental studies. In Drosophila melanogaster, lifespan assays and negative geotaxis–based locomotor measurements are commonly used to study aging and neurodegeneration. However, there is a lack of standardized frameworks that quantitatively integrate early motor performance with long-term survival. Here, we describe a reproducible, semi-automated workflow that combines lifespan analysis with objective quantification of motor healthspan in aging flies.
The protocol integrates controlled fly rearing conditions, mortality accounting, and video-based negative geotaxis assays using standardized MP4 recordings (minimum 1280 × 720 resolution, 30 frames/s). Locomotor performance is quantified using a custom Python-based pipeline implemented in Python 3.12.1 with OpenCV 4.9.0, NumPy 1.26.4, Pandas 2.2.0, and Matplotlib 3.5.2. The workflow performs frame-by-frame centroid detection and extracts active climbing slope (pixels/s) as a continuous metric of motor function. Survival trajectories are analyzed by calculating the survival fraction and performing trapezoidal numerical integration to obtain the survival area under the curve (AUC). Normalization of early motor performance enables direct comparison between functional decline and overall longevity.
The workflow was evaluated by comparing semi-automated climbing slope measurements with conventional manual endpoint scoring in control and amyloid-β–expressing flies, with both methods detecting age-dependent motor decline. Representative datasets demonstrated reproducible lifespan trajectories in Canton S controls and measurable early motor impairment in the neurodegenerative model. This method minimizes observer bias, enhances reproducibility, and remains compatible with low-cost video acquisition systems. The workflow can be readily adapted to genetic models, pharmacological interventions, and neurodegenerative paradigms, providing a scalable platform for integrated aging phenotyping in Drosophila.
Introduction
Aging is characterized not only by reduced lifespan but also by progressive decline in physiological and behavioral function1. In neurodegenerative conditions, early impairments in motor coordination often occur before notable mortality and reflect underlying neuronal dysfunction2,3. The fruit fly Drosophila melanogaster has emerged as a powerful model system for studying aging and neurodegeneration due to its short lifespan, genetic tractability, and well-established behavioral assays4. Lifespan analysis in Drosophila provides a robust measure of organismal survival, while negative geotaxis assays are widely used to assess locomotor function and age-dependent motor decline5,6. However, these two readouts are frequently analyzed independently, limiting the ability to quantitatively relate early functional impairment to long-term survival trajectories. Integrated analysis of motor healthspan and lifespan may provide mechanistic insight into whether interventions influence aging rate, disease progression, or specific physiological systems. This approach is particularly suitable for genetic, pharmacological, and neurodegenerative models in which early locomotor deficits precede notable mortality, enabling sensitive detection of functional decline before observable survival differences emerge.
Traditional negative geotaxis assays rely on endpoint-based scoring, such as the proportion of flies reaching a defined height within a fixed time interval. Although straightforward and inexpensive, manual scoring can introduce observer bias and may overlook subtle differences in motor kinetics. Continuous trajectory-derived measurements may improve sensitivity for detecting subtle locomotor impairments relative to conventional endpoint-based scoring approaches. Similarly, lifespan assays require rigorous mortality accounting and environmental standardization to ensure reproducibility7. There remains a need for accessible, reproducible approaches that integrate functional healthspan metrics with survival data within the same cohort.
Here, we describe a semi-automated workflow that combines standardized lifespan analysis with video-based quantification of motor performance in aging Drosophila. Using open-source computational tools, frame-by-frame centroid detection is performed to extract climbing slope (pixels/s) as a continuous metric of motor function. Survival data are processed by calculating the survival fraction and performing trapezoidal numerical integration to obtain the survival area under the curve (AUC). By normalizing early motor performance and integrating it with survival AUC, this protocol enables direct comparison between functional decline and overall longevity. This approach provides an objective, cost-effective framework for linking motor healthspan to lifespan outcomes and enables comprehensive phenotyping of aging trajectories in Drosophila (Figure 1).
Protocol
All experiments were performed using Drosophila melanogaster and conducted in accordance with institutional laboratory guidelines. Ethical approval was not required because the study involved invertebrate organisms. Maintain all procedures following institutional animal care guidelines for invertebrate research.
NOTE: Store experimental foods at 4 °C and use them within 1 week, provided they remain dry. Maintain standard environmental conditions by incubating flies at 25 °C under a 12:12 h light–dark cycle and approximately 60% relative humidity.
1. Preparation of standard fly food
- Basic food preparation
- Combine 6 g cornflour, 5 g yeast, 4 g D-glucose, 3 g sucrose, 1 g yeast extract, 1 g agar, and 0.25 g malt extract in a container containing 100 mL distilled water.
- Mix the contents thoroughly using a spatula until a uniform suspension forms.
- Heat the mixture to approximately 85–100 °C on an induction cooker for 12–15 min when preparing volumes ≥500 mL, or for 5–10 min when preparing volumes between 100–400 mL. Stir continuously during heating.
- Autoclave the heated mixture according to standard laboratory sterilization procedures.
- Allow the autoclaved medium to cool. Monitor the temperature using a thermometer until it reaches 50–55 °C.
- Add 600 µL of propionic acid and 100 mg benzoic acid in 1 mL of 100% ethanol to the cooled medium and mix thoroughly.
- CAUTION: Propionic acid and ethanol should be handled in a well-ventilated area while wearing gloves and protective eyewear because both chemicals are volatile and may cause irritation upon inhalation or skin contact.
- Dispense 5 mL of food into each sterile vial measuring 10 cm in length and 20 mm in diameter.
- Leave the vials uncovered for at least 5–6 h at room temperature. Cover them with tissue paper to keep stray flies out. Use this step to minimize variability in longevity measurements arising from differences in media preparation and storage conditions.
- Drug food preparation
- Prepare a small batch of adult food as described in Steps 1.1.1–1.1.5.
- Allow the food to cool to 50–55 °C.
- Prepare a stock solution of the test compound at the desired concentration using an appropriate vehicle, such as distilled water or dimethyl sulfoxide (DMSO). Dissolve the test compound in the selected vehicle to generate a concentrated stock solution, and add the stock to the cooled food (50–55 °C) to achieve the desired final concentration while maintaining identical vehicle concentrations across treatment and control groups.
- Mix thoroughly to ensure uniform distribution.
- Dispense 2 mL of the drug-containing food into each experimental vial by layering it onto the surface of pre-solidified base food.
- Prepare control vials by adding an equivalent volume of vehicle alone (e.g., distilled water or DMSO at the same final concentration used in treatment groups) to the food layered onto the base food.
- Allow the layered food to solidify completely at room temperature before introducing flies.
NOTE: Food handling and storage: If food is prepared in the evening, leave the vials covered with tissue paper overnight at room temperature and insert cotton plugs the following morning. Always wash, decontaminate, and autoclave vials before use. Autoclave cotton rolls separately prior to plugging. Insert cotton plugs only after the food has fully set for at least 5–6 h.
2. Generation of amyloid-β–expressing D. melanogaster
- Collection and validation of virgin driver females
- Maintain the driver fly line at 25 °C under a 12 h:12 h light–dark cycle before virgin collection.
- Collect newly eclosed female flies from the driver line twice daily, once in the morning and once in the late afternoon, using brief carbon dioxide anesthesia.
- Transfer collected females into fresh single-sex vials immediately after collection to prevent mating.
- Incubate the vials at 25 °C for an additional 48 h for virgin validation.
- Inspect vials daily for the presence of larvae.
- Confirm virgin status by verifying the absence of eggs or larval progeny.
- Retain only females that show no evidence of larval production for use in genetic crosses.
- Genetic cross setup
- Collect newly eclosed adult UAS-APPE693G males using brief carbon dioxide anesthesia on the day of cross setup.
- Set up crosses by placing 20 virgin elav-GAL4 females with 10 UAS-APPE693G males into a fresh food vial.
- Incubate the cross vials at 25 °C under controlled humidity and a 12 h:12 h light–dark cycle.
- Allow flies to mate and lay eggs for 48 h.
- Transfer the adults to fresh vials if additional progeny are required.
- Remove parental flies after egg laying to prevent overcrowding and overlapping generations.
- Allow progeny to develop to adulthood under standard conditions until eclosion.
- Use F1 adult flies expressing amyloid-β in neurons for subsequent lifespan and healthspan experiments.
NOTE: The elav-GAL4 driver enables pan-neuronal expression of the human amyloid precursor protein carrying the E693G Arctic mutation. Expression occurs throughout development and adulthood under standard rearing conditions. For aging experiments, use consistent genetic backgrounds and appropriate controls. Maintain consistent temperature conditions within each
experiment. Lower incubation temperatures, such as 18 °C, can be used during development to
delay transgene-associated pathology prior to adulthood.
3. Fly collection
- Fly collection for the negative geotaxis assay
- Maintain all fly stocks on standard fly food at 25 °C, approximately 60% relative humidity, and a 12 h:12 h light–dark cycle before experimental setup.
- Collect newly eclosed adult male flies within a 2–3 day window using brief carbon dioxide anesthesia.
- Transfer male flies into either drug-containing food vials or control food vials, depending on the experimental condition.
- Replace food every 3 days or earlier if food quality deteriorates.
- Maintain flies under these conditions until the designated ages for negative geotaxis assessment.
NOTE: Only male flies are used for the negative geotaxis assay to avoid variability arising from sex-specific differences in locomotor performance and aging.
- Fly collection for the lifespan assay
- Anesthetize small groups of flies briefly on an anesthesia pad.
- Identify male flies using a soft paintbrush.
- Minimize carbon dioxide exposure during sorting to prevent long-lasting physiological effects that may confound lifespan measurements.
- Place 10 male flies and 10 female flies, using a 1:1 sex ratio, into each fresh food vial, depending on the experimental design.
- Complete sorting and aliquoting within 3–4 min per batch.
- Ensure that total anesthesia exposure does not exceed 9–10 min.
- CAUTION: Carbon dioxide anesthesia should be applied using appropriate regulators and adequate laboratory ventilation to minimize operator exposure and prevent prolonged anesthesia-induced physiological stress in flies.
- Repeat Steps 3.2.1–3.2.6 until 4–6 replicate vials are established for each experimental condition.
4. Longevity experiment
- Fly transfer and maintenance
- Maintain flies under standard conditions.
- Transfer flies to fresh food vials at regular intervals to prevent overcrowding, larval contamination, and food degradation.
- Transfer flies to fresh food every 3 days.
- Use this transfer frequency to minimize disruption of feeding conditions by preventing larval growth in the vial.
- Perform all transfers without anesthesia.
NOTE: Avoid anesthesia during lifespan experiments because it can induce acute mortality, especially in aged flies.
- Mortality assessment during transfers
- Record the age of the cohort in days at each transfer.
- Carefully inspect the old vial.
- Count and record the number of dead flies remaining in the old vial.
- Count and record the number of dead flies carried over into the new vial.
- Record these values separately to prevent double-counting.
- Calculate the total number of deaths for each transfer using the following equation:
Total deaths = dead flies in old vial + dead flies carried to new vial. - Determine the number of new deaths since the previous transfer by subtracting the number of flies recorded as “carried” in the previous transfer from the total deaths at the current transfer.
- Use this calculation to ensure that flies carried between vials are not counted multiple times.
- Identification of living but inactive flies
- Gently tap the side of the vial before scoring a fly as dead when aged flies appear immobile or lie on their backs.
- Observe whether any movement occurs.
- Consider flies that show movement upon stimulation to be alive.
- Do not record flies showing movement upon stimulation as dead.
- Gently tap the vial to dislodge any live flies adhered to the food surface in the old vial.
- Transfer dislodged live flies to the new vial.
- Do not score dislodged live flies as dead.
NOTE: Accurate discrimination between dead and inactive flies is critical in late-life stages. Gentle mechanical stimulation should always be used before assigning death status.
- Censoring criteria
- Consider a fly right-censored if it exits the experiment before natural death because of escape from the vial, accidental injury, or handling issues.
- Record censored flies in a separate column on the day the fly exits the experiment.
- Do not record censored flies as dead.
- Exclude censored flies from mortality counts in survival analysis.
- Use censoring conservatively because excessive censoring can introduce experimental bias.
NOTE: Separating “dead” and “carried” flies during data entry prevents inflation of mortality counts and ensures correct survival curve reconstruction.
- Continuation of the assay
- Repeat Steps 4.1–4.4 throughout the experiment.
- Continue the assay until the last surviving fly dies.
5. Negative geotaxis experiment
- Preparation of flies
- Collect flies from experimental food vials without CO₂ anesthesia.
- Transfer flies gently into a clean climbing tube, or negative geotaxis tube, using a small funnel to prevent escape.
- Allow flies to acclimatize in the testing chamber for 5 min before initiating the assay.
- Perform all climbing assays at the same time of day, such as in the afternoon, to minimize circadian variability.
NOTE: Avoid direct sunlight during testing, as light intensity can alter locomotor behavior.
- Climbing tube setup
- Use a transparent cylindrical climbing tube measuring 12 cm in height and 2 cm in diameter.
- Mark a horizontal line 10 cm from the base of the tube.
- Position the tube vertically against a uniform white background to facilitate video tracking.
- Mount a smartphone or digital camera on a stable stand.
- Ensure that the entire tube is within the frame.
- Assay procedure
- Tap the tube firmly three times on a foam pad or mouse pad placed on a solid surface so that all flies fall to the bottom simultaneously.
- Immediately start recording video for 10–12 s at approximately 30 frames/s.
- Allow flies to climb freely for 10 s.
- Record at least three independent trials per vial.
- Allow a 10 min rest interval between trials.
- Perform the assay for each experimental condition, such as control, drug-treated, and solvent control groups.
- Count the number of flies reaching or crossing the 10 cm mark within 10 s.
- Record E as the number of flies reaching 10 cm.
- Record T as the total number of live flies tested.
- Calculate percent climbing activity as (E/T) × 100.
- Average the values across three trials.
- Report the values as mean ± SD.
- Semi-automated climbing analysis using a Python script
- Video acquisition
- Record negative geotaxis assays using a smartphone camera positioned perpendicular to a transparent climbing tube measuring 12 cm in height and 2 cm in diameter. Record videos using a smartphone or digital camera at approximately 30 frames/s and a minimum resolution of 1280 × 720 pixels. Position the camera at a fixed distance of approximately 15–20 cm from the climbing tube and maintain the same acquisition geometry across all recordings. Use the known tube height (12 cm) as an internal spatial calibration reference for pixel-based measurements.
- Place the tube against a uniform white background.
- Record videos for 10–12 s.
- Keep lighting conditions constant across all recordings.
- Keep camera distance constant across all recordings.
- Keep tube positioning constant across all recordings.
- Minimize variability in centroid detection.
- Save recorded videos in .mp4 format.
- Transfer recorded videos to a desktop computer for analysis.
- Python-based video processing
- Analyze videos using a custom in-house Python script provided as Supplementary File 1. Perform all analyses using Python 3.12.1 with OpenCV (cv2) version 4.9.0, NumPy version 1.26.4, Pandas version 2.2.0, Matplotlib version 3.5.2, and Scikit-learn version 1.4.2.
- Specify the input video path and output directory within Supplementary File 1 before executing the script from a Python environment or command-line interface.
- Run the script using python climbing_analysis.py after editing the VIDEO_PATH and OUTPUT_CSV variables.
- Use OpenCV, or cv2, for frame processing and object detection.
- Use NumPy for numerical computations.
- Use Pandas for data export.
- Use Matplotlib for visualization.
- Process each video frame-by-frame.
- Read the video using OpenCV’s VideoCapture function.
- Process individual frames sequentially.
- Convert frames to grayscale.
- Apply Gaussian blurring to reduce background noise.
- Apply Otsu’s thresholding in binary inverse mode to segment flies from the background.
- Perform morphological opening and closing operations to remove small artifacts and fill contour gaps.
- Identify contours exceeding a minimum contour area threshold of 60 pixels2 to exclude background artifacts and small noise particles.
- Calculate spatial moments for each valid contour.
- Determine centroid coordinates, x and y, for each valid contour.
- Average centroid coordinates when multiple flies are detected in a frame.
- Obtain a single mean cohort position per frame.
- Analyze videos using a custom in-house Python script provided as Supplementary File 1. Perform all analyses using Python 3.12.1 with OpenCV (cv2) version 4.9.0, NumPy version 1.26.4, Pandas version 2.2.0, Matplotlib version 3.5.2, and Scikit-learn version 1.4.2.
- Quality-control assessment
- Verify successful fly segmentation by confirming that detected contours correspond to visible flies throughout the recording.
- Ensure adequate contrast between flies and the background by using a uniform white background and stable illumination conditions.
- Exclude videos containing excessive glare, shadows, tube movement, severe fly overlap, or incomplete tube visibility.
- Consider videos unsuitable for analysis when centroid tracking fails for substantial portions of the recording or when thresholding produces persistent background artifacts.
- Extraction of climbing metrics
- Calculate the climbing score manually as described in Step 5.3.7.
- Calculate climbing height in pixels as the difference between the initial and final vertical centroid positions.
- Calculate mean velocity in pixels/s as the total trajectory length divided by the recording duration.
- Calculate peak velocity in pixels/s as the maximum instantaneous displacement between consecutive frames.
- Calculate trajectory length in pixels as the cumulative distance traveled across frames.
- Calculate trajectory area in pixels2 as the area of the convex hull enclosing all centroid positions.
- Calculate turn count as the number of horizontal direction changes.
- Calculate stop count as the number of frames in which centroid displacement remains below a stop-distance threshold of 3 pixels between consecutive frames.
- Plot vertical position as a function of time to obtain an objective measure of active climbing performance.
- Calculate the climbing slope in pixels per second using a rolling 1-second linear regression window during the active climbing phase of the recording.
- Use the slope value as the primary motor performance metric for integration with survival analysis.
- Export quantified locomotor metrics, including climbing height, mean velocity, peak velocity, trajectory length, trajectory area, turn count, stop count, and climbing slope, as .csv files. Save slope visualization plots as .png image files for quality verification and downstream analysis.
- Video acquisition
6. Integration of early motor health and survival analysis
- Export survival data as a .csv file containing columns for group, day, and number of alive flies.
- Calculate the survival fraction for each group at each time point by dividing the number of alive flies by the initial cohort size.
- Compute survival area under the curve, or AUC, using trapezoidal numerical integration of survival fraction versus time.
- Export motor performance data as a .csv file containing the Day 7 climbing slope for each group.
- Normalize Day 7 motor performance to the control group, Canton S, by dividing each group’s Day 7 slope value by the corresponding control slope.
- Merge the normalized Day 7 motor values with the corresponding survival AUC values for each genotype.
- Perform descriptive comparison of normalized Day 7 motor performance and survival AUC to evaluate the relationship between early motor decline and survival outcomes.
- Generate graphical visualization of normalized Day 7 motor performance and survival AUC values (Supplementary File 2).
NOTE: Perform all survival–motor integration analyses using the custom Python script provided as Supplementary File 2. Utilize Pandas for data handling and dataset merging, NumPy for trapezoidal numerical integration, and Matplotlib for graphical visualization.
7. Statistical analysis
- Present locomotor and survival measurements as representative datasets obtained from biological replicate vials.
- Report locomotor measurements as mean values averaged across independent climbing trials.
- Use graphical visualization of climbing slope (pixels/s) and survival AUC values to demonstrate representative relationships between motor performance and survival outcomes.
Results
Reproducible lifespan profiles under standardized rearing conditions
When flies were maintained under controlled environmental conditions (25 °C, 60% humidity, 12 h:12 h light–dark cycle) using freshly prepared standardized food, control cohorts exhibited consistent survival trajectories across independent experiments. Canton S control flies demonstrated a median lifespan of approximately 65–72 days, with maximum survival extending to 75 days (Figure 2). Lifespan experiments were performed with 2 biological replicates per condition, each containing 20 flies. Representative survival trajectories obtained under standardized environmental and food conditions demonstrated reproducible lifespan profiles in control cohorts.
In contrast, pan-neuronal amyloid-β–expressing flies exhibited reduced survival relative to Canton S controls, consistent with previously reported neurodegenerative phenotypes in Drosophila Alzheimer’s disease models4,5,6.
Suboptimal lifespan outcomes may occur when food quality deteriorates or when handling conditions are inconsistent. Under these conditions, early mortality spikes within the first 7–10 days and increased inter-vial variability (>25%) were detected, indicating compromised experimental reproducibility and reduced consistency across biological replicates.
Age-Dependent Motor Decline Detected by Semi-Automated Climbing Analysis
Conventional manual negative geotaxis scoring detected age-dependent locomotor decline in amyloid-β–expressing flies relative to Canton S controls (Figure 3). At Day 7, climbing performance remained broadly comparable between groups, whereas by Day 28, amyloid-β-expressing flies exhibited reduced climbing activity relative to control flies. Control cohorts maintained relatively stable climbing performance across aging time points. These manually scored behavioral trends corresponded with reductions in climbing slope values from the semi-automated FlyTrDT pipeline, showing age-dependent trends similar to those of conventional endpoint scoring and the computational tracking workflow (Figure 4). The observed locomotor decline in amyloid-β–expressing flies is consistent with established age-dependent behavioral impairment reported in Drosophila neurodegeneration models using conventional negative geotaxis assays6,7.
Semi-automated climbing analysis using FlyTrDT revealed preserved early motor function in control flies. At Day 7, control flies exhibited a mean climbing slope of 86.64 pixels/s, reflecting sustained upward displacement during the active climbing phase (Figure 4). By Day 28, the slope approached zero (−1.50 pixels/s), consistent with age-associated slowing.
In contrast, amyloid-β–expressing flies exhibited early motor impairment. At Day 7, climbing slope was reduced to 34.25 pixels/s, representing approximately 39% of control performance after normalization. By Day 28, the climbing slope declined substantially to −72.25 pixels/s, indicating impaired upward locomotor performance.
The slope-based metric captures the active climbing segment and reduces contributions from initial startle latency, plateau phases, and stochastic movement artifacts. Positive slopes indicate net upward locomotion, near-zero slopes indicate limited vertical displacement, and negative slopes indicate net downward displacement. These representative trajectories illustrate progressive motor decline in amyloid-β–expressing flies relative to age-matched controls.
Under optimal recording conditions, the FlyTrDT pipeline generated continuous centroid trajectories with stable contour segmentation and consistent vertical displacement profiles (Figure 4A). Reduced locomotor performance in amyloid-β–expressing flies was reflected by less sustained upward trajectories and lower slope values (Figure 4B–D). Videos recorded with excessive glare, unstable tube positioning, inconsistent illumination, or inadequate background contrast produced discontinuous centroid trajectories and intermittent tracking artifacts and were excluded during quality-control assessment.
Association between early motor performance and survival outcomes
To examine the associations between early motor performance and survival outcomes, normalized Day 7 climbing slope values were compared with survival AUC (area under the curve) across genotypes (Figure 5). Control flies with preserved early motor performance (normalized motor index = 1.0) exhibited higher survival AUC values (48.2), whereas amyloid-β–expressing flies with reduced early motor performance (normalized motor index = 0.395) displayed lower survival AUC values (24.65). Representative locomotor datasets were generated from 2 biological replicate vials per condition. These representative datasets suggest an association between reduced early motor performance and shortened survival in the amyloid-β disease model. Because only two representative genotypes were analyzed, these findings are presented descriptively rather than as a statistically powered predictive correlation.
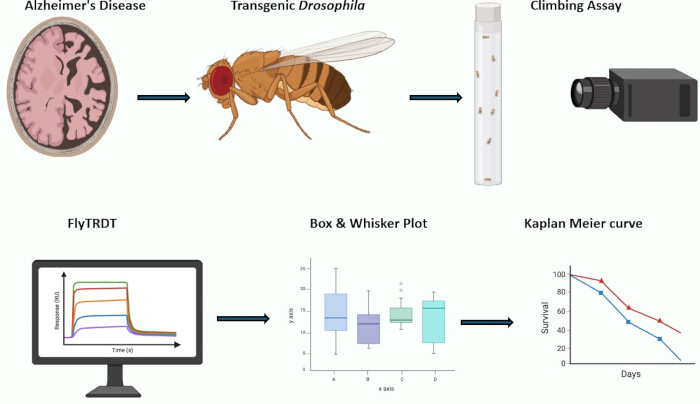
Figure 1: Workflow overview of the semi-automated FlyTrDT pipeline integrating locomotor healthspan metrics with survival analysis. The workflow includes standardized fly rearing and lifespan analysis, manual and semi-automated negative geotaxis assessment, frame-wise centroid extraction from climbing videos, calculation of climbing slope (pixels/s), survival area under the curve (AUC) analysis, and integration of motor performance with survival outcomes. Please click here to view a larger version of this figure.
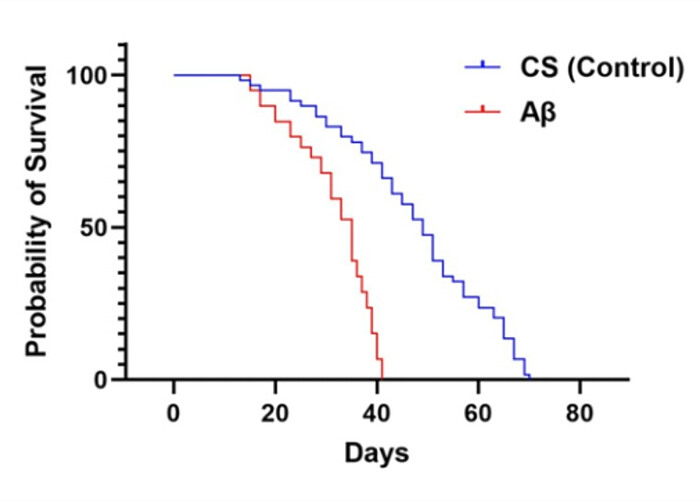
Figure 2: Kaplan–Meier survival analysis of Canton S control and amyloid-β–expressing flies. Survival curves illustrate lifespan trajectories under standardized environmental and dietary conditions. Canton S control flies exhibited prolonged survival relative to pan-neuronal amyloid-β–expressing flies, which demonstrated reduced lifespan across aging time points. Data represent representative survival trajectories obtained from 2 biological replicate vials per condition. Please click here to view a larger version of this figure.
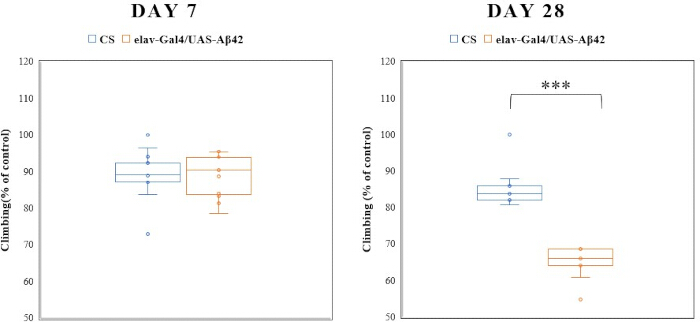
Figure 3: Manual negative geotaxis performance in control and amyloid-β–expressing flies at Day 7 and Day 28. Box plots show representative climbing activity measurements expressed as the percentage of flies crossing the 10 cm threshold within 10 s. Canton S (CS) control flies maintained relatively stable climbing activity across aging time points, whereas amyloid-β–expressing flies exhibited reduced climbing performance by Day 28. Each point represents an individual vial measurement. Representative datasets were generated from 2 biological replicate vials per condition. Please click here to view a larger version of this figure.
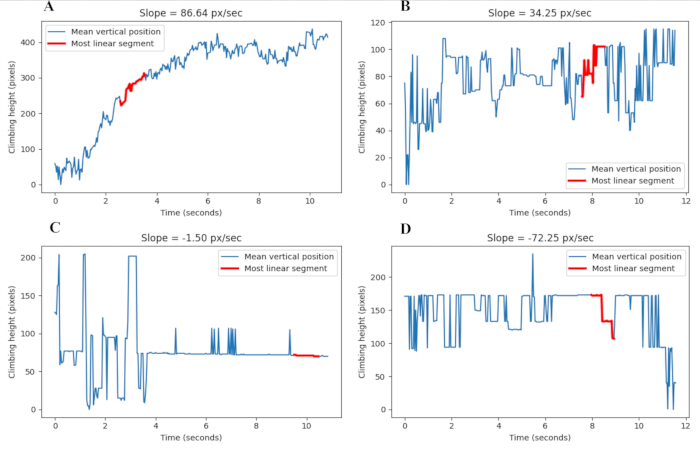
Figure 4: Semi-automated extraction of climbing trajectories and active climbing slope in control and amyloid-β–expressing flies. Representative mean vertical position trajectories were extracted from negative geotaxis videos using the FlyTrDT tracking pipeline. Blue traces represent the frame-by-frame mean vertical centroid position of detected flies over time, and red segments indicate a representative active climbing segment identified using a rolling linear regression window. Slope values are expressed in pixels/s. (A) Day 7 Canton S control flies. (B) Day 7 amyloid-β–expressing flies. (C) Day 28 Canton S control flies. (D) Day 28 amyloid-β–expressing flies. Representative trajectories were generated from 2 biological replicate vials per condition. Please click here to view a larger version of this figure.
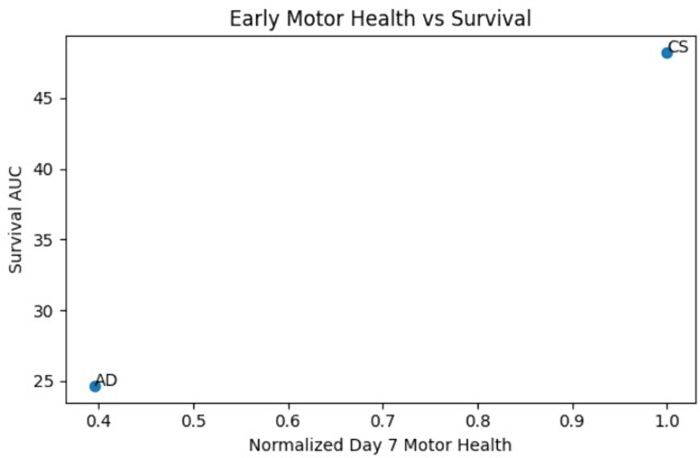
Figure 5: Association between early motor performance and survival outcomes in a Drosophila model of amyloid-β toxicity. Normalized Day 7 climbing slope values were plotted against survival area under the curve (AUC) for Canton S (CS) control flies and amyloid-β–expressing (AD) flies (n = 2). Control flies exhibited higher early motor performance and increased survival AUC values relative to amyloid-β–expressing flies. These representative datasets illustrate an association between early locomotor performance and survival outcomes. Please click here to view a larger version of this figure.
Supplementary File 1: Python-based FlyTrDT climbing-analysis script used for semi-automated locomotor quantification from negative geotaxis videos. The script performs frame-by-frame image processing, centroid detection, trajectory extraction, and calculation of climbing metrics, including climbing slope, velocity, trajectory length, trajectory area, stop count, and turn count.Please click here to download this file.
Supplementary File 2: Python script for integration of motor healthspan and lifespan data. The script performs survival fraction calculation, trapezoidal area-under-the-curve (AUC) analysis, normalization of Day 7 climbing slope values, dataset merging, and graphical visualization of motor performance and survival outcomes.Please click here to download this file.
Discussion
Here we present a protocol integrating lifespan analysis with semi-automated motor healthspan quantification in Drosophila melanogaster. Reliable integration of lifespan and locomotor measurements depends strongly on environmental consistency, food quality, and standardized handling procedures across biological replicates7. Variability in food dryness, delayed transfers, or inconsistent mortality accounting may introduce early mortality spikes and increased inter-vial variation, thereby affecting the reconstruction of survival curves and the downstream interpretation of aging phenotypes.
During the negative geotaxis assay, consistent lighting conditions, camera positioning, and tube alignment are required to ensure reliable centroid detection during video processing. Excessive CO₂ exposure during sorting should be minimized, as anesthesia can affect both lifespan and locomotor performance. When performing repeated behavioral measurements from the same cohort, assays should be conducted at the same time of day to reduce circadian variability. Inadequate background contrast or inconsistent illumination may impair thresholding and contour detection during automated analysis. If contour fragmentation or unstable centroid trajectories are observed during video processing, improve background contrast, reduce glare, stabilize camera positioning, and maintain uniform illumination across recordings. Persistent thresholding artifacts can be minimized by adjusting the recording angle, reducing shadows, or ensuring that the entire climbing tube remains continuously visible within the frame. Excessive fly clustering within the tube may impair accurate centroid estimation and should be minimized by maintaining consistent cohort sizes across experiments.
Traditional negative geotaxis assays typically quantify the proportion of flies reaching a predefined height within a fixed time interval and are widely used to assess locomotor decline during aging and neurodegeneration5,6. In contrast, the present semi-automated workflow extracts an active climbing phase of upward movement and calculates active climbing slope (pixels/s) from frame-wise centroid trajectories. Because centroid positions are averaged across all detected flies within each frame, individual locomotor trajectories and fly-to-fly behavioral heterogeneity are not resolved. This approach reduces contributions from startle latency, transient pauses, and clustering behavior that influence endpoint-based manual scoring. Unlike conventional endpoint-based scoring, the present workflow also provides continuous, rising-slope (pixels/s) measurements that enable quantitative comparison of motor decline across age and genotype. Similar computational tracking approaches have been increasingly applied to improve objectivity and consistency in Drosophila behavioral analysis using automated locomotor quantification platforms8,9,10,11,12.
Several additional limitations should be considered. Pixel-based measurements of climbing slope (pixels/s) depend on consistent camera calibration and recording geometry across experiments. Differences in camera distance or resolution may affect absolute slope values, necessitating normalization to internal controls. Moreover, while early motor decline was qualitatively associated with reduced survival in the amyloid-β model presented here, broader validation across additional genotypes, interventions, or pharmacological treatments would strengthen interpretation of the relationship between motor performance and survival outcomes. The representative datasets presented here are intended to demonstrate workflow implementation and interpretation rather than establish a generalized predictive model across disease contexts.
Despite these limitations, this protocol provides a reproducible, cost-effective framework for linking functional healthspan metrics to survival outcomes in aging studies. The method is readily adaptable to genetic manipulations, drug screening paradigms, and neurodegeneration models in which functional decline precedes mortality. By integrating objective quantification of climbing slope (pixels/s) with standardized survival analysis, this approach facilitates comprehensive phenotyping of aging trajectories in Drosophila. Future studies incorporating additional neurodegenerative genotypes, pharmacological interventions, and longitudinal behavioral datasets may further strengthen the utility of the workflow for integrated healthspan analysis13,14.
Disclosures
The authors have nothing to disclose.
Acknowledgements
This work was supported with funds from the Amrita School of Biotechnology, Amrita Vishwa Vidyapeetham, Amritapuri.
Materials
| Name | Company | Catalog Number | Comments |
|---|---|---|---|
| Agar | Himedia | GRM666 | Solidifying agent |
| Benzoic acid | Himedia | GRM488 | Antimicrobial preservative |
| Canton-S | Bloomington Drosophila Stock Center | BDSC #1 | Wild-type reference strain |
| Climbing tube | Custom-built | N/A | Transparent cylindrical tube, 12 cm height × 2 cm diameter, transparent plastic or glass |
| Corn flour | Local supplier | N/A | Fly food preparation |
| Desktop/Laptop computer | Any manufacturer | User-defined | Minimum dual-core processor, ≥8 GB RAM, Python 3.x compatible operating system |
| D-glucose | Himedia | MB037 | Fly food component |
| elav-GAL4 | Bloomington Drosophila Stock Center | BDSC #458 | Pan-neuronal GAL4 driver |
| Matplotlib | Open-source library | Version 3.5.2 | Plotting and visualization |
| NumPy | Open-source library | Version 1.26.4 | Numerical calculations |
| OpenCV | Open-source library | Version 4.9.0 | Video processing |
| Pandas | Open-source library | Version 2.2.0 | Data handling |
| Propionic acid | Himedia | GRM3658 | Antifungal preservative |
| Python | Python Software Foundation | Version 3.12.1 | Analysis environment |
| Scikit-learn | Open-source library | Version 1.4.2 | Linear regression analysis |
| Smartphone camera / Digital camera | Any manufacturer | User-defined | Minimum 30 frames/s recording, stable focus, perpendicular positioning, minimum 1280 × 720 resolution |
| Sucrose | Himedia | GRM601 | Fly food component |
| UAS-APP.Aβ.E693G | Bloomington Drosophila Stock Center | BDSC #33774 | Human APP Arctic mutation model |
| Yeast | Himedia | RM027 | Nutritional supplement |
References
- López-Otín C, et al. The hallmarks of aging. Cell. 2013;153(6):1194-217.
- Caligiore D, Giocondo F, Silvetti M. The Neurodegenerative Elderly Syndrome (NES) hypothesis: Alzheimer and Parkinson are two faces of the same disease. IBRO Neurosci Rep. 2022;13:330-43.
- Buchman AS, Bennett DA. Loss of motor function in preclinical Alzheimer’s disease. Expert Rev Neurother. 2011;11(5):665-76.
- Sivanantharajah L, Mudher A, Shepherd D. An evaluation of Drosophila as a model system for studying tauopathies such as Alzheimer’s disease. J Neurosci Methods. 2019;319:77-88.
- Jones MA, Grotewiel M. Drosophila as a model for age-related impairment in locomotor and other behaviors. Exp Gerontol. 2011;46(5):320-5.
- Gargano JW, Martin I, Bhandari P, Grotewiel MS. Rapid iterative negative geotaxis (RING): a new method for assessing age-related locomotor decline in Drosophila. Exp Gerontol. 2005;40(5):386-95.
- Linford NJ, Bilgir C, Ro J, Pletcher SD. Measurement of lifespan in Drosophila melanogaster. J Vis Exp. 2013;(71):50068.
- Spierer AN, Yoon D, Zhu CT, Rand DM. FreeClimber: automated quantification of climbing performance in Drosophila. J Exp Biol. 2021;224(2).
- Taylor MJ, Tuxworth RI. Continuous tracking of startled Drosophila as an alternative to the negative geotaxis climbing assay. J Neurogenet. 2019;33(3):190-8.
- Cao W, et al. An automated rapid iterative negative geotaxis assay for analyzing adult climbing behavior in a Drosophila model of neurodegeneration. J Vis Exp. 2017;(127):56507.
- Liu H, et al. Automated rapid iterative negative geotaxis assay and its use in a genetic screen for modifiers of Aβ42-induced locomotor decline in Drosophila. Neurosci Bull. 2015;31(5):541-9.
- Rhodenizer D, et al. Genetic and environmental factors impact age-related impairment of negative geotaxis in Drosophila by altering age-dependent climbing speed. Exp Gerontol. 2008;43(8):739-48.
- Tsintzas E, Niccoli T. Using Drosophila amyloid toxicity models to study Alzheimer’s disease. Ann Hum Genet. 2024;88(5):149-65.
- O’Keefe L, Denton D. Using Drosophila models of amyloid toxicity to study autophagy in the pathogenesis of Alzheimer’s disease. Biomed Res Int. 2018;2018:5195416.
Reprints and Permissions
This article has been published
Video Coming Soon