We present a low-cost, markerless workflow using DeepLabCut to quantify spontaneous gait and locomotion in freely moving mice. This protocol integrates single-camera video acquisition, markerless tracking of anatomical landmarks, and extraction of spatiotemporal locomotor parameters, providing a non-invasive and accessible framework for motor behavior analysis without specialized equipment.
Method Article
A Low-Cost Markerless DeepLabCut-Based Workflow for Spontaneous Gait and Locomotion Analysis in Freely Moving Mice
* These authors contributed equally
In This Article
Summary
Abstract
Gait is a widely used functional biomarker for detecting motor alterations across various diseases and conditions, as it reflects changes in coordination, strength, balance, and sensorimotor integration. However, traditional methods to analyze gait in animal models often require expensive equipment, complex setups, or invasive procedures that can alter natural behavior. Here, we present a low-cost, markerless workflow based on DeepLabCut, an open-source pose estimation software, for the quantitative analysis of gait and spontaneous locomotion in freely moving mice. The method relies on single-camera video acquisition, markerless tracking of anatomical landmarks, and extraction of spatiotemporal locomotor parameters, without the need for physical markers or specialized hardware. To demonstrate the protocol's applicability, it was implemented in the triple transgenic mouse model of Alzheimer’s disease (3xTg-AD) as a representative example of application. This approach preserves free movement and minimizes handling-related stress, enabling non-invasive assessment of motor behavior. The protocol is compatible with standard behavioral testing environments. Overall, this method provides an accessible and non-invasive framework for quantitative analysis of gait and locomotion in preclinical research.
Introduction
Gait is a complex motor process that emerges from the real-time interaction of motor, sensory, and cognitive systems, requiring coordinated processing of sensory feedback, postural control, motor planning, and muscle activation to generate stable, adaptive movement1. Because of this integrative nature, gait alterations are increasingly recognized as functional indicators of neurological dysfunction in both clinical practice and experimental research. In humans and animal models, gait analysis enables detection of changes in mobility, fall risk, frailty, and functional capacity, and has been proposed as a biomarker for disease progression and intervention efficacy across multiple conditions2,3,4.
In basic research, particularly in murine models, assessing spontaneous gait and locomotor activity represents a widely used strategy to characterize motor phenotypes and to evaluate the impact of physiological perturbations and therapeutic interventions. Objective quantification of locomotor parameters allows the detection of subtle motor alterations that are not reliably captured by visual inspection alone, a limitation that is especially relevant in preclinical studies targeting early or mild phenotypes5. In this context, gait analysis has emerged as a valuable tool for investigating alterations in motor behavior and identifying functional changes associated with different experimental conditions, such as neurological and neurodegenerative diseases6.
The analysis of motor behavior and gait in murine models has traditionally relied on specialized technological platforms designed to quantify spatial and temporal kinematic variables. Systems such as illuminated walkways, instrumented platforms, and commercial motion-tracking software are commonly used; however, their reliance on costly hardware and dedicated infrastructure significantly limits accessibility for many laboratories7,8,9,10. Beyond economic considerations, these approaches introduce additional experimental constraints. Several systems require animals to traverse narrow corridors or highly illuminated lanes, imposing forced locomotor patterns that reduce spontaneous behavior, while others depend on physical markers, paint spots, or adhesive tags attached to the limbs. Such interventions can induce stress, alter gait mechanics, and confound the physiological interpretation of motor outcomes11,12,13,14. Collectively, these limitations highlight the need for methodologies capable of capturing gait under natural, freely moving conditions without reliance on invasive procedures or expensive infrastructure.
Evaluating gait during unconstrained locomotion enables the observation of more natural motor patterns, avoiding external constraints that artificially regulate speed, trajectory, or posture. This approach facilitates the characterization of locomotor behavior under minimally constrained conditions. DeepLabCut is an open-source, deep-learning-based pose estimation framework that uses convolutional neural networks to track user-defined anatomical landmarks without the need for physical markers. By enabling anatomical point tracking from standard video recordings, DeepLabCut allows the extraction of kinematic parameters while substantially reducing cost and experimental complexity15,16,17,18. Importantly, markerless tracking minimizes experimental interference, making it suitable for studies of spontaneous behavior. This single-camera markerless approach is most suitable for studies requiring accessible, non-invasive quantification of spontaneous locomotor activity and two-dimensional gait-related features under freely moving conditions. However, instrumented gait platforms or three-dimensional motion capture systems are required when direct biomechanical variables, such as ground reaction forces, plantar pressure, joint angles, or full three-dimensional limb kinematics, are needed.
The objective of this article is to present a low-cost, markerless workflow based on DeepLabCut for the non-invasive quantification of gait and spontaneous locomotion in freely moving mice, integrating single-camera video acquisition, anatomical landmark tracking, and extraction of spatiotemporal locomotor parameters within an accessible workflow that does not require specialized hardware or invasive manipulation. This protocol focuses on the methodological implementation and representative outputs of the workflow.
Protocol
All animal procedures were conducted in accordance with the NIH Guide for the Care and Use of Laboratory Animals and were approved by the Bioethics Committee of the Institute of Neurobiology, National Autonomous University of Mexico, under protocol number 117.
1. Study context
- Use mice under the experimental conditions required for the study. In this protocol article, we use the triple transgenic mouse model of Alzheimer’s disease (3xTg-AD), harboring the APPSwe and tauP301L transgenes on a PS1M146V knock-in background, together with non-transgenic mice as controls, as a representative example of workflow implementation.
- Genotype all animals before the study begins.
- Maintain mice with food and water ad libitum under controlled conditions consisting of a 12:12 h light-dark cycle, a temperature of 22 °C ± 2 °C, and relative humidity of 60% ± 5%, under veterinary supervision.
- Perform recordings during the light phase following a 60 min habituation period, using a single open-field session per animal to preserve spontaneous exploratory behavior and avoid reduced activity associated with repeated exposure to the arena.
NOTE: In this protocol article, we present representative recordings exclusively to illustrate the workflow and the type of locomotor and gait outputs generated by the method, rather than to support biological comparisons between groups.
2. Materials
- Use the materials and equipment listed in the Table of Materials and Equipment for the recording and analysis of spontaneous locomotion and gait. See Figure 1 for the overall assembly of the experimental setup.
3. Habituation and recording of spontaneous locomotion
- Animal preparation and habituation
- Carefully transfer the mouse from its housing room to the behavioral testing room at least 60 min before the experiment to allow environmental habituation.
- Maintain the behavioral testing room under controlled environmental conditions, including a constant temperature of 20 °C–22 °C, standardized lighting intensity (120–150 lux measured at arena level), and continuous white noise to minimize external auditory stimuli.
- During the habituation period, keep the animal in its home cage without introducing additional stimuli or enrichment. Handle animals in accordance with institutional animal welfare guidelines to minimize stress-induced behavioral variability.
- Handle the animal using clean gloves and slow, deliberate movements. Gently lift the animal, supporting the body and place it into the open field arena.
Note: CRITICAL STEP: Inconsistent handling or insufficient habituation time may increase anxiety-related behaviors and introduce variability in locomotor parameters. Ensure identical habituation procedures across all animals and sessions.
- Open field arena and camera preparation
- Before each recording session, thoroughly clean the acrylic open field arena with 70% (v/v) ethanol to remove residual odors and previous scent cues. Allow the surface to dry completely before use.
- Handle 70% ethanol in a well-ventilated area, keep it away from heat or ignition sources, and allow the arena to dry completely before use.
- Place the open field arena securely on the wooden platform, ensuring that the structure is stable and free of vibrations.
- Inspect the transparent acrylic walls and matte floor surface to confirm that they are free of dust, moisture, or reflective residues that could interfere with video tracking.
- Position external lateral white light lamps on both sides of the arena at an approximate angle of 30–45° relative to the arena plane to provide uniform illumination across the recording area and minimize shadows, reflections, or excessive brightness. Adjust lamp placement before each session and verify that illumination at the arena level remains within the target range of 120-150 lux.
- Position the camera below the arena in a bottom view configuration at a fixed distance of approximately 80 cm from the arena plane, ensuring complete visibility of the recording area. Note that this optimal distance may need to be adjusted depending on the lens aperture and field of view (FOV) of the specific camera to maintain full arena coverage.
- Connect the camera to the computer system and initiate the video acquisition software before introducing the animal.
- Adjust camera focus and field of view to ensure that the entire arena surface is visible and sharply resolved.
- Acquire a reference image for spatial calibration by placing the checkerboard grid or calibration pattern with known dimensions on the arena plane.
NOTE: CRITICAL STEP: Accurate camera alignment, fixed camera distance, and consistent illumination are essential for reliable markerless pose estimation. Deviations in geometry or lighting conditions can reduce tracking accuracy and compromise data comparability across sessions.
NOTE: Alternative materials, including stainless steel, may be used for the external support structure, provided that the setup remains stable and recording alignment is preserved.
NOTE: An opaque arena or alternative wall materials may also be used, particularly when additional control of external visual input is desired, provided that the recording setup remains stable and external visual interference is minimized.
NOTE: The arena dimensions used in this protocol correspond to the configuration employed for recording freely moving mice. These dimensions may be adjusted according to the rodent used and the adopted open-field protocol, provided that complete animal visibility, spatial calibration, and consistent acquisition conditions are maintained.
- Recording of spontaneous locomotor behavior
- Before placing the mouse into the arena, briefly display the animal identifier in the video frame to ensure direct visual association between the recording and the corresponding experimental session.
- Initiate video recording before placing the mouse in the center of the open field arena to ensure capture of the initial exploratory behavior from the beginning of the session.
- Gently place the mouse in the center of the open field arena.
- Record spontaneous locomotion continuously for 3 min without introducing visual, auditory, or tactile disturbances. In the present protocol, only one recording session was performed per mouse.
- Monitor the live video feed on the computer screen to confirm uninterrupted recording and proper capture of the animal’s movements.
- Periodically verify camera alignment and illumination uniformity between sessions to ensure consistent recording conditions across animals.
- At the end of the recording period, stop video acquisition and carefully remove the animal from the arena using the same handling procedure described above.
- Return the animal to its home cage and allow it to rest before any further procedures.
NOTE: Avoid repositioning the animal during recording, as external interference may alter spontaneous gait patterns and affect downstream analysis.
- Cleaning, data storage, and session completion
- Clean the open field arena again with 70% (v/v) ethanol after each session and allow it to dry completely before introducing the next animal.
- Ensure that no residual ethanol or odor remains on the arena surface before introducing the next animal.
- Document the animal identifier, session date and time, experimental condition, and operator name immediately after each recording.
- If additional animals are tested, repeat the procedure starting from step 3.1.1 under identical environmental and experimental conditions.
- Save each video file in a dedicated folder using a standardized naming convention (e.g., AnimalID_SessionDate_Trial1.mp4).
- At the end of the experimental day, shut down the camera system and lighting equipment to prevent drift in illumination settings across sessions.
NOTE: Although 70% ethanol was used in the present protocol because it is a commonly used disinfectant in this type of procedure, acrylic-compatible disinfectants may also be used to avoid progressive surface deterioration, provided that the arena is completely dry and free of residual odor before the next recording.
NOTE: When feasible, multiple arenas may be prepared to allow immediate switching between sessions and to facilitate continuous progression of the experiment across animals.
See Figure 1 for the materials and assembly of the experimental setup, including the wooden platform (Figure 1A), the acrylic arena (Figure 1B), the lateral illumination system (Figure 1C), the bottom-view camera positioning (Figure 1D), and the complete experimental setup (Figure 1E).
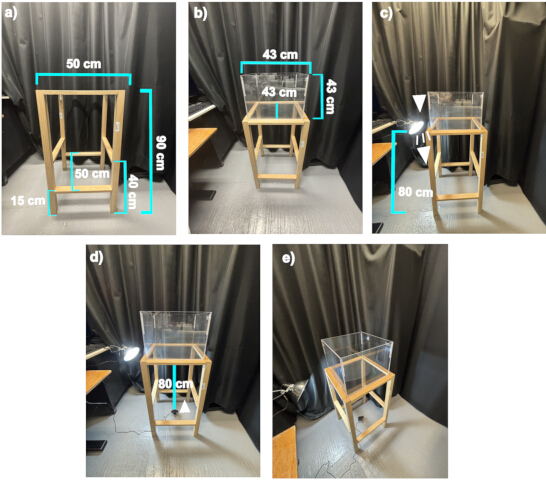
Figure 1: Experimental setup for video recording of locomotion in the open field arena. (A) support structure for the arena; (B) acrylic open field arena placed on the platform; (C) lateral illumination to ensure uniform lighting; (D) camera positioning for recording movement from below; (E) complete setup. White arrowheads indicate the orientation of the light source in Figure 1C and of the camera in Figure 1D. Please click here to view a larger version of this figure.
4. Video Processing and Kinematic Analysis
- Video preparation and quality control
- Acquire raw videos in .MOV format and convert them to .avi format for compatibility with DeepLabCut while maintaining constant frame rate and resolution parameters.
- Back up all raw video files immediately after acquisition to a dedicated folder on the analysis computer and apply a standardized naming convention (e.g., AnimalID_Session_Date).
- Review each video in its entirety to confirm that the recording is complete and free of interruptions, dropped frames, or corruption. Videos with acquisition errors should be excluded from analysis.
- Convert the videos to MP4 (H.264) or uncompressed AVI format if the original format is not compatible with DeepLabCut.
- Optionally, perform temporal trimming of the video footage to eliminate non-experimental intervals at the beginning and end of the session (e.g., during the introduction or removal of the animal from the experimental arena).
- Confirm that the resolution and frame rate match the acquisition parameters used during recording and remain consistent across all sessions.
- Verify that the entire arena surface is visible within the video frame and that no body parts are persistently occluded during locomotion.
- Place all verified and processed videos into a designated project directory for DeepLabCut analysis.
NOTE: CRITICAL STEP: Inconsistent frame rates, partial arena visibility, or motion blur will directly reduce tracking accuracy. Videos that do not meet quality criteria should not be included in model training or inference.
- Project creation and configuration
- Designate a video library for the project, using either the same videos intended for analysis or a representative subset for network training.
- Launch the Python environment and import the DeepLabCut package.
- Create a new DeepLabCut project using the command:
- deeplabcut.create_new_project('ProjectName','Author','VideoPath').
- Define the anatomical landmarks (body parts) of interest in the config.yaml file, ensuring clear and anatomically consistent definitions.
- Body part definitions should be optimized for the experimental question and remain identical across all animals and sessions.
- Frame extraction and body part labeling
- Specify start, stop, numframes2extract, and cropping_parameters in the config.yaml file according to video length and spatial layout.
- Extract representative frames using: deeplabcut.extract_frames(config_path, 'automatic', 'kmeans'/'uniform').
- Review the extracted frames to confirm inclusion of variation in body posture, orientation, limb position, and gait phase coverage across the recording. If specific postures, limb configurations, or locomotor phases are underrepresented, extract additional frames to better represent these conditions.
- When specific gait cycle phases are required, manually extract frames using: deeplabcut.extract_frames(config_path, 'manual').
- Launch the graphical labeling interface using: deeplabcut.label_frames(config_path).
- Label all predefined anatomical landmarks shown in Figure 2, including the representative video frame during acquisition (Figure 2A), the automated body point detection overlaid on the original frame (Figure 2B), and the schematic representation of the defined body landmarks and arena reference points used for analysis (Figure 2C). Follow consistent anatomical criteria (e.g., nose: anterior tip of the snout; tail base: junction between the spine and the tail)
- Label all four limbs consistently by placing each landmark at the center of the paw over the plantar pads at ground contact.
- Save and inspect the labels using: deeplabcut.check_labels(config_path), and correct inaccurate annotations if needed.
- When feasible, ask a second trained evaluator to label a subset of frames to assess inter-rater consistency.
NOTE: CRITICAL STEP: Inconsistent or anatomically imprecise labeling is a major source of downstream tracking errors. Ensure strict adherence to landmark definitions across all frames.
- Neural network training
- Train the pose estimation model for 200 epochs and obtain a final mean training error (RMSE) of 3.27 pixels and a mean test error of 3.59 pixels, corresponding to stable tracking performance under the acquisition conditions described.
- Create the training and evaluation datasets using: deeplabcut.create_training_dataset(config_path).
- Adjust the Training Fraction parameter in config.yaml to define the proportion of images used for training.
- Verify GPU availability by running: nvidia-smi.
- Start network training using: deeplabcut.train_network(config_path, save_epochs=5, epochs=200).
- Monitor training loss and stop training once loss values stabilize and no further improvement is observed.
- If training is interrupted, resume from the last saved checkpoint.
- Evaluate the trained model using: deeplabcut.evaluate_network(config_path) and record the average pixel error.
- If the error exceeds the acceptable threshold for the experimental setup, add additional labeled frames or refine annotations and repeat training.
NOTE: Acceptable pixel error thresholds may vary depending on camera resolution and arena size, but should remain consistent across experiments.
- Video analysis and gait quantification
- Consider points with a likelihood value below 0.3 as missing.
- Linearly interpolate missing points only when gaps are ≤3 consecutive frames; exclude longer gaps from analysis.
- Define locomotor bouts using a body center velocity threshold of 10 cm/s.
- Exclude movements below this threshold and transient events shorter than 3 frames.
- Run inference on experimental videos using: deeplabcut.analyze_videos(config_path, [video_path], save_as_csv=True).
- Generate labeled videos using: deeplabcut.create_labeled_video(config_path, [video_path]) to visually confirm tracking quality (Figure 2).
- Set the pcutoff parameter in config.yaml to 0.6 to apply a confidence threshold during tracking visualization and evaluation.
- Import the output CSV files into the statistical computing environment listed in the Table of Materials, together with the corresponding analysis package and the custom scripts provided in Supplementary Material 1 for behavioral quantification.
- Convert frame indices to time using the original video sampling rate.
- Calibrate spatial dimensions by transforming pixel coordinates into physical units using the known arena dimensions and the tracked arena corner landmarks.
- Perform quality control on the tracked coordinates before metric extraction.
- Consider points with a likelihood value below 0.3 as missing and replace them with linear interpolation when appropriate.
- Identify outlier trajectories during visual inspection and correct or exclude them when necessary.
- Define gait segments using synchronized kinematic criteria based on body center displacement and hind limb motion.
- Exclude non-locomotor behaviors such as rearing, turning, and grooming.
- Manually calibrate and refine the definition thresholds according to the experimental conditions and animal model to retain only robust, continuous locomotor bouts for analysis.
- Compute gait metrics derived from geometric and temporal relationships among tracked landmarks using the filtered continuous locomotor segments (Table 1). These included stride length, step length, step width, cadence, stride duration, step duration, stance time, swing time, ipsilateral amplitude, and limb-specific displacement measures.
- Extract open field metrics from the full recording using the same tracking data (Table 1). These included total distance traveled, average speed, time spent moving, percentage of time spent moving, number and duration of walking bouts, and cumulative distance covered in the center, periphery, and corner zones.
- Compile all outputs into a structured master file for downstream statistical analysis.
- Generate visual representations (e.g., trajectories, heatmaps, time-based displacement, gait patterns, and inter-limb coordination plots) using the computational environments listed in the Table of Materials and the plotting scripts described above.
- Representative synchronized visualizations of point confidence, gait bout detection, exploratory zone classification, and inter-limb coordination are provided in the Supplementary Video 1 and Supplementary Video 2 to facilitate interpretation of the analytical workflow.
- Quality control and data backup
- Visually inspect a random subset of labeled videos to confirm anatomical consistency across frames and sessions.
- Compare predicted landmark positions with annotated labels to verify model stability and generalization.
- Save a complete copy of the project, including config.yaml, original labels, trained network weights, and output files.
- Document the software versions used in the workflow, including DeepLabCut, Python, PyTorch, CUDA, and the statistical computing environment, together with GPU specifications and the analysis date.
- Generate a summary report of average errors and processing times from evaluation-results.csv.
- Back up the entire project to a local archive and to an institutional server or secure cloud storage.
- Computational environment and reproducibility resources
- Capture original video recordings in .MOV format at a resolution of 1080 × 1920 pixels and approximately 60 FPS.
- Preprocess and transcode the videos to .avi format.
- During this conversion step, crop the region of interest, resize it to a square resolution of 720 × 720 pixels, and standardize the frame rate to a constant 60 FPS to ensure accurate temporal quantification during subsequent kinematic analysis.
- Implement the markerless tracking workflow using DeepLabCut version 3.0.0rc13 in a Python environment configured with Python 3.12.12, PyTorch 2.5.1, and CUDA 11.8.
- Train the pose estimation model for 200 epochs and obtain a final mean training error (RMSE) of 3.27 pixels and a mean test error of 3.59 pixels.
- Perform post-tracking analysis using the statistical computing environment and the custom scripts provided in Supplementary Material 1 for gait and open-field quantification.
- Use a body center velocity threshold of 10 cm/s to identify walking bouts. Fill gaps of up to 3 frames between locomotor epochs and exclude transient movements shorter than 3 frames to retain continuous gait segments for analysis.
- Provide the relevant config.yaml settings, representative analysis scripts, example video and tracking files, and model weights in Supplementary Material 1.
- Provide additional implementation details, model evaluation metrics, hardware specifications, and case-specific analysis parameters in Supplementary Material 1, where applicable.
NOTE: Adjust these parameters according to the acquisition conditions used in each experiment.
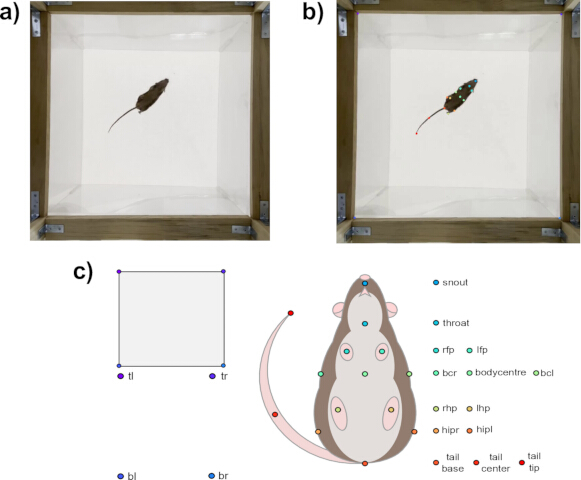
Figure 2: Representative workflow for markerless body point tracking and gait analysis from video recordings. (A) Representative video frame of a mouse freely moving within the open field arena during acquisition. (B) Example of automated body-point detection overlaid on the original video frame after pose estimation, illustrating the anatomical landmarks used for analysis. (C) Schematic representation of the defined body landmarks and arena reference points used for gait reconstruction, spatial calibration, and quantitative locomotor analysis. Landmarks and arena reference points: snout, throat, body center, body center left (bcl), body center right (bcr), left hip (hipl), right hip (hipr), tail base, tail center, tail tip, left forepaw (lfp), left hindpaw (lhp), right forepaw (rfp), right hindpaw (rhp), top left (tl), top right (tr), bottom left (bl), and bottom right (br). Please click here to view a larger version of this figure.
Results
Following application of the tracking and analysis workflow, automated processing reconstructed spontaneous open field locomotion using the defined body center landmark and generated quantitative outputs suitable for downstream analysis. Representative trajectory plots illustrate how the protocol captures spatial displacement across the arena, temporal occupancy, and speed dynamics during free exploration. The open field variables shown in this section were calculated from the full recording, and representative recordings are included to illustrate the workflow and the types of locomotor and gait outputs generated by the protocol.
In a representative Non-Tg recording, the reconstructed body center trajectory shows continuous displacement across the arena (Figure 3A), while time-density and speed-coded visualizations highlight regions of prolonged occupancy and fluctuations in movement velocity during exploration (Figure 3B). A representative 3xTg-AD recording shows a different output pattern, with more spatially constrained trajectories and reduced arena coverage (Figure 3C), accompanied by a more localized occupancy distribution and extended periods of lower movement speed (Figure 3D).
These visual outputs are presented as representative examples of the workflow's analytical outputs and are not intended to support biological or between-group comparisons, but rather to illustrate the protocol’s capacity to extract locomotor information directly from raw video data. Recordings with sustained locomotion typically yield extended and continuous trajectories, broader arena coverage, and dynamic speed modulation along the path. In contrast, recordings with lower locomotor activity tend to show shorter or less continuous trajectories, occupancy concentrated in restricted regions of the arena, and prolonged periods with near-zero speed values consistent with pauses or immobility.
A synchronized visualization of point confidence, gait bout detection, and exploratory zone classification during open field locomotion is provided in Supplementary Video 1. This visualization explicitly illustrates that tracking performance for representative anatomical landmarks remains stable under the acquisition conditions described. Additional landmark-specific tracking accuracy data are provided in Supplementary Material 2. While spontaneous, transient reductions in precision may occur, typically associated with specific non-locomotor behaviors such as snout occlusions during rearing events, these fluctuations do not compromise the integrity of the gait bout identification process. For instance, two localized drops in snout likelihood are observed strictly outside the segments classified as walking, thereby preserving the robustness of the locomotor metrics.
These visualizations also provide a practical reference for selecting appropriate p-cutoff thresholds during data processing.
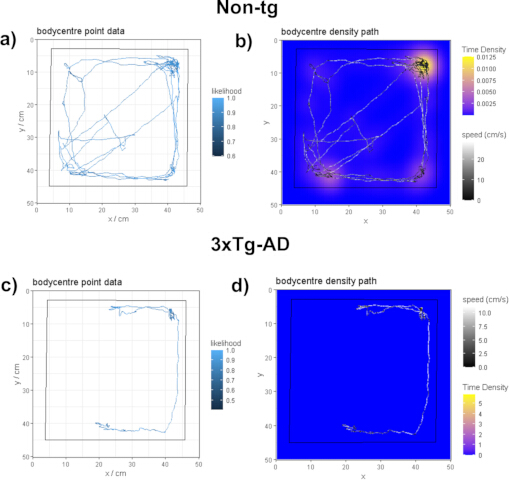
Figure 3: Representative open field locomotor outputs derived from body center tracking. (A–B) Representative Non-Tg recording: (A) reconstructed body center trajectory across the open field arena during the recording session; (B) trajectory visualized using time density and speed coding (cm/s) to illustrate spatial occupancy and movement dynamics. (C–D) Representative 3xTg-AD recording: (C) reconstructed body center trajectory; (D) corresponding trajectory coded by time density and speed (cm/s). All panels show representative analytical outputs generated by the automated workflow and illustrate the types of spatial and kinematic visualizations produced by the protocol. See Supplementary Video 1 for a synchronized visualization of point confidence, gait bout detection, and exploratory zone classification during open field locomotion. Please click here to view a larger version of this figure.
Following application of the pose estimation protocol, the analysis enabled the extraction of representative gait pattern features by tracking all four limbs during spontaneous locomotion (Figure 4). Limb trajectories and stance-swing dynamics were reconstructed from raw video data, generating visual outputs that summarize the temporal coordination and spatial organization of stepping behavior. In the gait pattern plots, each colored bar represents a stance event for an individual limb, whereas the intervals between bars correspond to swing phases.
In a representative Non-Tg recording, the reconstructed limb pattern shows a regular alternation between forelimbs and hindlimbs, with a consistent temporal sequence of stance and swing phases across the recording period (Figure 4A). Correspondingly, the gait map shows aligned and parallel limb trajectories, reflecting stable displacement patterns and a relatively homogeneous spatial organization of limb movement (Figure 4B).
A representative 3xTg-AD recording shows a different output pattern, with greater temporal variability in stance phase duration and limb engagement (Figure 4C). These features are also reflected in the gait maps, where limb trajectories appear more dispersed and less parallel, indicating greater spatial variability during stepping (Figure 4D).
These examples are presented as representative outputs of the workflow and are not intended to support biological interpretation or formal comparison between conditions, but rather to illustrate the protocol’s ability to reconstruct limb-specific gait features and visualize interlimb coordination from markerless tracking data. Recordings with stable locomotion typically yield regular stance swing patterns and coherent gait maps, whereas recordings with more variable locomotor organization tend to show greater temporal and spatial variability in limb trajectories. A synchronized visualization of the gait pattern and interlimb coordination output is provided in Supplementary Video 2. The implementation of low-motion playback (0.25×) in this visualization facilitates a detailed frame-by-frame inspection of limb dynamics, revealing tight concordance between the physical paw lift-off and strike observed in the labeled video feed and the corresponding swing and stance blocks in the analytical gait pattern.
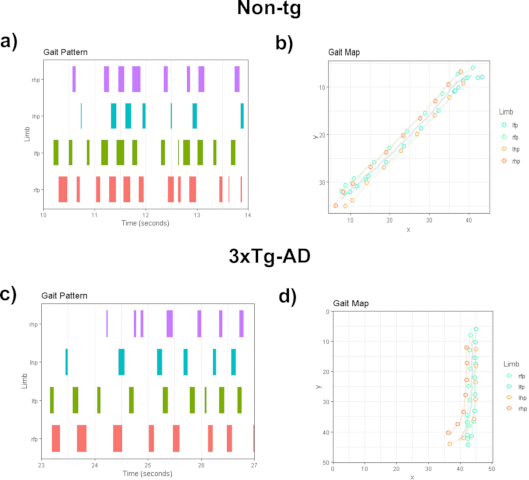
Figure 4: Representative gait pattern reconstruction and limb trajectory outputs derived from markerless tracking. (A–B) Representative Non-Tg recording: (A) reconstructed four limb gait patterns over time, where each colored bar represents a stance event for an individual limb, and the intervals between bars correspond to swing phases; (B) corresponding gait map showing the spatial trajectories of each limb during locomotion. (C–D) Representative 3xTg-AD recording: (C) reconstructed four limb gait patterns over time; (D) corresponding gait map showing the spatial trajectories of the limbs during locomotion. In the gait maps, more aligned and parallel trajectories reflect a more consistent spatial organization of limb displacement, whereas more dispersed trajectories indicate greater spatial variability during stepping. Abbreviations: lfp, left forepaw; lhp, left hindpaw; rfp, right forepaw; rhp, right hindpaw. All panels show representative analytical outputs generated by the automated workflow and illustrate the types of temporal and spatial gait visualizations produced by the protocol. See Supplementary Video 2 for a synchronized visualization of the gait pattern and inter-limb coordination output. Please click here to view a larger version of this figure.
After application of the tracking workflow and automated analysis pipeline, the protocol enabled the extraction of quantitative parameters describing spontaneous locomotor activity in the open field and, complementarily, gait-related variables derived from markerless pose estimation. All parameters were obtained directly from the coordinates of the tracked body points, enabling downstream quantitative analysis. Open field variables were calculated from the full recording, whereas gait-related measures were extracted from previously filtered continuous locomotor segments.
In the open-field locomotor analysis, movement tracking enabled quantification of spatial and temporal variables of exploratory behavior, including total distance traveled, average speed, time spent moving, the number and duration of walking bouts, and the distance covered in specific arena zones, such as the center, periphery, and corners. Together, these parameters provide a standardized description of overall locomotor activity and spatial exploration patterns.
For gait analysis, limb trajectories and the geometric relationships among tracked body points enabled the extraction of spatiotemporal and kinematic variables. These included parameters related to gait organization, as well as complementary measures derived from body displacement, including lateral displacement of the snout and tail, and dynamic variables such as angular velocity, acceleration, and jerk.
Table 1 summarizes representative quantitative outputs obtained from individual recordings processed using this workflow. These values are presented solely to illustrate the structure and type of metrics generated by the analysis pipeline and do not represent statistical comparisons between groups.
Together, these outputs indicate that the analysis pipeline enables quantification of multiple dimensions of spontaneous locomotion and gait organization in freely moving mice under standardized conditions.
| Gait | |||
| Parameter | Parameter Definitions | Non-Tg | 3xTg-AD |
| Gait speed (cm/s) | Speed calculated from limb displacement over time during continuous locomotor segments. | 14.1 | 10.4 |
| Cadence (Hz) | Number of steps per second. | 4.82 | 4.09 |
| Stride length (cm) | Distance between two successive contacts of the same limb. | 2.03 | 1.54 |
| Step length (cm) | Distance between consecutive contacts of contralateral limbs. | 1.99 | 1.7 |
| Step width (cm) | Lateral distance between left and right limb placement. | 1.96 | 2.33 |
| Ipsilateral amplitude (cm) | Spatial displacement between ipsilateral limb trajectories. | 5.42 | 7.55 |
| Stride duration (s) | Time interval between consecutive stride events. | 0.21 | 0.24 |
| Step duration (s) | Time interval between consecutive step events. | 0.18 | 0.17 |
| Stance time (s) | Duration of paw contact with the surface. | 0.18 | 0.4 |
| Swing time (s) | Interval during which the paw is off the surface between stance events. | 0.17 | 0.11 |
| Snout lateral displacement (cm) | Side-to-side deviation of the snout during locomotion. | 1.11 | 1.3 |
| Tail lateral displacement (cm) | Side-to-side deviation of the tail during locomotion. | 1.34 | 1.47 |
| Body angular velocity (deg/s) | Rate of change in body center orientation over time. | 65.3 | 30.58 |
| Body acceleration (cm/s²) | Rate of change in body displacement velocity over time. | 3.88 | 4.33 |
| Body jerk (cm/s³) | Rate of change in body acceleration over time. | 385.09 | 439.76 |
| Open Field | |||
| Parameter | Parameter Definitions | Non-Tg | 3xTg-AD |
| Total distance (cm) | Cumulative distance traveled during the full recording session. | 614.43 | 99.22 |
| Average speed (cm/s) | Mean locomotor speed across the full recording session. | 12.94 | 8.64 |
| Time moving (s) | Total time spent moving during the full recording session. | 47.47 | 11.48 |
| % time moving | Percentage of the full recording session spent moving. | 24.15% | 5.99% |
| Number of walking bouts (n) | Number of locomotor bouts that met the predefined movement criteria. | 74 | 19 |
| Time in walking bouts (s) | Total time accumulated within locomotor bouts that met the predefined movement criteria. | 36.55 | 5.42 |
| Distance in center (cm) | Cumulative distance traveled within the center zone. | 93.18 | 0 |
| Distance in periphery (cm) | Cumulative distance traveled within the periphery zone. | 248.41 | 90.23 |
| Distance in corners (cm) | Cumulative distance traveled within the corner zones. | 148.51 | 30.44 |
Table 1: Summary of Gait and Spontaneous Locomotion Metrics Extracted from Video Analysis. Representative values obtained from single-subject recordings processed using the described workflow. Open field variables were calculated from the full recording, whereas gait-related measures were extracted from filtered continuous locomotor segments. Parameter definitions are included to facilitate interpretation of each quantitative output and to clarify the biological or behavioral dimension captured by the analysis. The table is presented exclusively to illustrate representative example values and the structure of the metrics generated by the workflow and does not imply formal biological comparison between conditions.
Supplementary Video 1: Representative synchronized visualization of point confidence, gait-bout detection, and exploratory zone classification during open-field locomotion. The video illustrates the correspondence between the labeled video frames and the analytical outputs generated by the workflow during spontaneous locomotor activity.Please click here to download this file.
Supplementary Video 2: Representative synchronized visualization of gait pattern reconstruction and interlimb coordination during spontaneous locomotion. The video illustrates the correspondence between the labeled video frames and the analytical gait outputs, including stance-swing organization and limb coordination patterns.Please click here to download this file.
Supplementary Material 1: Video acquisition and preprocessing, Markerless Pose Estimation, Network Architecture and Computational Benchmark, Data analysis and behavioral. Custom scripts, config, model weights, and representative outputs.Please click here to download this file.
Supplementary Material 2: Spatial Precision (RMSE) per Anatomical Landmark (Epoch 200)Please click here to download this file.
Discussion
This study presents a low-cost, markerless approach for analyzing spontaneous locomotion and gait in freely moving mice using standard video acquisition and DeepLabCut-based pose estimation within an accessible workflow. The workflow allows the extraction of locomotor and gait-related variables from video recordings while preserving natural locomotor behavior and reducing experimental interference. In this sense, the protocol offers a practical and accessible alternative for preclinical studies of motor behavior.
The protocol was demonstrated in a transgenic mouse model of Alzheimer’s disease, as a representative application of the workflow. The outputs generated illustrate the type of locomotor and gait variables that can be obtained using this approach19,20,21,22. Importantly, the methodology described here emphasizes recording under unconstrained conditions, which facilitates the characterization of locomotor behavior under minimal constraints. In this sense, the method may be useful as a complementary approach in studies where excessive handling, invasive procedures, or specialized infrastructure are not desirable.
The incorporation of deep learning-based pose estimation has expanded the possibilities for behavioral analysis in preclinical research. In particular, DeepLabCut enables markerless tracking from conventional video recordings using open-source tools. Because the present protocol relies on readily available video acquisition and open-source software, it reduces economic and logistical barriers to quantitative gait analysis and may facilitate its implementation in laboratories with limited resources.
Several methodological limitations should be considered when applying this protocol. Tracking quality depends on careful network training, representative frame selection, and data curation, so an initial optimization stage is still required. Critical factors for successful implementation of the protocol include consistent illumination, stable camera alignment, appropriate frame selection for network training, and careful quality control of the tracked coordinates before metric extraction. When tracking performance declines, practical modifications may include refining landmark definitions, increasing the diversity of labeled frames, adjusting acquisition conditions, and recalibrating analysis thresholds to the experimental context. In addition, because the analysis is based on video-derived kinematics, this protocol does not provide direct biomechanical measurements such as ground reaction forces, torque, or plantar pressure.
Therefore, it should not be considered a replacement for instrumented gait analysis systems when those parameters are required. Likewise, using a single camera limits three-dimensional reconstruction and restricts detailed analysis of joint angles and other complex movement dynamics. In addition, while the present work focuses on methodological implementation and representative outputs, evaluation of biological differences between groups requires appropriately powered experimental designs and larger cohorts. Comparison with alternative gait analysis approaches may also help further define the methodological scope of the workflow. Future adaptations may incorporate multiple camera views to expand the method's analytical scope.
In conclusion, this work presents an accessible and non-invasive protocol for the quantitative assessment of spontaneous locomotion and gait in freely moving mice. By combining standard video acquisition with markerless tracking using DeepLabCut, the method offers a practical alternative for motor assessment in preclinical research and supports the broader adoption of low-cost gait analysis approaches.
Disclosures
The authors declare that the research was conducted in the absence of any commercial or financial relationships that could be construed as a potential conflict of interest.
Acknowledgements
J.J.A.-G is a doctoral student from the Programa de Doctorado en Ciencias Biomédicas, Universidad Nacional Autónoma de México (UNAM), and has received SECIHTI fellowship (No. 1145816). Additionally, the authors wish to thank A. R. Aguilar Vázquez, E.A. De los Ríos Arellano, and D. Gasca Martínez for their technical support.
FUNDING: This research was funded by UNAM-PAPIIT (209325, IN227026) and Ciencia básica y de Frontera grant number CBF-2025-G-35.
Materials
| Name | Company | Catalog Number | Comments |
|---|---|---|---|
| 70% ethanol | Generic | N/A | Arena cleaning between sessions |
| Adjustable white-light lamps | Generic | N/A | Maintain constant illumination (100–150 lx) |
| Black curtains/glare control | Generic | N/A | Reduce external light/reflections |
| Checkerboard grid template | Generic | N/A | Spatial calibration reference image |
| DeepLabCut (v3.0.0rc13) | Open-source | N/A | Pose estimation software |
| Digital video camera (HD, 16:9; ≥60 fps) | Generic | N/A | Fixed settings across sessions |
| Nvidia GPU workstation | Custom build | N/A | Hardware for model training/inference |
| Lux meter | Generic | N/A | Verify illumination at the arena level |
| PyTorch | Pytorch Foundation | N/A | Framework required by DeepLabCut |
| Transparent acrylic open-field arena (42 × 42 × 42 cm) | Custom-made / In-house | N/A | Open-field arena |
| Under-arena camera mount (90° view) | Custom-made / In-house | N/A | Stable mount for bottom recording |
| CUDA | Nvidia corporation | N/A | GPU-accelerated parrellel proccesing |
| R programming language | R Foundation | N/A | Programming language for data analysis |
References
- Takakusaki, K. Functional neuroanatomy for posture and gait control. J Mov Disord. 10 (1), 1-17 (2017).
- Pamoukdjian, F., et al. Measurement of gait speed in older adults to identify complications associated with frailty: a systematic review. J Geriatr Oncol. 6 (6), 484-496 (2015).
- Mukli, P., et al. Gait variability predicts cognitive impairment in older adults with subclinical cerebral small vessel disease. Front Aging Neurosci. 14, 1052451 (2022).
- Mancini, M., et al. Digital gait biomarkers in Parkinson’s disease: susceptibility/risk, progression, response to exercise, and prognosis. NPJ Parkinsons Dis. 11 (1), 51 (2025).
- Lakes, E. H., Allen, K. D. Gait analysis methods for rodent models of arthritic disorders: reviews and recommendations. Osteoarthritis Cartilage. 24 (11), 1837-1849 (2016).
- Wisniewski, T., Masurkar, A. V. Gait dysfunction in Alzheimer disease. Handb Clin Neurol. 196, 267-274 (2023).
- Walter, J., et al. The CatWalk XT is a valid tool for objective assessment of motor function in the acute phase after controlled cortical impact in mice. Behav Brain Res. 392, 112680 (2020).
- Connell, J. W., Allison, R., Reid, E. Quantitative gait analysis using a motorized treadmill system sensitively detects motor abnormalities in mice expressing ATPase defective spastin. PLoS One. 11 (3), e0152413 (2016).
- Rostosky, C. M., Milosevic, I. Gait analysis of age-dependent motor impairments in mice with neurodegeneration. J Vis Exp. (136), e57752 (2018).
- Rastoldo, G., et al. Quantitative evaluation of a new posturo-locomotor phenotype in a rodent model of acute unilateral vestibulopathy. Front Neurol. 11, 505 (2020).
- Carregosa, D., et al. Locomotor and gait changes in the LPS model of neuroinflammation are correlated with inflammatory cytokines in blood and brain. J Inflamm. 21 (1), 39 (2024).
- Sugimoto, H., Kawakami, K. Low-cost protocol of footprint analysis and hanging box test for mice applied to chronic restraint stress. J Vis Exp. (143), e59027 (2019).
- Wong, J., Shah, P. K. 3D kinematic gait analysis for preclinical studies in rodents. J Vis Exp. (150), e59612 (2019).
- Stauch, K. L., et al. Applying the RatWalker system for gait analysis in a genetic rat model of Parkinson’s disease. J Vis Exp. (167), e62002 (2021).
- Mathis, A., et al. DeepLabCut: markerless pose estimation of user-defined body parts with deep learning. Nat Neurosci. 21 (9), 1281-1289 (2018).
- Nath, T., et al. Using DeepLabCut for 3D markerless pose estimation across species and behaviors. Nat Protoc. 14 (7), 2152-2176 (2019).
- Lauer, J., et al. Multi-animal pose estimation, identification and tracking with DeepLabCut. Nat Methods. 19 (4), 496-504 (2022).
- Sturman, O., et al. Deep learning-based behavioral analysis reaches human accuracy and is capable of outperforming commercial solutions. Neuropsychopharmacology. 45 (11), 1942-1952 (2020).
- Castillo-Mariqueo, L., Pérez-García, M. J., Giménez-Llort, L. Modeling functional limitations, gait impairments, and muscle pathology in Alzheimer’s disease: studies in the 3xTg-AD mice. Biomedicines. 9 (10), 1365 (2021).
- Nyul-Toth, A., et al. Early manifestation of gait alterations in the Tg2576 mouse model of Alzheimer’s disease. Geroscience. 43 (4), 1947-1957 (2021).
- Ni, H., et al. Impairment of theta oscillations in the hippocampal CA1 region may mediate age-dependent movement alterations in the 5xFAD mouse model of Alzheimer’s disease. Sci Rep. 15 (1), 10975 (2025).
- Broberg, D. N., et al. Effects of memantine and high dose vitamin D on gait in male APP/PS1 Alzheimer’s disease mice following vitamin D deprivation. J Alzheimers Dis. 85 (4), 1755-1766 (2022).
Reprints and Permissions
