This protocol describes a standardized, portable ultrasound-based method for quantifying the functional stiffness spectrum of the Achilles tendon across multiple ankle joint angles in elite athletes, enabling reliable and reproducible assessment of tendon mechanical behavior under different loading conditions.
A subscription to JoVE is required to view this content. Sign in or start your free trial.
Research Article
Reliability of A Vibration-Based Elastography Protocol For Assessing Achilles Tendon Stiffness Across Multiple Joint Angles In Elite Athletes
* These authors contributed equally
In This Article
Summary
Abstract
The mechanical behavior of the Achilles tendon plays a critical role in athletic performance and injury risk; however, in vivo assessment of tendon stiffness remains challenging. Conventional approaches combining ultrasonography with dynamometry are expensive, laboratory-bound, and typically limited to single joint positions, while existing elastography-based techniques are often constrained by methodological assumptions or limited functional relevance.
The purpose of this study was to present and validate a standardized, portable protocol for quantifying the functional stiffness spectrum of the Achilles tendon across multiple fixed ankle joint angles. This paradigm shifts the assessment from a single static stiffness value to a continuous mechanical profile, capturing the tendon’s nonlinear response to loading. Using a force–ultrasound fusion system, mechanically induced low-frequency vibrations were applied to the tendon while ultrasound-based motion tracking was used to estimate the shear elastic modulus of superficial tendon tissue. Measurements were performed bilaterally in elite male athletes at predefined ankle joint positions ranging from relaxed and plantarflexed states to neutral and dorsiflexed positions.
The protocol demonstrated good intra-trial repeatability and excellent intra-session reproducibility across all joint angles, with coefficients of variation remaining within acceptable limits for soft-tissue elastography and intraclass correlation coefficients indicating high reliability. Achilles tendon stiffness increased non-linearly with progressive dorsiflexion, indicating angle-dependent mechanical behavior. No significant main effect of side dominance was observed across the full functional range, while sport-specific differences emerged at selected joint angles.
This protocol provides a practical and repeatable approach for characterizing Achilles tendon mechanical behavior under functionally relevant loading conditions. Its portability and standardized workflow make it suitable for laboratory, clinical, and field-based applications, offering a valuable tool for athlete monitoring, injury risk assessment, and longitudinal evaluation of tendon adaptation.
Introduction
The Achilles tendon plays a critical role in high-performance human movement by transmitting muscular forces and storing and releasing elastic energy during the stretch–shortening cycle (SSC) actions1. Its mechanical stiffness is a key determinant of movement efficiency, influencing force transmission, elastic energy reutilization, and overall mechanical output during locomotor and explosive tasks2. In elite athletes—particularly those involved in sprinting, jumping, and other SSC-dominant sports—greater Achilles tendon stiffness has been consistently associated with superior sprint speed, acceleration, running economy, jump performance, and rate of force development3. Both long-term training exposure and short-term mechanical loading have been shown to induce measurable alterations in tendon stiffness, reflecting the adaptive capacity of tendon tissue4,5. Conversely, pathological conditions such as Achilles tendinopathy are often characterized by altered stiffness, which may impair force transmission despite preserved muscle strength6. The impact of tendinopathy is substantial; in elite sports, it leads to significant time loss, impaired performance, and potentially shortened careers, while in recreationally active populations, it represents a highly prevalent, recalcitrant issue that diminishes quality of life and incurs considerable healthcare costs. Accurate and reliable assessment of Achilles tendon stiffness is therefore essential for performance monitoring, load management, and injury-related evaluation in athletic populations.
Currently, the combination of ultrasonography and dynamometry is widely regarded as a reference approach for the in vivo assessment of tendon stiffness7,8,9. While this method provides valuable insight into tendon mechanical properties under highly controlled conditions, several practical limitations restrict its broader application10. The setup is time-consuming, strongly dependent on operator expertise, and typically confined to laboratory environments. Furthermore, it represents a substantial financial barrier, often requiring significant capital investment for both the isokinetic dynamometer and premium ultrasound machinery. In addition, stiffness estimates are commonly derived under isolated or quasi-static loading conditions at a single joint configuration, which limits their applicability for routine athlete monitoring, field-based assessment, and longitudinal evaluation across training cycles. These constraints highlight the need for alternative measurement approaches that are both methodologically robust and feasible in applied sport settings.
Ultrasound-based elastography techniques have emerged as valuable tools for the in vivo assessment of tendon mechanical properties. Among these, shear wave elastography (SWE) has been widely applied to musculoskeletal tissues; however, its use has highlighted important methodological challenges11. Previous studies have demonstrated that elastography-derived stiffness measurements are highly sensitive to joint angle, probe orientation, tissue pre-compression, region-of-interest (ROI) selection, and data processing strategies, particularly in highly anisotropic structures such as tendons. To mitigate operator-induced variability, some authors have advocated for the use of custom external harnesses to secure the ultrasound probe, although this often comes at the expense of testing efficiency and rapid data acquisition. As a result, methodological standards and rigorous measurement protocols—whether utilizing freehand techniques or external stabilization—have been strongly advocated to ensure valid and reproducible stiffness assessment. These methodological considerations are not limited to SWE but are broadly relevant to elastography-based techniques that infer tissue stiffness from mechanically induced wave propagation.
In recent years, vibration-based ultrasound elastography has gained attention as a practical and field-adaptable alternative for assessing the mechanical properties of superficial musculoskeletal tissues12. In this approach, mechanical vibrations—with frequency and amplitude parameters specifically optimized for the acoustic and structural properties of the target tissue—are externally applied to the tissue, and the resulting wave propagation is tracked using ultrasound imaging to derive stiffness-related parameters. While previous pioneering studies have successfully utilized ultrasonography coupled with an external actuator to evaluate tendon mechanics—employing a bulky mechanical shaker strapped to the limb to generate continuous sinusoidal waves13,14—the present protocol utilizes a transient vibration approach. By employing a flexible, hand-held configuration where the mechanical excitation tip is manually co-positioned immediately adjacent to the ultrasound transducer to deliver extremely brief (300 ms) transient impulses, this system eliminates the need for complex and time-consuming external strapping setups. This advancement significantly reduces subject burden and, compared with traditional laboratory-based dynamometry–ultrasound combinations, makes vibration-based elastography systems more portable, non-invasive, and feasible for repeated measurements in applied sport settings. However, despite these advantages, existing studies have typically assessed Achilles tendon stiffness at a single joint configuration, providing only a limited snapshot of tendon mechanical behavior.
Tendon stiffness is inherently dependent on the configuration of the muscle–tendon unit, varying as a function of joint angle and muscle length. A single-angle measurement therefore fails to capture the functional variability in tendon stiffness that occurs across the ankle range of motion and during sport-specific postures. This limitation reduces the practical relevance of stiffness measurements for athletes exposed to multi-angle loading and rapid force transitions. To date, few studies have systematically quantified Achilles tendon stiffness across multiple, standardized joint angles using a reproducible elastography-based protocol15.
To address this methodological gap, we propose a Functional Stiffness Spectrum Paradigm. This approach reconceptualizes tendon stiffness not as a scalar property but as a continuous function of joint position, quantifying the tendon’s mechanical output across a physiological range of loading states. By isolating the shear elastic modulus of the free tendon across multiple angles, this method provides a tissue-specific assessment that complements traditional dynamometry of the muscle-tendon unit. The purpose of this manuscript is to present a detailed, step-by-step protocol for implementing this method, including subject positioning, joint angle standardization, probe handling, ROI selection, and data acquisition procedures. This protocol is designed to facilitate reproducible assessment of the Achilles tendon’s functional stiffness spectrum and to provide researchers and practitioners with a practical tool for investigating sport-specific tendon adaptations and functional biomechanics in elite athletes. Importantly, to provide practical guidance on the utility of this method, its applicability boundaries must be clearly defined. This approach is highly appropriate for the non-invasive, static or quasi-static profiling of local tendon mechanics—such as monitoring longitudinal adaptations, screening for side-to-side asymmetries, or tracking tendinopathy rehabilitation. However, it is not suitable for highly dynamic, continuous movement tasks where maintaining consistent acoustic coupling is unfeasible, nor is it applicable during the acute phase of full tendon ruptures where baseline tension is absent. Furthermore, practitioners should note that due to the saturation effect of shear wave propagation under extreme tissue tension, absolute measurement precision may be reduced at extreme ranges of motion (e.g., maximal dorsiflexion).
Access restricted. Please log in or start a trial to view this content.
Protocol
This study was approved by the Research Ethics Committee of Beijing Sport University (Approval number: 2025608H), and all procedures were conducted in accordance with the Declaration of Helsinki. All participants provided written informed consent for study participation and publication of anonymized images.
Participant preparation
Recruitment and eligibility
Participants were recruited from national-level sports teams and included professional male athletes aged 18–26 years across multiple sport disciplines (e.g., sprinting, tennis, basketball). Participants were screened to ensure a normal body mass index (BMI)16. The dominant leg was determined by asking participants to kick a ball.
Inclusion and exclusion criteria
Participants met the following inclusion criteria: male sex, normal BMI, and national-level sporting qualification. Exclusion criteria included a history of ankle injury or surgery, neurological or systemic disease, acute musculoskeletal pain or inflammation involving the Achilles tendon or surrounding structures, and self-reported anabolic drug use.
Testing environment and pretest instructions
All measurements were conducted under standardized laboratory conditions using the same testing room and examiners for all participants. Participants were instructed to avoid high-intensity exercise for 48 h prior to testing17.
Equipment components and connections
A portable vibration-based ultrasound elastography system was used in this study. The specific commercial products and software used are detailed in the Table of Materials. The system consisted of four main components: (1) a main unit with integrated system software (version 1.0), (2) a linear-array ultrasound transducer, (3) an external excitation module, and (4) an L15 vibration head.
The linear-array transducer was a 128-element probe with a nominal central frequency of 8.5 MHz and an effective imaging width of 4 cm, designed for high-resolution imaging of superficial musculoskeletal tissues. The excitation module, together with the L15 vibration head, generated low-frequency mechanical vibrations (15 ± 2 mm), which were transmitted to the tissue to induce mechanically propagating waves. Tissue motion resulting from wave propagation was tracked by the ultrasound system, and stiffness-related parameters were derived using the system’s built-in analysis software.
The transducer was connected to the main unit by aligning the connector with the corresponding interface on the rear panel of the main unit, inserting it firmly until it locked into place with the connector buttons fully engaged and flush with the probe housing, and gently pulling on the transducer cable to confirm a secure connection. The excitation module was connected to the designated socket located on the lower left side of the main unit by aligning the locking connector, inserting it fully, and manually tightening the locking mechanism to ensure a stable mechanical and electrical connection. The system was powered on by switching on the main power supply and confirming that the system status indicator illuminated, followed by powering on the tablet interface, launching the ultrasound system software by selecting the designated application icon, and verifying that the system entered the main ultrasound operating interface with real-time B-mode imaging displayed.
Shear elastic modulus (G) acquisition
Transducer preparation and placement
A uniform layer of prewarmed coupling gel was applied to the transducer surface, and the probe was lightly placed against the measurement site with the target point aligned under the anterior side of the probe. Imaging quality was confirmed prior to acquisition, ensuring that the transducer plane was nearly perpendicular to the skin surface (>75°), the transducer-to-skin distance was approximately 5 mm, no visible air bubbles were present, and that the fascia and tendon fibers were clearly visualized.
Excitation module configuration
By default, the elastography mode (E-mode) parameters were set to a 6 MHz frequency, 4 acquisition lines, a 5 mm depth range, and a 300 ms acquisition time. The excitation module was activated, and the excitation tip was positioned 3–6 mm in front of the probe’s protrusion side, perpendicular to the probe imaging plane.
E-mode imaging and depth adjustment
The ultrasound system was switched to E-mode, and the reference line was positioned such that the acquisition depth range began just below the superficial tendon fascia. The region of interest (ROI) was adjusted to cover the tendon thickness while strictly avoiding the skin, subcutaneous tissue, and Kager’s fat pad.
Data acquisition and quality control
Continuous measurement was initiated by clicking the On button, and the system automatically calculated the shear modulus (G), providing mean ± SD values of valid data. Participant and operator posture were maintained constant during acquisition to obtain at least 10 valid continuous data points. Data acquisition was stopped by pressing the Freeze function once sufficient data points were collected. The dataset was reviewed for outliers, and abnormal data points were removed using the system’s editing function.
Measurements were repeated at least three times at each ankle angle. A measurement was considered valid only if the standard deviation (SD) of the continuous data points was less than 10% of the mean, in accordance with the device’s internal validity requirements; otherwise, the measurement was discarded and repeated. B-mode images and mechanical imaging maps were saved for documentation (Figure 1).
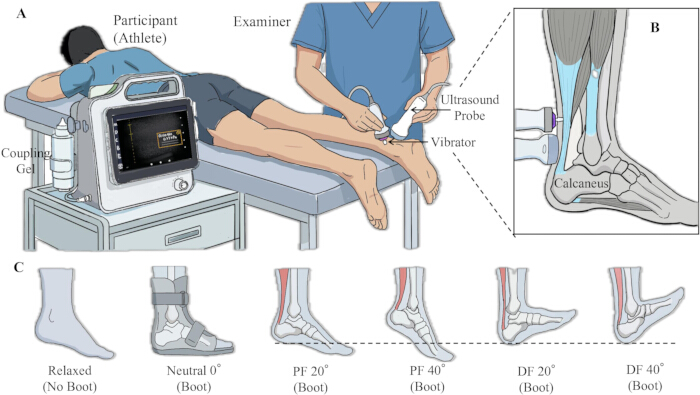
Figure 1. Schematic representation of the experimental setup and functional stiffness spectrum acquisition protocol. (A) Experimental setup. (B) Specific measurement zones on the Achilles tendon. (C) Ankle joint angles in the experimental sequence. Abbreviations: PF = plantarflexion, DF = dorsiflexion. Please click here to view a larger version of this figure.
Data acquisition procedure
Subject registration and anatomical localization
Participant demographic and athletic information were recorded upon arrival. Participants were instructed to remove their shoes and socks and lie prone on the examination couch with their ankles fully extended over the edge by approximately 5 cm. The superior apex of the calcaneal tuberosity was located via palpation, and a point 5 cm proximal to this landmark was marked using a skin marker to define the initial measurement site. The marked site was verified using ultrasound imaging in the longitudinal view.
Baseline measurement
The initial stiffness acquisition was performed at the baseline state (no-boot relaxed state) following the procedures described above.
Multi-angle measurement (functional stiffness spectrum)
Measurements were conducted sequentially on both Achilles tendons under the following conditions: relaxed, 0° (neutral), 20° plantarflexion (PF), 40° PF, 20° dorsiflexion (DF), and 40° DF. A randomized testing order was intentionally avoided, as testing an extreme dorsiflexion position prior to plantarflexion positions would induce tissue hysteresis and pre-conditioning, artificially altering baseline mechanics and affecting subsequent measurements.
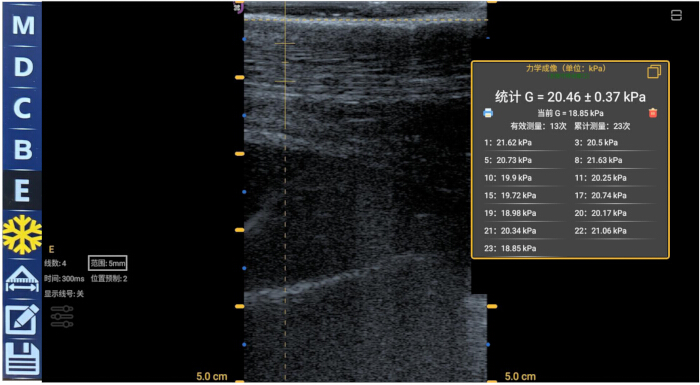
Figure 2. Representative interface of the system during data acquisition. The central panel displays a longitudinal B-mode ultrasound image of the Achilles tendon, showing clear, parallel fiber alignment. The yellow panel on the right displays real-time quantification of the shear elastic modulus (G). The system automatically calculates the mean value (20.46 kPa in this example) and standard deviation (0.37 kPa) from the list of valid measurements shown below. This readout demonstrates high measurement stability with a low standard deviation (SD < 10% of the mean), satisfying the protocol's quality control criteria. Please click here to view a larger version of this figure.
Boot installation and angle setting
The participant's foot was placed into the adjustable ankle testing boot, ensuring the heel rested completely flush against the posterior heel cup of the boot base. The forefoot, midfoot, and lower leg were secured using the attached hook-and-loop straps to prevent heel lift or lateral shifting during testing. The bilateral locking knobs on the boot’s hinge mechanism were loosened, and the ankle was manually guided to the target angle by aligning structural markers with the goniometric scale. The locking knobs were then firmly tightened to secure the ankle joint at the target angle. Ultrasound measurement was performed immediately after locking the angle to prevent viscoelastic tendon relaxation.
Post-procedure
Participants were instructed to remove the ankle boot, and all instruments and ultrasound probes were cleaned and sanitized.
Data processing and statistical analysis
Data aggregation
For each measurement trial, the internal SD of the data points was verified to be <10% of the mean. The inter-trial coefficient of variation (CV) across the three valid trials was calculated for each measurement angle and was required to be <30%; otherwise, the dataset was discarded and re-measured. The overall mean of the three successful trials was calculated and used for subsequent analyses.
Statistical modeling
The intraclass correlation coefficient (ICC) was calculated to evaluate measurement reproducibility. The effects of variables on Achilles tendon stiffness were analyzed using a Generalized Mixed Models (GLMM). Achilles tendon stiffness (G) was specified as the dependent variable, with ankle joint angle, sport type, and dominant leg as fixed factors. Subject ID was included as a random effect to account for repeated measures. Post-hoc analyses with Bonferroni correction were conducted.
Data visualization
Processed data were exported and visualized using line graphs for stiffness spectrum analysis and bar charts for group comparisons.
Access restricted. Please log in or start a trial to view this content.
Results
Before interpreting the statistical outcomes, it was critical to define the criteria for a successful versus failed implementation of this protocol. Participant demographic characteristics are presented in Table 1. A successful measurement was visually characterized by a high-quality B-mode image displaying a clear, continuous tendon fibrillar structure parallel to the skin surface, coupled with a stable, homogeneous elastography color map within the predefined Region of Interest (ROI) (as shown in
Access restricted. Please log in or start a trial to view this content.
Discussion
This study presented a standardized protocol for quantifying the functional stiffness spectrum of the Achilles tendon in elite male athletes using a portable force–ultrasound fusion device. Unlike conventional anatomical imaging, which offers limited functional insight, this method utilized vibration-based ultrasound elastography to non-invasively map the mechanical properties of the tendon across a physiological range of ankle joint angles. The total testing duration was approximately 10–20 min per subject, ...
Access restricted. Please log in or start a trial to view this content.
Disclosures
The authors have no conflicts of interest to disclose.
Acknowledgements
This research was funded by Fundamental Research Funds for the Central Universities of China (grant number: 2026QN014). The corresponding author (Y.C.) was supported by Chinese Tennis Association via Think Tank Project.
Access restricted. Please log in or start a trial to view this content.
Materials
| Name | Company | Catalog Number | Comments |
|---|---|---|---|
| Boots | Ober | AO-36 | use as suggested in protocol |
| Coupling Gel | Jinya Technology | TM-100 | use as suggested in protocol |
| Excel | Microsoft | https://www.microsoft.com/microsoft-365/excel | Used by authors to data arrangement |
| Jamovi | The jamovi project | https://www.jamovi.org/ | Used by authors to statistical analysis |
| Portable Ultrasound Device | XiJian Technology | T5C1B101WT | use as suggested in protocol |
| Prism | Graphpad | N/A; https://www.graphpad.com | Used by authors to visualization |
| SPSS | IBM | https://www.ibm.com/products/spss-statistics | Used by authors to statistical analysis |
Reprints and Permissions
