Here, we present a study to evaluate the anti-viral efficacy of copper- and silver-based surface coatings on air filters. Using a bioaerosol chamber and Phi6 bacteriophage, this method quantifies viral inactivation and mechanical filtration efficiency for self-sanitizing indoor air technologies.
Research Article
Evaluating the Effect of Coated Filters and Pre-Filters on the Infectivity and Concentration of Aerosolized Phi6 Virus
* These authors contributed equally
In This Article
Summary
Abstract
Development of efficient indoor air filtration technologies has gained prominence following the coronavirus disease 2019 (COVID-19) pandemic. The goal of this study is to evaluate the anti-viral efficacy of various copper and silver-based surface coatings for air filters using a standardized bioaerosol chamber and the enveloped bacteriophage Phi6 as a surrogate for respiratory viruses. Surface testing confirmed that all coatings exhibited anti-viral activity, with the specific copper-based coating formulation (B4) achieving complete inactivation of Phi6 virus within 10 min, A6 in 25 min, and VS-B in 60 min; early reductions in infectivity were primarily due to droplet desiccation. Aerosol experiments showed that high-efficiency particulate air (HEPA) filters and pre-filters substantially reduced viral infectivity even without coatings, with mechanical filtration causing a 1.0–2.0 log reduction, and high-efficiency grade GF-2 glass fiber filters eliminating detectable infectious virus. Coatings did not significantly enhance filtration efficiency, likely due to limited virus contact with coated surfaces. Used GF-2 filters demonstrated improved virus removal, attributed to particle accumulation and filter densification, while coatings did not alter the copy number of viruses passing through. VS-B coated filters exhibited lipophilic properties, suggesting additional functional benefits. This methodology highlights that while filter efficiency is primarily driven by mechanical entrapment and particle accumulation, the integrated surface coatings provide a self-sanitizing mechanism by inactivating trapped viral particles; the integration of ultraviolet (UV) light is proposed as a potential future research direction to enhance system efficacy further.
Introduction
Understanding of airborne viral transmission has advanced substantially during the COVID-19 pandemic. Given that indoor environments present markedly higher risks for transmission than outdoor settings, there is a compelling need to develop more effective protective strategies1,2. In this context, high-performance air conditioning and air purification systems constitute essential components for mitigating virus transmission in enclosed spaces.
Air filtration is one of the most prevalent methods used in air purification systems, relying on the intrinsic physical filtering qualities and multilayer filtering3,4,5. This often includes a pre-filter, a coarse filter that captures large particles; a medium-efficiency filter, for example, a carbon filter; and a high-efficiency particulate air (HEPA) filter that removes at least 99.97% of the particles with the most penetrating particle size of 0.3 µm6,7. The physical properties of the filters contain many antimicrobial benefits. It has been shown earlier that porous materials can inactivate viruses by trapping and drying them8,9,10. Hydrophobicity or hydrophilicity can also be utilized correspondingly. Viruses with hydrophobic coats favor hydrophobic surfaces for sorption, while hydrophilic surfaces attract hydrophilic viruses11,12. In addition, anti-viral surface coating can be used to further enhance purification. The coating of filters aims to inactivate pathogens immediately when they touch the filter13,14. These features could increase operational safety, especially in hospitals, but also in public environments during epidemics and pandemics14.
For practical applications, the inactivating effect of the filter coatings must be rapid enough to be utilized in flow-through air. Thus, the surface area for direct contact between the coating and virus particles should be sufficient, and the coating should be able to inactivate the virus within the given contact time. Heavy metals, such as copper and silver, are known to possess anti-viral effects15,16,17. This anti-viral effect has been observed for viruses such as poliovirus, vaccinia virus, herpes simplex 1, Phi6, papovirus SV-40, adenovirus, vesicular stomatitis virus, SARS-coronavirus, baculovirus, and feline infectious peritonitis virus18,19,20,21,22. Mechanisms include the release of copper and silver ions and the generation of reactive oxygen species (ROS), which react with virus proteins and oxidize nucleic acids23,24,25,26,27,28,29,30.
An aerosol filter test chamber with adjustable aerosol and virus sampling properties was developed for this research, based on a previous chamber setup presented by Sofieva et al. (2022) (see Figure 1 and Supplementary Figure 1)31. The adapted chamber was designed as a closed system in which model viruses for pathogenic respiratory disease-causing viruses are impacted by the filters, assessing the anti-viral efficiency of the coated and uncoated filters. The enveloped bacteriophage Phi6 was selected as a surrogate for respiratory viruses because it is a well-studied and widely used model suitable for viral aerosol studies. As Phi6 is non-pathogenic to humans and classified as Biosafety Level 1 (BSL-1), it allows for the safe and practical assessment of anti-viral coatings within a Biosafety Level 2 (BSL-2) laboratory environment in accordance with institutional safety guidelines. Furthermore, Phi6 shares structural similarities with enveloped viruses that cause respiratory illnesses, such as severe acute respiratory syndrome coronaviruses 1 and 2 (SARS-CoV-1 and SARS-CoV-2). Its lipid envelope also confers a specific sensitivity to desiccation and chemical inactivation, providing a representative model for evaluating the efficacy of antimicrobial surface coatings and filtration systems against enveloped pathogens32,33,34,35,36,37,38,39.
The objective of this study was first to analyze the anti-viral efficacy of the selected filter coating materials containing copper and silver by surface through surface testing with Phi6 bacteriophage prior to their use in air filtration. Subsequently, these copper- and silver-based surface treatment materials were assessed on air pre-filters to evaluate their capacity to enhance both filtration and elimination properties against airborne viruses.
Protocol
Virus, strains, growth media, and infectious virus counts
The bacteriophage Phi6, originally provided to the research group by Dr. Anne K. Vidaver40, was propagated using Pseudomonas syringae pv. phaseolicola HB10Y as the host bacterium. The host was cultivated in Luria–Bertani (LB) medium at 22 °C. Phi6 agar stocks were prepared from frozen material through serial dilution, following the protocol of Bamford et al. (1995)41, and used for both surface viability assays and virus purification.
Purification and concentration of Phi6 were performed according to the protocol developed by Bamford et al. (1995)41. The resulting suspension was diluted in 20 mM potassium phosphate (K₃PO₄) buffer containing 1 mM magnesium chloride (MgCl₂), adjusted to pH 7.2, to yield a final titer of 5 × 10¹⁰–1011 plaque-forming units per milliliter (PFU/mL). This prepared suspension was subsequently used for aerosol generation experiments.
Enumeration of infectious viral particles was performed using standard double-layer agar overlay plaque assay, which was optimized for bacteriophage Phi642. Briefly, first serial dilutions in LB medium were prepared for each virus- or control sample, after which to 100 µL of each dilution, 200 µL of host bacterium suspension and 3 mL of soft agar were added. The soft agar mixtures were overlayed on top of LB agar plates and the plates were incubated at 22 °C overnight. Plaques are then counted and number of PFU/mL were calculated as ( plaques × dilution factor ) / volume plated.
qRT-PCR analysis
Sample preparation for quantitative reverse transcription real-time polymerase chain reaction (qRT-PCR) followed the protocol of Gregorova et al. (2022)43. Standard curves for P2 and P8 RNA were generated using a 10-fold dilution series ranging from 102 to 109 molecules per 5 µL. Each dilution was processed identically to experimental samples, including chloroform addition, vortexing, centrifugation at 10000 × g for 1 min at 22 °C, and cycling (cycle and primer information in Supplementary Table 1 and Supplementary Table 2). Negative controls were prepared by substituting 5 µL of ultrapure water for the RNA template. qRT-PCR data were analyzed using the specific design and analysis software (see Table of Materials).
Aerosol chamber setup
A custom-built, autoclavable aerosol chamber was developed for virus aerosolization and filter testing, modeled after a previously described system31. The experimental chamber consisted of a cylindrical glass body with a matching lid, an internal metal scaffold, and insulating gaskets to ensure an airtight seal (see Table of Materials and Supplementary Figure 1).
The overall study setup, including the chamber, is shown in Figure 1. To ensure a stable and reproducible input of viral aerosols, a nebulizer was used in combination with an air pump (see Table of Materials).
Within the chamber, the nebulizer generated an aerosol flow of 8 L/min. Approximately three-quarters of this flow was directed to the exhaust through a HEPA filter, while the remaining one-quarter (2 L/min) entered the chamber. This split was designed to reduce humidity during prolonged measurements. Aerosols were introduced into the chamber via a metal funnel, which directed the flow onto the filter or pre-filter surface.
Aerosol experiments were performed within a biological safety cabinet. After passing through the chamber, airflow was dehumidified in a desiccator to protect the HEPA filter and flow meter from excessive moisture. An external pump further supported the airflow, creating negative pressure within the system and ensuring efficient exhaust through the outlet port.
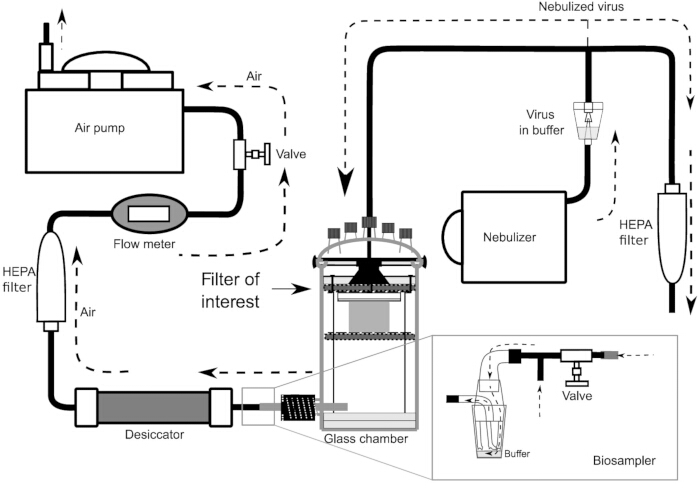
Figure 1: Schematic of the experimental aerosol chamber and sample collection. Please click here to view a larger version of this figure.
Study design
This study evaluated the anti-viral properties of coatings and filter/ pre-filter materials listed in Table 1, Supplementary Table 3, and Supplementary Table 4 (also see Table of Materials). The investigation was conducted in two stages, surface tests and pre-filter tests in the aerosol chamber.
In surface tests, all coating materials were first assessed on flat test pieces to determine their anti-viral activity. The coated test pieces were provided by Clean Touch Medical LTD (Table 1 and Table of Materials). All coatings are based on copper and/or silver active components embedded in proprietary matrices; differences between formulations primarily relate to metal composition, concentration, and surface compatibility (e.g., flat surfaces vs porous filters) (Supplementary Table 3).
Pre-filter tests in the aerosol chamber: Among the available coatings, only copper- and silver-based coating VS-B could be applied to pre-filters during the study. Pre-filters treated with VS-B were therefore examined in the aerosol chamber to assess their anti-viral performance under aerosol exposure conditions. Photographs of all filters and pre-filters used in the study are provided in Supplementary Figure 2.
Anti-viral efficacy was quantified by two complementary methods: plaque assay to measure the number of infectious viral particles (see section “Virus, strains, growth media, and infectious virus counts”), and quantitative PCR (qPCR) to determine viral genome copy numbers (see section ”qRT-PCR analysis”).
| Filters and prefilters | Filter provided by | Coatings |
| (All provided by Clean Touch Medical) | ||
| Polyester prefilter FMR-5, uncoated (FMR-5) | M-filter LTD | Experimental copper-based surface agent A6 (A6) Experimental copper-based surface agent B4 (B4) Copper and silver surface agent Viral Safe (VS) Copper and silver surface agent Viral Safe B (VS B) |
| Polyester prefilter FMR-5, coated with VS B (FMR-5 VS B) | ||
| Polyester prefilter S-11, uncoated (S-11) | ||
| Polyester prefilter S-11, coated with VS B (S-11 VS B) | ||
| Double-layer glass fiber filter GF-2, uncoated, (HEPA-type filter) (GF-2) | ||
| Bulpren prefilter BP-6, 6 mm, uncoated (BP-6) | Clean Touch Medical LTD | |
| Bulpren prefilter BP-6, 6 mm, coated with VS B (BP-6 VS B) |
Table 1: Filters and surface coatings used in this study.
Efficiency of anti-viral surface coatings
A surface viability assay was developed to evaluate the persistence of viral infectivity on different coating materials. Briefly, 20 µL of Phi6 stock (see section “Virus, strains, growth media, and infectious virus counts”) was pipetted onto the coated test pieces and evenly spread over a 2 cm × 2 cm area using a sterile glass triangle. Samples were incubated in a biosafety cabinet at 22 °C for 1 min, 5 min, 1 h, or 3 h.
Viruses were recovered by adding 180 µL of fresh LB broth to the surface and washing by repeated pipetting. A plastic Petri dish served as the control surface. All experiments were conducted at 22 °C. The number of infectious viral particles was quantified using a plaque assay41.
Effect of anti-viral coating VS-B on filter/ pre-filter efficacy
Virus collection and filter efficiency testing were conducted using either an impaction method with a petri dish containing 20 mM HEPES buffer (pH 7.2) or an all-glass swirling impinger (hereafter referred to as “the impinger”; see Table of Materials)44. For impaction sampling, a petri dish was positioned directly beneath the filter to maximize particle deposition (Figure 1). In experiments with GF‑2 filters that had been in use for 3 months, the impinger was employed instead of the petri dish to enhance sensitivity. The impinger is a glass device equipped with three nozzles and requires an external pump for air sampling into liquid. Airflow through the nozzles generates a swirling motion of the collection liquid along the inner wall, facilitating gentle particle removal. In this configuration, airflow through the filter was maintained at 2 L/min, and upon exiting the chamber, an additional valve increased the total air influx to 10 L/min. Aerosols were captured in 5 mL of 20 mM HEPES buffer (pH 7.2), with evaporated buffer replenished every 30 min. For the impinger experiments, both the petri dish and the bulpren pre-filter (used for airflow equalization; Supplementary Figure 1 and Supplementary Figure 2B) were removed.
The detailed sampling protocol is presented in Table 2. Viral aerosols were collected by recovering 1 mL of suspension from Petri dishes containing 20 mL of 20 mM HEPES buffer (pH 7.2). Of this, 800 µL was used for qRT‑PCR analysis and 200 µL for virus titration. Each filter or pre-filter was tested in triplicate, and control runs without a filter/pre-filter were performed for 15 min before and after each chamber experiment. Following the pre‑experiment control, the filter or pre-filter of interest was inserted into the chamber, which was operated for 3 h, after which the filter/pre-filter was removed, and a post‑experiment control run was conducted. qRT‑PCR and virus titration samples were collected every 30 min, yielding eight qRT‑PCR and eight titration samples per experiment. In the impinger experiments, titration samples were collected only once at the end of the 3 h run. Each qRT‑PCR sample was snap‑frozen in liquid nitrogen and stored at -80 °C until further use, while virus titration samples were processed immediately after the experiment using plaque assay. The virus solution used in the nebulizer was titrated both before and after each experiment to monitor stability.
Three different pre-filters, BP-6, S-11, and FMR-5, and the GF-2 filter (Table 1 and Supplementary Figure 2, Supplementary Table 4) were coated with VS-B. Pre-filters consisted of synthetic fibrous materials with varying structural densities, primarily designed for coarse particle removal and airflow stabilization, whereas the GF-2 filter is a high-efficiency glass fiber filter with HEPA-type performance. Pre-filters without coating and a setup without a filter were tested in the aerosol chamber for comparison.
| Time point | Setup | Samples | |
| Control | 0-15 min | No filter/prefilter, Petri dish with 20 mL of HEPES | 200 μl for titration, 800 μL frozen for qRT-PCR |
| Experiment | 0-30 min | Filter/prefilter of interest, new Petri dish with 20 mL of HEPES | |
| 30-60 min | Filter/prefilter of interest, same Petri dish with 19 mL of HEPES | ||
| 60-90 min | Filter/prefilter of interest, same Petri dish with 18 mL of HEPES | ||
| 90-120 min | Filter/prefilter of interest, same Petri dish with 17 mL of HEPES | ||
| 120-150 min | Filter/prefilter of interest, same Petri dish with 16 mL of HEPES | ||
| 150-180 min | Filter/prefilter of interest, same Petri dish with 15 mL of HEPES | ||
| Control | 0-15 min | No filter/prefilter, new Petri dish with 20 mL of HEPES |
Table 2: Timeline of sample collection.
Effect of anti-viral coating VS on used filters
The durability of the anti-viral effect on HEPA-type GF-2 filters coated with the copper–silver surface agent Viral Safe (VS) was assessed by measuring the filtering efficiency of filters that had been in use for 3 months, based on both infectious virus counts and viral genome copy numbers. For these experiments, four air purifiers (see Table of Materials), each equipped with a HEPA filter and an activated charcoal layer, were employed. The filters had been operated for a 3‑month period in two restaurants before collection and analysis: one was a fine-dining restaurant, and the other was a staff cafeteria at a factory (more information in Supplementary Figure 3 and Supplementary Figure 4). The performance of these used filters was compared to that of clean, uncoated GF‑2 filters.
Prior to chamber testing, the used filters were removed from the air purifier metal cages, unfolded, and cut into appropriately sized pieces for the aerosol chamber inside a laminar flow hood to ensure biosafety and minimize cross‑contamination. The GF‑2 filters collected from fine-dining restaurant and a staff cafeteria were then tested in the experimental setup described in section “study design”, using a modified 5 mL impinger for aerosol collection.
In addition to anti-viral efficiency, the physical surface properties of the filters were evaluated. Lipophilicity was assessed by applying 50 µL droplets of rapeseed oil, while hydrophobicity was determined by applying 50 µL droplets of deionized water to cut‑out filter strips. Contact angles were documented photographically following the procedure of Xiao and Wiesner (2012)45. Water repellence was quantified using water drop penetration time (WDPT) measurements as described by Lichner et al. (2006), with all values exceeding 7200 s46.
Statistical analysis
Statistical analysis was performed using standardized statistical software (see Table of Materials) to evaluate the significance of observed variations between tested coating materials and filters. Statistical analysis was performed in two steps for all experiments: the Kruskal-Wallis H test and Games-Howell post-hoc test. The Kruskal-Wallis H test was used to assess whether there were significant differences observed, and the specific variation between sample types was determined using multiple mean comparisons with the Games-Howell post hoc test.
Coating efficiency tests were statistically analyzed by comparing the decrease in infectious virus concentrations at 1 min and 5 min relative to the starting concentrations. Due to the aim of using the coatings on filters, we searched for statistically significant deviation in virus viability compared to the control within the first minutes of the test.
Statistical analysis determining significant differences in pre-filters’ efficiency with and without coating in terms of infectious count and qPCR results was performed for each time point, 30 min, 60 min, 90 min, 120 min, 150 min, and 180 min, separately. The data were then grouped by pre-filter type and the presence of coating on the pre-filter surface. Similarly, the results of the used GF-2 filters were assessed for efficiency in terms of virus inactivation and filtration efficiency by grouping data by location and the presence of coating on the filter surface.
Results
Efficiency of anti-viral surface coatings
The surface viability assays confirmed that all tested coating materials had anti-viral properties, with VS coating demonstrating the slowest virus inactivation rate (Figure 2A). Statistical analysis confirmed a significant decrease in infectious virus concentrations at 1 min and 5 min relative to the starting concentration for each coating and control (p < 0.001, Figure 2B, Supplementary Table 5). The experimental copper-based surface coating B4 achieved the fastest reduction, lowering infectious virus counts by up to three orders of magnitude within 5 min, and viruses were undetectable after 15 min (detection limit: 100 PFU/mL). Other coatings, A6 and VS-B, similarly achieved complete inactivation of Phi6 within 25 and 60 min, respectively (Figure 2A).
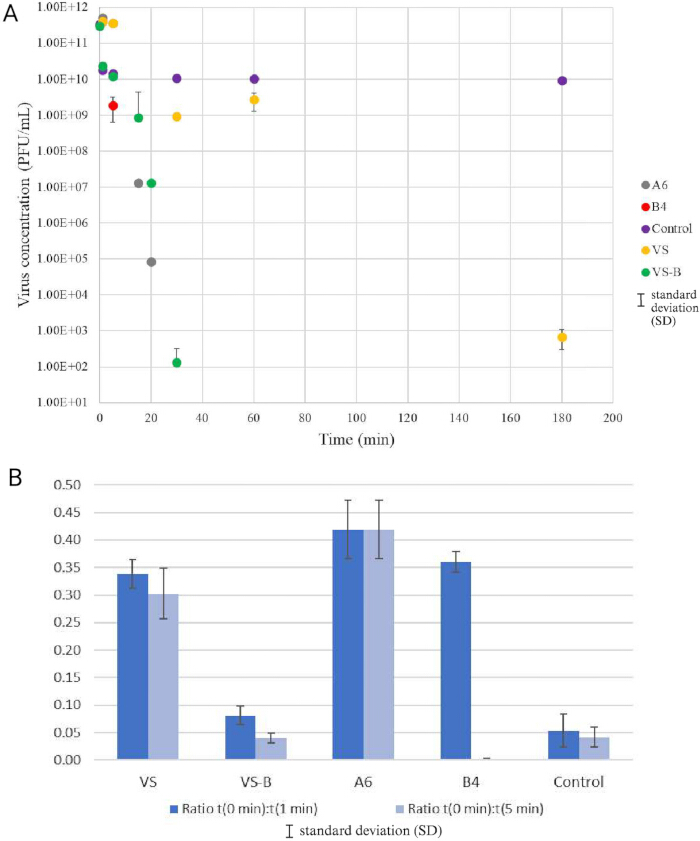
Figure 2: Anti-viral effect of surface coatings on virus infectivity. (A) Loss of infective particles as a function of time. (B) Ratio of infectious virus particle loss compared to the 0 min-time point. Coating specifications are listed in Table 1 and in Supplementary Table 3. Please click here to view a larger version of this figure.
Compared to the control, within the first 5 min, virus inactivation was least efficient with coating A6 (p = 0.006 at 1 min and p = 0.012 at 5 min, Supplementary Table 6), followed closely by coating VS (p = 0.001 at 1 min and p = 0.017 at 5 min, Supplementary Table 6). Coating B4 had decreased inactivation compared to control at the 1 min time point (p = 0.001, Supplementary Table 6) but did not differ significantly from control at the 5 min time point (p > 0.05, Supplementary Table 6). Over a longer timeframe, VS-B showed increased virus inactivation similar to B4 and A6. Detailed results of statistical analysis are provided in Supplementary Table 6.
Effect of anti-viral coating VS-B on filter/ pre-filter efficacy
Experiments showed that all three pre-filters studied, BP-6, S-11, and FMR-5, were equally effective at significantly lowering the number of infectious viruses passing through them by 1.5–2.0 orders of magnitude compared to the no-filter setup (Figure 3A, Supplementary Table 7). GF-2 filters lowered the viral load by at least six orders of magnitude, and no infectious Phi6 virus plaques were detected within the detection limit (indicated as non-detected data (*) in Figure 3A).
The VS-B coating did not significantly affect infectious virus filtration efficacy (Figure 3B). For pre-filters S-11 and FMR-5, the difference in the number of infectious viruses passing through the coated and uncoated pre-filters was within the standard deviation (SD), indicating the insignificance of the difference (Supplementary Table 8). Surprisingly, the uncoated pre-filter BP-6 performed better than the coated BP-6 pre-filter during the first 90 min. However, the differences between coated and uncoated pre-filters were proven to be statistically insignificant (p > 0.05, Supplementary Table 8).
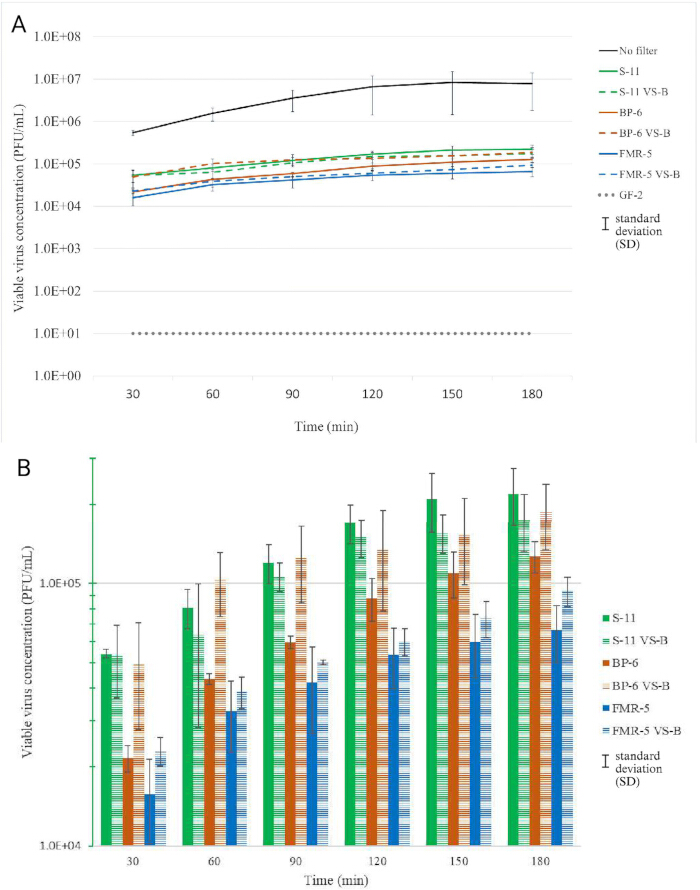
Figure 3: Average infective virus concentrations of the nebulized Phi6 virus on impaction plates. (A) For the GF-2 filter, no-filter setup, and pre-filter pre-filters. (B) For pre-filters only. Error bars represent standard deviation (SD), and filter types are listed in Table 1. VS-B indicates coated filters. GF-2 filter data resulted below the limit of detection and is marked with a dotted line. Please click here to view a larger version of this figure.
The qRT-PCR experiment results showed that pre-filters lowered the genome copy numbers of the viruses passing through pre-filters by up to two orders of magnitude, while the GF-2 filter showed a decrease of up to four orders of magnitude compared to the no-filter setup (Figure 4A, Supplementary Table 9). During the first 30 min, differences between pre-filters and the no-filter setup remained small, while from the 60 min time point, pre-filters showed increased mechanical filtering efficiency (Figure 4A, Supplementary Table 10). The VS-B coating did not affect the virus genome copy number passing through the filter (Figure 4B). Differences in genome copy numbers fell within the standard deviation (p > 0.05, Supplementary Table 10).
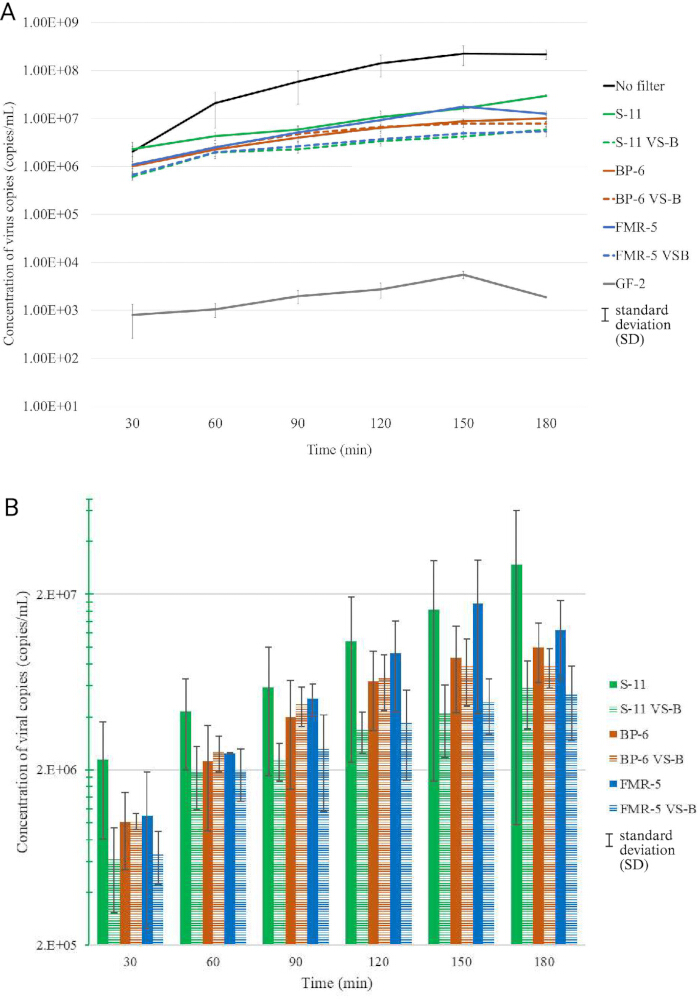
Figure 4: Average virus genome copy number concentrations of the nebulized Phi6 virus on impaction plates. (A) For the GF-2 filter, no-filter setup, and pre-filters. (B) For pre-filters only. Error bars represent standard deviation (SD), and filter types are listed in Table 1. VS-B indicates coated filters. Please click here to view a larger version of this figure.
Figure 3 and Figure 4 demonstrate that the number of infectious viruses (PFU/mL) compared to the total virus genome copy numbers of viruses passing through the filter is approximately two orders of magnitude smaller for pre-filters and the GF-2 filter, and only one order of magnitude smaller without a filter. This suggests that the effect of filtering, even with gentle air flow, can be mechanically destructive for the virus particles, leading to the loss of infectivity.
Based on the experimental airflow (2 L/min) and estimated filter surface area (~20 cm2), the face velocity was approximately 0.01–0.02 m/s. Typical porosity values for fibrous filters range from approximately 0.7 to 0.98, depending on material and packing density, with glass fiber HEPA-type filters generally exhibiting lower porosity (~0.7–0.9) compared to more open synthetic pre-filters (~0.85–0.98)47,48. Considering filter porosity and internal flow conditions, the interstitial velocity within the filter matrix was estimated to be slightly higher than the face velocity (0.02–0.03 m/s). Using filter thicknesses and incorporating tortuosity factors (1.2–2.0), the effective residence time of aerosol particles within the filter structure was estimated to range from approximately 0.03 to 0.4 s49. These sub-second interaction times indicate that virus–surface contact is highly transient, limiting the contribution of anti-viral coatings during single-pass filtration.
Effect of anti-viral coating VS on used filters
The coated and uncoated GF-2 filters used in air purifiers for 3 months at the two chosen restaurants (Supplementary Figure 3 and Supplementary Figure 4) were studied for their filtration capacity. Under the same experimental conditions, unused, uncoated (control) filters passed through 1.23 × 10² PFU/mL of infectious viruses. Used, uncoated filters from the fine-dining restaurant and staff cafeteria passed ~3 PFU/mL and 2.3 × 101 PFU/mL of infectious viruses, respectively. In contrast, used, VS-coated filters from a fine-dining restaurant and staff cafeteria passed 5.3 × 101 PFU/mL and 4.6 × 101 PFU/mL of infectious viruses, respectively (Figure 5). Statistically significant differences in infectious virus counts were observed between the filters, with 3-month-used, uncoated GF-2 filters showing the most pronounced reduction (Figure 5; χ2(2) = 11.432, p = 0.022, Supplementary Table 11). The results obtained using the coated 3-month-old GF-2 filters provided similar results as the unused uncoated GF-2 filters at p > 0.05 (Supplementary Table 12).
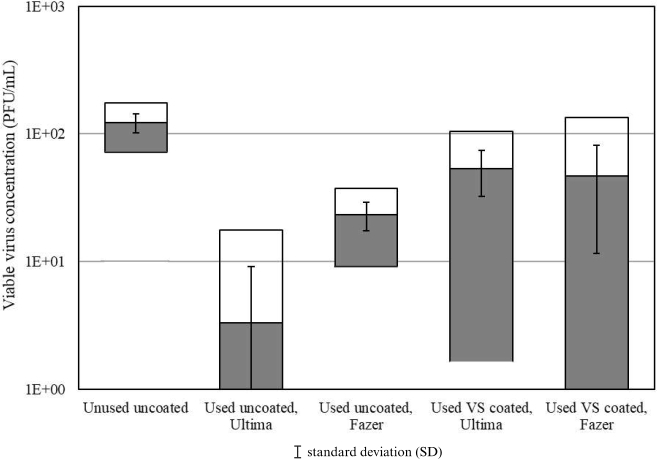
Figure 5: Infectious virus concentrations after testing three-month-old used filters. Each data point represents the average of three experiments and the calculated standard deviation across three repetitions. VS = Copper and silver surface agent Viral Safe; GF-2 = double-layer glass fiber filter GF-2, uncoated (HEPA-type filter); The boxes depict 95% confidence interval for mean, which is the black line between lower and upper confidence interval. Error bars represent standard deviation (SD) for each filter type. Please click here to view a larger version of this figure.
The qRT-PCR results of the used, unused, coated, and uncoated filters are presented in Figure 6. qRT-PCR data of unused, uncoated (control) filters displayed 2.7 × 10³ copies/mL of viral genome copies. Data of used, uncoated filters from the fine-dining restaurant and staff cafeteria displayed 3.6 × 10² copies/mL and 2.4 × 10³ copies/mL of viral copies, respectively, whereas used, VS-coated filters from the fine-dining restaurant and staff cafeteria displayed 2.8 × 10³ copies/mL and 4.6 × 10³ copies/mL of viral copies, respectively (Figure 6). The used, uncoated GF-2 filter from the fine-dining restaurant was significantly more efficient in reducing viral genome copy numbers compared to the used, uncoated filter from the staff cafeteria (p = 0.012), or the used VS coated from fine-dining restaurant (p < 0.001), or the used VS coated filter from staff cafeteria (p = 0.005) (Supplementary Table 13 and Supplementary Table 14). However, compared to the unused, uncoated GF-2 filter, the used uncoated GF-2 filter from the fine-dining restaurant resulted in no statistically significant difference (p>0.05). Detailed statistical analysis results are presented in Supplementary Table 14.
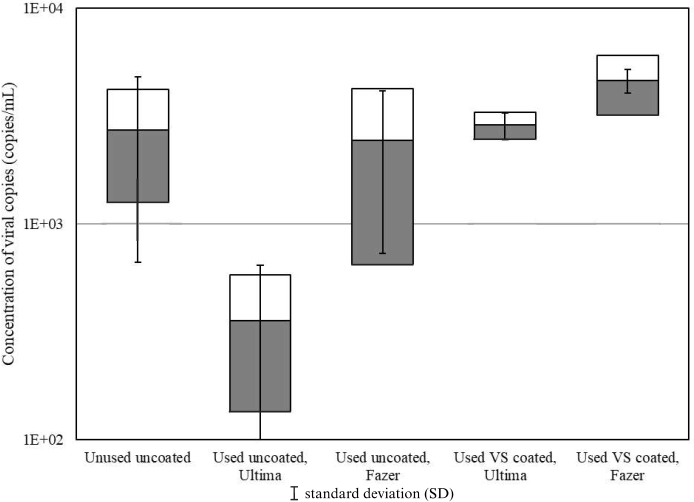
Figure 6: Concentration of viral genome copy numbers after testing three-month-old used filters. Each data point represents the average of three experiments and the calculated standard deviation. VS = Copper and silver surface agent Viral Safe; GF-2 = double-layer glass fiber filter GF-2, uncoated (HEPA-type filter); The boxes depict 95% confidence interval for mean, which is the black line between lower and upper confidence interval. Error bars represent standard deviation (SD) for each filter type. Please click here to view a larger version of this figure.
To clarify the observed differences in filter performance, hydrophobicity and lipophilicity tests were performed. All filters used in the fine-dining restaurant and staff cafeteria exhibited high hydrophobicity on both surfaces (inner side—facing incoming airflow; outer side—facing outgoing airflow), with the initial contact angle of water droplets consistently exceeding 120 degrees, as captured in photographs (not shown). Water drop penetration time (WDPT) measurements indicated a strong water-repellent property, with all values exceeding 7200 s. Variability among repeated tests was greater than that between filter types, potentially due to mechanical disturbances of the used filters. Consequently, no significant differences were detected between the filters using these methods.
Lipophilicity was assessed by applying rapeseed oil droplets to the filter surfaces. Uncoated filters consistently displayed low lipophilicity, with the droplet contact angle remaining above 120 degrees throughout the test. In contrast, Viral Safe-coated filters showed rapid droplet spreading, with an approximate angle of less than 30 degrees recorded 60 s after application (Supplementary Figure 5). It remains unclear whether this increased lipophilicity resulted from the coating itself or from the application process.
DATA AVAILABILITY
Raw data supporting the findings of this study are available in Supplementary File 1.
Supplementary Figure 1: Custom-made aerosol chamber and its components.Please click here to download this file.
Supplementary Figure 2: Pictures of filters, pre-filters, and coatings. (A) Polyester FMR-5 pre-filter, (B) Bulpren BP-6 pre-filter, (C) Polyester S-11 pre-filter, (D) Double-layer glass fiber GF-2 filter.Please click here to download this file.
Supplementary Figure 3: The layout of the fine-dining restaurant room where air purifiers (see Table of Materials) were used, marked by blue rectangles. Yellow rectangles mark tables, and a dark gray rectangle marks the door. One square in the grid represents 1 m2. Room size ~60 m2. About 30 guests visit per day.Please click here to download this file.
Supplementary Figure 4: The layout of the confectionery factory, staff cafeteria, where air purifiers (see Table of Materials) were used, marked by blue rectangles. Yellow rectangles mark tables, dark gray rectangles mark doors, gray rectangles mark self-service tables, and black rectangles mark support columns. One square in the grid represents 1 m2. Room size ~160 m2. About 20-50 guests visit per day.Please click here to download this file.
Supplementary Figure 5: Rapeseed oil droplets (50 µL) on GF-2 filter surfaces that had been used in the restaurant tests. Filters that had been covered with Viral Safe (VS) coating (1–5) were significantly less lipid-repellent than the uncoated filters (1, 6–7). Pictures were taken through the ocular of a preparation microscope with a 40 x magnification 60 s post application of a droplet. ”In” denotes the side of the filter where the airstream enters; ”out” denotes the air exiting side. The VS-B coating is on the outside. 1 refers to an old used filter from the fine-dining restaurant; 2 and 3 were VS-B coated filters used in the fine-dining restaurant; 4 and 5 were VS-B coated filters used in the staff cafeteria; and 6 and 7 were uncoated filters used in the staff cafeteria.Please click here to download this file.
Supplementary Table 1: qRT-PCR cycle information. Lid temperature 105 °C, 45 cycles, data acquisition during 62 °C step. Adapted from Gregorova et al.43. Please click here to download this file.
Supplementary Table 2: qRT-PCR primer information. Adapted from Gregorova et al.43. Please click here to download this file.
Supplementary Table 3: Detailed description of the coating materials used in this study. Exact chemical compositions of coatings are proprietary to the manufacturer (Clean Touch Medical Ltd.). Descriptions are based on functional classification and known active components (copper and/or silver).Please click here to download this file.
Supplementary Table 4: Detailed description of the filter materials used in this study. Exact material compositions of commercial pre-filters are not fully disclosed by manufacturers; descriptions are based on typical materials used in HVAC filtration systems and observed structural properties.Please click here to download this file.
Supplementary Table 5: Test statistics: Kruskal–Wallis analysis of viral infectivity across anti-viral surface coatings. The grouping variable is coating type.Please click here to download this file.
Supplementary Table 6: Statistically significant differences in viral infectivity between coatings at 1 min and 5 min timepoints according to Games-Howell Multiple comparisons post-hoc test results. Statistical significance is marked as Yes in the first two panels of the table, at 1 min and 5 min time points.Please click here to download this file.
Supplementary Table 7: Test statistics: Kruskal–Wallis analysis of viral infectivity across filter types and the no-filter condition. The grouping variable is the filter type.Please click here to download this file.
Supplementary Table 8: Results for multiple comparisons test of viral infectivity between pre-filters and no-filter setup at 30 min, 60 min, 90 min, 120 min, 150 min, and 180 min time points according to Games-Howell Multiple comparisons post-hoc test.Please click here to download this file.
Supplementary Table 9: Test Statistics: Kruskal–Wallis test results assessing differences in virus copy numbers among pre-filter types, the GF-2 filter, and the no-filter setup. The grouping variable is filter type.Please click here to download this file.
Supplementary Table 10: Results for multiple comparisons test of virus copy numbers between pre-filters, GF-2 filter, and no-filter setup at 30 min, 60 min, 90 min, 120 min, 150 min, and 180 min timepoints according to Games-Howell Multiple comparisons post-hoc test.Please click here to download this file.
Supplementary Table 11: Test Statistics: Kruskal–Wallis test results comparing viral infectivity between unused GF-2 filters and filters used in restaurants. The grouping variable is filter type.Please click here to download this file.
Supplementary Table 12: Results for the multiple comparisons test of viral infectivity between pre-filters and no-filter setup according to Games-Howell Multiple comparisons post-hoc test.Please click here to download this file.
Supplementary Table 13: Kruskal–Wallis test results comparing virus copy numbers among pre-filter types, the GF-2 filter, and the no-filter setup. The grouping variable is filter type.Please click here to download this file.
Supplementary Table 14: Results for the multiple comparisons test of virus copy numbers between pre-filters, GF-2 filter, and no-filter setup according to Games-Howell Multiple comparisons post-hoc test.Please click here to download this file.
Supplementary File 1: Raw data of this study.Please click here to download this file.
Discussion
In this study, we present a protocol for assessing the efficiency of anti-viral filter and pre-filter surface coatings in a microbiological aerosol chamber. The produced chamber offers a controlled, enclosed system suitable for aseptic microbiological analyses, as it is autoclavable, portable, transparent, and small-scale (3 L) compared to some previously described chambers31,50,51.
All coating materials tested in this study were confirmed to possess anti-viral activity (Figure 2A), with the experimental copper-based surface coating B4 demonstrating the highest efficacy, reducing virus infectivity below the limit of detection within 10 min. Copper-based coating A6 followed closely, achieving complete viral inactivation in 25 min (Figure 2A). These findings are consistent with previous reports on the anti-viral properties of copper and silver17,18,20,21,22,52. No virus inactivation was observed during the first 5 min prior to droplet desiccation, indicating that early reductions in infectivity were largely due to drying rather than the coating itself (control, Figure 2A, Figure 2B)36. Coatings B4 and A6 exhibited faster inactivation kinetics compared to VS and VS-B coatings, whereas VS-B required up to 60 min to reach the detection limit (Figure 2A). Pre-filters with B4 and A6 coatings were unavailable; therefore, VS-B was selected for subsequent filter aerosol experiments.
Results from this study emphasize that HEPA filters and pre-filters effectively reduce the number of viruses passing through them even in the absence of an anti-viral coating. Mechanical stress on aerosolized viruses during filtration led to a 1.0–2.0 log reduction in viral infectivity (from ~8 × 10⁵ – 1 × 10⁷ PFU/mL to ~5 × 10⁴ – 105, Figure 3A). This reduction was consistently observed across all pre-filter tests, supporting previous findings50,53,54. For the GF-2 HEPA-type filter, the loss of viral infectivity was even greater, with no detectable infectious particles within the method’s sensitivity limits (Figure 3A). The lower infectivity relative to total genome copy numbers suggests that filtration imposes mechanical damage on the virus particles, a phenomenon particularly pronounced for the enveloped Phi6 virus. As enveloped viruses are more susceptible to mechanical disruption, this difference may be smaller for non-enveloped viruses55.
In aerosol tests, coatings had no statistically significant effect on the filtration performance of pre-filters. This likely reflects limited contact between the coating and viruses passing through the filter, producing similar results for coated and uncoated pre-filters (Figure 3B, Figure 4B). The calculated sub-second residence times suggest that anti-viral inactivation kinetics must occur on a very rapid timescale to be effective under realistic airflow conditions. Additionally, our results suggest that the tested coatings do not exhibit the electrostatic affinity characteristic of copper ions toward negatively charged biological molecules, which could otherwise attract viruses to the filter and reduce their passage56. Therefore, the primary benefit of pre-filter coatings may lie in their post-capture self-sanitizing properties, as demonstrated in surface tests, rather than in enhancing the mechanical filtration efficiency. Importantly, the experiments conducted in this study represent single-pass filtration conditions, where aerosolized particles interact with the filter only once. This results in very short residence times and limited virus–surface contact, which likely reduces the observable impact of anti-viral coatings. In contrast, real-world air purification systems typically operate under recirculating conditions, where repeated air passage increases cumulative contact and may enhance coating effectiveness.
Our results indicate that GF-2 filters demonstrated improved removal of infectious viruses after three months of continuous use in air purifiers at the fine-dining restaurant and staff cafeteria (Supplementary Figure 3 and Supplementary Figure 4) compared to the unused filters (Figure 5). This improvement may be attributed to several factors. First, the accumulation of dust and other particulates has been reported to inactivate viruses57. Second, the progressive buildup of indoor air pollutants can densify the filter structure, potentially enhancing its efficacy temporarily57,58,59. Notably, the presence of coatings did not significantly affect virus infectivity or qRT-PCR-detected genome copy numbers. The passage of non-infectious virus particles was also similar regardless of filter coatings or usage, indicating that the observed filtration efficiency of the GF-2 HEPA-type filters and pre-filters primarily reflects their mechanical properties. Nevertheless, the accumulation of filtered particles on the GF-2 filter surface had a pronounced effect in reducing the number of infectious viruses passing through (Figure 5).
To understand the differences in filter performance observed in Figure 5 and Figure 6, additional tests were conducted. All filters exhibited strong hydrophobicity when exposed to water droplets, whereas oil droplet testing revealed notable differences, with VS-coated filters displaying pronounced lipophilicity. The underlying mechanism for this variation remains unclear, but these results suggest that filter age or usage history may not be the primary determinants of performance. Instead, the type of surface pretreatment may alter the physical properties of the filter, consequently affecting virus retention and passage. Collectively, these findings indicate that anti-viral coatings provide functional benefits beyond mechanical filtration, most notably through their self-sanitizing potential, which may reduce health risks for personnel handling used filters.
While this protocol provides a robust framework for evaluating anti-viral filtration, several limitations should be considered. First, the enveloped bacteriophage Phi6 was used as a surrogate for human respiratory pathogens. Although Phi6 shares structural and chemical similarities with coronaviruses, differences in environmental stability and surface proteins may influence exact inactivation kinetics. Second, while some coatings demonstrated significant efficacy, this study evaluated a limited set of formulations under specific aerosol conditions; future research should broaden the scope to include a wider range of antimicrobial agents. Finally, the experiments were conducted within a controlled aerosol chamber with regulated airflow and humidity. While these conditions ensure reproducibility, they do not fully replicate the complex, turbulent airflow and fluctuating environmental parameters found in real-world indoor environments.
Overall, this study demonstrates that while GF-2 glass fiber filters and pre-filters efficiently remove infectious viruses, particularly after prolonged use due to particle densification, the primary role of copper- and silver-based coatings is the inactivation of viruses upon direct contact. These findings underscore the robustness of mechanical filtration in controlling airborne viruses and suggest that future studies should evaluate the combination of anti-viral coatings with complementary interventions, such as UV irradiation, to further reduce transmission risk. pre-filter60,61. Also, future field studies integrating these coatings into existing building ventilation systems will be essential to validate their performance in situ.
Disclosures
The authors declare no conflict of interest.
Acknowledgements
Sari Korhonen is thanked for excellent technical assistance. Pavlina Gregorova is acknowledged for advice on the qRT-PCR protocol. We thank the late Professor Dennis H. Bamford for his invaluable input in designing the chamber setup and for all his support throughout the experiments. Dr. A.-P. Hyvärinen is thanked for providing a helping hand in setting up the aerosol test chamber. The facilities and expertise of the Instruct- HiLIFE Biocomplex unit at the University of Helsinki, a member of Instruct-ERIC Centre Finland, FINStruct, and Biocenter Finland are gratefully acknowledged. The study was funded by the Research Council of Finland, COVID special funding 335681, and funding 368144 to N.S.A. The Research Council of Finland is acknowledged for ACCC Flagship funding (grant no. 337552). We disclose the funding support from Clean Touch Medical LTD, M-Filter LTD, and UniqAir LTD to finalize the experiments, with no role played by the companies in the experimental design, execution, reporting, or in writing any part of the manuscript.
Materials
| Name | Company | Catalog Number | Comments |
|---|---|---|---|
| Aerosol chamber glass cylinder and lid | Laborexin Oy | N/A | Custom-made glass cylinder and lid for aerosol containment. |
| Aerosol chamber inner metal scaffold | Clean Touch Medical Ltd. | N/A | Custom-made stainless steel support structure for filter mounting. |
| Aerosol chamber lid insulating gaskets | Etra Oy (Etola Group) | N/A | Custom-made rubber gaskets for airtight sealing. |
| Air pump, WI 53082 | Thomas Industries Inc. | N/A | Diaphragm pump used to maintain regulated airflow through the chamber. |
| BioSampler | SKC Inc. | https://international.skcinc.com/products/air/bioaerosol-samplers/biosampler | All-glass swirling impinger used for high-efficiency collection of airborne viruses. |
| Coated test pieces | Clean Touch Medical Ltd. | www.cleantouchmedical.com | Gloss paper slides coated with antimicrobial formulations for surface efficacy testing. |
| CompAir Pro NE-C900 nebulizer | Omron Healthcare | NE-C900 | High-output compressor nebulizer used for viral aerosol generation. |
| SPSS Statistics software | IBM Corp. | https://www.ibm.com/products/spss | Statistical analysis software, version 28.0. |
| QuantStudio Design and Analysis Software | Thermo Fisher Scientific | https://www.thermofisher.com/in/en/home/technical-resources/software-downloads.html#pcr | Software used for qRT-PCR data analysis, version 1.3.1. |
| UniqAir PRO air purifier | UniqAir Oy | https://www.uniqair.fi/ | Commercial-grade air purification unit used for chamber scavenging. |
References
- Beggs, C. B., et al. Airborne transmission of SARS-CoV-2: the contrast between indoors and outdoors. Fluids. 9 (3), 54 (2024).
- Qian, H., et al. Indoor transmission of SARS-CoV-2. Indoor Air. 31 (3), 639-645 (2021).
- Han, S., Kim, J., Ko, S. H. Advances in air filtration technologies: structure-based and interaction-based approaches. Materials Today Advances. 9, 100134 (2021).
- Wang, P., Liu, Z., Chen, D. R. Performance of composite filters assembled from multiple layers of basic filtration media. Aerosol Air Qual Res. 20 (11), 2299-2308 (2020).
- Xu, Z. . Fundamentals of air cleaning technology and its application in cleanrooms. , (2014).
- Mao, N. . Advances in technical nonwovens. , (2016).
- Xie, Q., et al. The effect of pre-filter and main-filter media matching on the performance of an ultra-high-efficiency two-stage filtration system. Processes. 13 (4), 1075 (2025).
- Chattopadhyay, D., Chattopadhyay, S., Lyon, W. G., Wilson, J. T. Effect of surfactants on the survival and sorption of viruses. Environ Sci Technol. 36 (19), 4017-4024 (2002).
- G, R., et al. Bactericidal–bacteriostatic foam filters for air treatment. ACS Appl Polym Mater. 2 (4), 1569-1578 (2020).
- Xue, X., et al. All surfaces are not equal in contact transmission of SARS-CoV-2. Matter. 3 (5), 1433-1441 (2020).
- Tiwari, A., et al. Survival of two avian respiratory viruses on porous and nonporous surfaces. Avian Dis. 50 (2), 284-287 (2006).
- Yasui, M., et al. Virus removal by microfiltration: effects of electrostatic and hydrophobic interactions. Sep Purif Technol. 350, 127902 (2024).
- Kaushik, R., et al. . Indoor environmental quality. , (2024).
- Watson, R., et al. Efficacy of antimicrobial and anti-viral coated air filters to prevent the spread of airborne pathogens. Sci Rep. 12 (1), 2803 (2022).
- Jung, S., et al. Sustainable antibacterial and anti-viral high-performance copper-coated filter produced via ion beam treatment. Polymers. 14 (5), 1007 (2022).
- Lee, K. H., et al. Development of nano-sized copper-deposited antimicrobial air filters using a mixed melt-blown process. Nanomaterials. 13 (14), 2071 (2023).
- Rakowska, P. D., et al. Anti-viral surfaces and coatings and their mechanisms of action. Commun Mater. 2 (1), 53 (2021).
- Bright, K. R., et al. Assessment of the anti-viral properties of zeolites containing metal ions. Food Environ Virol. 1 (1), 37 (2009).
- Govind, V., et al. Anti-viral properties of copper and its alloys to inactivate COVID-19 virus: a review. Biometals. 34 (6), 1217-1235 (2021).
- Han, J., et al. Efficient and quick inactivation of SARS coronavirus and other microbes exposed to the surfaces of some metal catalysts. Biomed Environ Sci. 18 (3), 176-180 (2005).
- Montes, L. F., et al. Response of varicella zoster virus and herpes zoster to silver sulfadiazine. Cutis. 38 (6), 363-365 (1986).
- Silvestry-Rodriguez, N., et al. . Reviews of environmental contamination and toxicology. , (2007).
- Carubelli, R. Cytotoxic effects of autoxidative glycation. Free Radic Biol Med. 18 (2), 265-269 (1995).
- Chaturvedi, U. C., Shrivastava, R. Interaction of viral proteins with metal ions: role in maintaining the structure and functions of viruses. FEMS Immunol Med Microbiol. 43 (2), 105-114 (2005).
- Ermini, M. L., Voliani, V. Antimicrobial nano-agents: the copper age. ACS Nano. 15 (4), 6008-6029 (2021).
- Foster, A. W., et al. Metal preferences and metallation. J Biol Chem. 289 (41), 28095-28103 (2014).
- Kubo, A. L., et al. Antibacterial and anti-viral effects of Ag, Cu and Zn metals, respective nanoparticles and filter materials thereof against coronavirus SARS-CoV-2 and influenza A virus. Pharmaceutics. 14 (12), 2549 (2022).
- Thurman, R. B., et al. The molecular mechanisms of copper and silver ion disinfection of bacteria and viruses. Crit Rev Environ Control. 18 (4), 295-315 (1989).
- Warnes, S. L., et al. Inactivation of murine norovirus on a range of copper alloy surfaces is accompanied by loss of capsid integrity. Appl Environ Microbiol. 81 (3), 1085-1091 (2015).
- Zhang, Y., et al. Probing the viral metallome: searching for metalloproteins in bacteriophage λ–the hunt begins. Metallomics. 3 (5), 472 (2011).
- Sofieva, S., et al. Effects of temperature and salinity on sea-spray-aerosol formation simulated with a bubble-generating chamber. Aerosols/Laboratory Measurement/Instruments and Platforms. , (2022).
- Aquino de Carvalho, N., et al. Evaluation of Phi6 persistence and suitability as an enveloped virus surrogate. Environ Sci Technol. 51 (15), 8692-8700 (2017).
- Barros, J., et al. Bacteriophage Φ6 as surrogate and human-harmless viruses to study anti-SARS-CoV-2 approaches. COVID-19 Pandemic Case Studies Opin. 2 (1), 175-177 (2021).
- Dulbecco, R., Vogt, M. Some problems of animal virology as studied by the plaque technique. Cold Spring Harb Symp Quant Biol. 18, 273-279 (1953).
- Fedorenko, A., et al. Virus survival in evaporated saliva microdroplets deposited on inanimate surfaces. Microbiology. , (2020).
- Prussin, A. J., et al. Survival of the enveloped virus Phi6 in droplets as a function of relative humidity, absolute humidity, and temperature. Appl Environ Microbiol. 84 (12), e00551-e00618 (2018).
- Sanmark, E., et al. Safe use of PHI6 in experimental studies. Heliyon. 9 (2), e13565 (2023).
- Serrano-Aroca, &. #. 1. 9. 3. ;. Anti-viral characterization of advanced materials: use of bacteriophage Phi 6 as surrogate of enveloped viruses such as SARS-CoV-2. Int J Mol Sci. 23 (10), 5335 (2022).
- Turgeon, N., et al. Comparison of five bacteriophages as models for viral aerosol studies. Appl Environ Microbiol. 80 (14), 4242-4250 (2014).
- Vidaver, A. K., et al. Bacteriophage φ6: a lipid-containing virus of Pseudomonas phaseolicola. J Virol. 11 (5), 799-805 (1973).
- Bamford, D. H., et al. . Methods in molecular genetics. , (1995).
- Gratia, A. . Annales de l’Institut Pasteur. , (1936).
- Gregorova, P., et al. An improved RT-qPCR method for direct quantification of enveloped RNA viruses. MethodsX. 9, 101737 (2022).
- Grinshpun, S. A., et al. . Manual of environmental microbiology. , (2015).
- Xiao, Y., Wiesner, M. R. Characterization of surface hydrophobicity of engineered nanoparticles. J Hazard Mater. 215–216, 146-151 (2012).
- Lichner, L., et al. Evaluation of different clay minerals as additives for soil water repellency alleviation. Appl Clay Sci. 31 (3-4), 238-248 (2006).
- Lee, K. W., Liu, B. Y. H. Theoretical study of aerosol filtration by fibrous filters. Aerosol Sci Technol. 1 (2), 147-161 (1982).
- Lee, K. W., Liu, B. Y. H. Experimental study of aerosol filtration by fibrous filters. Aerosol Sci Technol. 1 (1), 35-46 (1982).
- Piekaar, H. W., Clarenburg, L. A. Aerosol filters—the tortuosity factor in fibrous filters. Chem Eng Sci. 22 (12), 1817-1827 (1967).
- Cao, G., et al. Development of an improved methodology to detect infectious airborne influenza virus using the NIOSH bioaerosol sampler. J Environ Monit. 13 (12), 3321 (2011).
- Dubuis, M. E., et al. Ozone efficacy for the control of airborne viruses: bacteriophage and norovirus models. PLoS ONE. 15 (4), e0231164 (2020).
- Law, C. K., et al. . Proceedings of the 5th International Conference on Building Energy and Environment. , (2023).
- Ge, S., et al. Airborne virus survivability during long-term sampling using a non-viable Andersen cascade impactor in an environmental chamber. Aerosol Sci Technol. 48 (12), 1360-1368 (2014).
- Holton, J., Webb, A. R. An evaluation of the microbial retention performance of three ventilator-circuit filters. Intensive Care Med. 20 (3), 233-237 (1994).
- Firquet, S., et al. Survival of enveloped and non-enveloped viruses on inanimate surfaces. Microbes Environ. 30 (2), 140-144 (2015).
- Imani, S. M., et al. Antimicrobial nanomaterials and coatings: current mechanisms and future perspectives to control the spread of viruses including SARS-CoV-2. ACS Nano. 14 (10), 12341-12369 (2020).
- Joe, Y. H., et al. Evaluation of Ag nanoparticle coated air filter against aerosolized virus: anti-viral efficiency with dust loading. J Hazard Mater. 301, 547-553 (2016).
- Thomas, D., et al. Clogging of fibrous filters by solid aerosol particles: experimental and modelling study. Chem Eng Sci. 56 (11), 3549-3561 (2001).
- Zhang, W., et al. Modeling the surface filtration pressure drop of PTFE HEPA filter media for low load applications. Build Environ. 177, 106905 (2020).
- Barnewall, R. E., Bischoff, W. E. Removal of SARS-CoV-2 bioaerosols using ultraviolet air filtration. Infect Control Hosp Epidemiol. 42 (8), 1014-1015 (2021).
- Shang, M., et al. Removal of virus aerosols by the combination of filtration and UV-C irradiation. Front Environ Sci Eng. 17 (3), 27 (2023).
Reprints and Permissions
