This protocol uses pose estimation by Python to track key body points in paired Drosophila, facilitating the automated quantification of subtle social behaviors, especially in social interaction, as well as heatmaps and locomotor trajectories.
A subscription to JoVE is required to view this content. Sign in or start your free trial.
Method Article
Protocol for Tracking and Automated Behavioral Quantification in Drosophila melanogaster
* These authors contributed equally
In This Article
Summary
Abstract
To develop an open-source analytical tool that overcomes the limitations of traditional centroid-based tracking methods, we present a protocol to accurately analyze social interactions in freely behaving Drosophila pairs. Specifically, this protocol is inspired by the high-resolution network (HRNet) framework to simultaneously track five anatomical key points—head, thorax, abdomen, and left and right wing tips —aiming to generate high-resolution coordinate data for subsequent quantitative analysis of social behaviors. This protocol provides a complete workflow based on Python and a graphical user interface (GUI) we designed, including dataset construction, model training, and automated coordinate extraction, along with integrated modules for generating spatial occupancy heatmaps, locomotor trajectories, and social interaction ratios in flies. To validate this framework, it was tested by using two widely used strains, w1118 and Canton-S (CS). Our results demonstrated the stability of key-point detection and revealed genotype-specific differences in spatial utilization and locomotive structure. This methodology provides a scalable foundation for quantitative ethology and automated analysis of social interactions in Drosophila, while reducing manual annotation effort and improving reproducibility.
Introduction
Drosophila melanogaster is a widely used model organism with powerful genetic tools and well‑mapped neural circuits that enable mechanistic dissection of behavior1. It has a wide range of social behaviors, including courtship and aggression, and a strong learning ability2,3,4,5,6,7,8. Each is composed of distinct motor elements controlled by a compact but extremely well-organized nerve system. Importantly, precise measurement of body posture is essential for understanding the neurological foundations of action selection because many of these behaviors contain fine‑grained postural motifs that encode contextual and internal‑state information9,10.
Despite the need for single-fly resolution to capture individual differences, many high‑throughput behavioral assays in Drosophila still rely on group‑level indices11. High-throughput behavioral assays include T‑maze tests for social preference12,13, social spacing assays that quantify inter‑fly distance, or aggregation/avoidance paradigms under sensory stimulation14 can efficiently capture population trends. However, they inherently involve averaging across individuals, thereby obscuring heterogeneity in action sequences and the temporal structure of social exchanges. Over the years, attempts to move toward per-fly identification have relied on functionally constrained methods, such as rule-based event detection using kinematic thresholds, background subtraction with centroid tracking, and manual video annotation15,16,17,18. As a result, discrete behaviors such as lunging, tapping, or wing threats are often ignored or mislabeled, necessitating significant manual correction. Such constraints have restricted mechanistic studies that require precise temporal alignment between neural activity and individual actions.
A revolutionary solution is now available thanks to recent developments in computer vision and machine learning-based pose estimation. Open-source frameworks like DeepLabCut19 and SLEAP20 enable marker-less body-part detection, scalable classification of discrete actions, and preservation of individual identity even during close interactions. These features overcome the drawbacks of previous group-based and rule-driven approaches and enable repeatable quantification of complex social behaviors.
Individual interactions in Drosophila are characterized by unique motor features that indicate the progression of social interactions. Aggression, for instance, includes typical behaviors like lunging, wing threats, and grappling, all of which represent growing conflict stages21,22. Courtship is similarly defined by orientation, unilateral wing extension with song production, tapping, and attempted copulation, which come together to form the temporal sequence of mating interactions23. Capturing these motifs depends on accurate recognition of body posture and joint movements24,25. In practice, sampling requires high spatial and temporal resolution over extended recording periods to ensure that subtle motor patterns can be precisely detected and aligned with neural activity25,26.
Here, we present an open‑source, vision‑based framework for automated identification of five anatomical key points—head, thorax, abdomen, left and right wing tips27. The system comprises a complete workflow for dataset construction, model training, and coordinate extraction, and outputs high‑resolution time‑series data suitable for customizable behavioral classification. By automating manual annotation processes and standardizing analytical workflows, our method enables fine-scale quantitative analysis of social interaction behaviors, increasing efficiency and reproducibility while significantly reducing the time and labor required for analysis.
To validate the reliability of the system, we applied it to two commonly used laboratory strains, w1118 and Canton-S (CS), and observed stable key-point detection across frames, as well as genotype-specific differences in spatial occupancy, trajectory features, and social interaction indicators based on head distance and orientation angle. Researchers can assess the suitability of this protocol based on the required spatiotemporal resolution (≥30 fps, ≤0.5 mm/pixel) and video recording conditions (illumination and contrast). The pixel size can be directly determined from the camera settings. A fruit fly with a measured body length can be placed inside the imaging field of view for calibration. This protocol is particularly suitable for the following scenarios: needing to simultaneously track two freely interacting Drosophila and distinguish their individual identities; focusing on fine postures (e.g., head angle and distance) rather than only centroid positions; recording duration exceeding 10 min where manual annotation is not feasible; requiring millisecond-level temporal alignment between behavioral events and neural activity (e.g., calcium imaging or electrophysiology) in subsequent analyses.
Access restricted. Please log in or start a trial to view this content.
Protocol
1. Fly preparation
- Collect and sex the flies around 3–4 days old under brief CO₂ anesthesia before experiments.
NOTE: The duration of anesthesia and the CO₂ flow rate may vary depending on the specifications and pressure of the carbon dioxide cylinder used in each laboratory. Flies should be monitored continuously during anesthesia, and CO₂ exposure should be maintained only until the flies are fully anesthetized and exhibit complete cessation of movement. - Place each fly individually into a 50 mL Falcon tube containing standard cornmeal–agar–glucose–yeast medium.
- Maintain flies at 25 °C under a 12 h light/dark cycle until use.
2. Arena construction
- Prepare two 3 mm transparent acrylic plates and one 3 mm polyethylene plate.
- Cut four circular chambers (35 mm diameter each) into the center of the polyethylene plate.
- Use clips to bond one acrylic plate to the polyethylene plate to form the chamber base; keep the second acrylic plate as a removable cover.
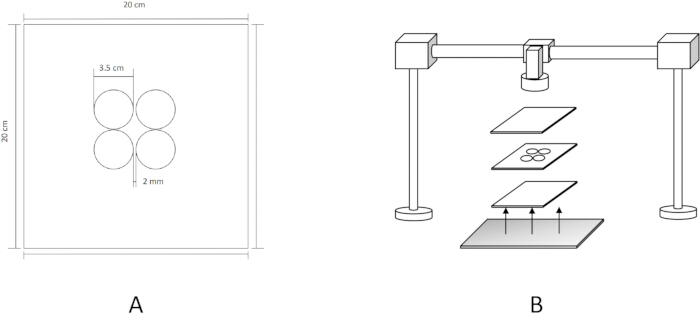
Figure 1: Schematic of the behavioral arena and imaging setup. (A) The construction of a custom observation chamber is depicted in the diagram. The chamber consists of three primary layers: a 3 mm transparent acrylic base plate; a 3 mm polyethylene plate with four 35 mm diameter circular cutouts serving as individual chamber wells; and a second acrylic plate that functions as a removable cover. (B) A 90° adapter clamp is used to install the camera vertically on a 40 cm optic pole. For top-down imaging, the camera is positioned directly above the multi-layered observation arena with its optical axis perpendicular to the chamber surface. Please click here to view a larger version of this figure.
3. Imaging setup
- Assemble two 20 cm optic poles and one 40 cm pole with 90° adapter clamps.
- Mount the camera (1280 × 1024 pixels) vertically on the 40 cm pole, aligned perpendicular to the arena surface, and set the frame rate to 150 fps.
- Place the arena on a 25 cm × 25 cm dimmable daylight-white LED panel covered with a diffusion sheet.
- Adjust illumination to about 1500 lux at the arena surface.
NOTE: Ensure wing edges remain visible in binary preview. Avoid >2000 lux to prevent heat-induced artifacts, as flies may change their natural locomotion or distribution due to thermal stress from the light source.
4. Recording procedure
- Place 3 cm foam pads under each corner of the arena to stabilize it.
- Transfer fly pairs under CO₂ anesthesia into chambers; seal with the upper acrylic plate.
- Allow flies to acclimate for 40 min before recording.
- Start video acquisition using MIAS.exe27: press q to begin and c to stop.
NOTE: This results in continuous video recordings of freely interacting fly pairs under standardized conditions.
5. Define the social activity panel
- Run the preprocessing script: python SoAL_PreProcess.py [video_file_path]
NOTE: All coding scripts are provided in Supplementary File 1. - Annotate chamber area and assign metadata in the form of Genotype_age (days) × 1 (number of chambers). (e.g., CS_3 × 1)
- Adjust the detection threshold slider until wings are nearly invisible in the binary image to ensure optimal background subtraction and wing visibility.
6. Dataset preparation
- Create a new dataset folder by running:
python tools/SoAL_DatasetGen.py DATASETNAME 10 (frame sampling interval)
NOTE: The frame sampling interval parameter (“10”) was adapted from a previously published protocol27. Lower values increase sampling density and computational load, whereas higher values reduce computational demand and may be adjusted based on available hardware performance and experimental requirements. - Set up video path and dataset path in ‘tools/SoAL_DatasetUtils.py’
- Launch manual labeling interface:
>python tools/SoAL_LabelUI.py DATASETNAME- Frame navigation: Press the Space key or the Z key to navigate to the next or previous frame, respectively. Alternatively, use the timeline slider for navigation.
- Key-point labeling: Click on the correct position of a fly in each image (in a specific sequence: head, thorax, abdomen, left wing, and right wing) to mark the 5 key-points.
- Key-point selection: Press number keys to select a key-point (indicated by a white circle). The next click will reassign a new number to the selected key-point.
- Saving: Close the window or press the D Key to save the annotation results.
NOTE: A complete training set archive comprises two components: an image directory and an annotation.json file.
7. Model training
- Divide the dataset into training and validation sets:
python tools/SoAL_DatasetGen.py DATASETNAME divide
Two new folders will be created in ‘dataset/.’ - Configure training parameters in hrnet/fly_w32.yaml:
Rotation factor: 15°
Scale factor: 0.35
Brightness factor: 0.25
Batch size: 24
Epochs: 200 - Run the training program:
python hrnet/tools/train.py --cfg hrnet/fly_w32.yaml
Terminate training sets when average precision (AP) plateaus; retain the best model (AP > 90%). - Validate model using:
python hrnet/tools/test.py --cfg hrnet/fly_w32.yaml
Outcome: Robust HRNet‑based model for multi‑fly key-point detection.
8. Run the detection program
- Copy new video files into the video directory.
- Annotate metadata as shown in step 5.
- Run detection program: python SoAL_KptDetect.py all
- Inspect detection results:
python tools/SoAL_ViewKptUI.py excel_file_path (.cvs/xslx)
Outcome: Two-dimensional coordinates of five anatomical landmarks per fly across frames.
9. Behavioral Quantification
- Launch a standalone GUI application for analysis (Supplementary File 2) and import coordinate files into the interface.
- Generate spatial occupancy heatmaps (probability density of arena positions).
- Reconstruct locomotor trajectories from coordinate time series.
- Create social interaction data, including head distance, orientation, and derived social state.
Outcome: Standardized visualization of genotype-specific spatial usage and movement dynamics.
Access restricted. Please log in or start a trial to view this content.
Results
Figure 1 illustrates the arena geometry, illumination configuration, and camera placement used for recording natural social interactions in Drosophila. The setup ensures uniform lighting and stable imaging conditions suitable for pose estimation and coordinate extraction.
Automated pose estimation was applied to all recorded videos to extract two-dimensional coordinates for predefined anatomical key-points of each fly. The model consistently identified he...
Access restricted. Please log in or start a trial to view this content.
Discussion
Our study shows that machine-learning-based pose estimation provides a scalable, reliable method for measuring fine-grained social interactions in Drosophila. It overcomes the limitations of centroid-based approaches15,16,17,18 by tracking five anatomical key-points in freely interacting pairs, allowing the acquisition of angular information provided by the body axis and head-to-head d...
Access restricted. Please log in or start a trial to view this content.
Disclosures
The authors declare no financial conflicts of interest.
Acknowledgements
We acknowledge Dr. Jingyuan Zhang in the Graduate School at Guangzhou Medical University for providing and maintaining the imaging setup.
Funding: Guangzhou Major Medical Disciplines Project (2025-2027)
Access restricted. Please log in or start a trial to view this content.
Materials
| Name | Company | Catalog Number | Comments |
|---|---|---|---|
| Agar | BioFroxx | 8211GR500 | |
| camera(MV-CU013-A0UC) | Hikvision | MV-CU013-A0UC | |
| Carbon Dioxide | Messer | 124-38-9 | |
| D(+)-Glucose anhydrous | BioFroxx | 1179GR500 | |
| Drosophila Narrow Vials (Falcon tube) | Biolgix | 51-0500 | |
| Ethanol | Chron Chemicals | 64-17-5 | |
| LED panel | / | / | custom-made |
| Methylparaben | Sigma | 99-76-3 | |
| polyethylene plate | / | / | custom-made |
| Python | / | version 3.6 | |
| Sucrose | DaMao | 57-50-1 | |
| transparent acrylic plates | / | / | custom-made |
| Yeast | Angel | 100004237033 |