To model how inflammatory signals influence neurodevelopment in genetically susceptible organisms, we present a protocol for microinjecting IL-6 into the duct of Cuvier (common cardinal vein) of zebrafish larvae, enabling controlled induction of inflammation and assessment of its developmental impact in the context of tuberous sclerosis complex (TSC).
Method Article
Microinjection of Interleukin-6 into the Bloodstream of TSC Zebrafish Larvae to Study Neuropsychiatric Disorder-Like Behaviors
In This Article
Summary
Abstract
Patients with tuberous sclerosis complex (TSC1/TSC2 mutations) exhibit variable expressivity of autism spectrum disorder (ASD), and maternal immune activation is known to heighten ASD risk. Interleukin-6 (IL-6) is a pleiotropic cytokine with well-established roles in immune regulation, inflammation, and neuroinflammatory processes. It is produced by multiple immune cell types in response to infection or tissue injury, and is commonly characterized as a pro-inflammatory mediator. Notably, IL-6 can cross the blood-brain barrier and has been implicated in neuroinflammation and inflammation-associated neuropsychiatric conditions, including autism spectrum disorder (ASD) and intellectual disability (ID). Here, we describe a protocol to induce systemic inflammatory signaling in zebrafish by delivering IL‑6 into the bloodstream through injection into the duct of Cuvier. This approach enables controlled and reproducible inflammatory responses to study inflammation-driven changes in early development. The protocol details the essential steps for IL-6 preparation, microinjection, and downstream experimental applications in zebrafish models of disease and neuroinflammation, including studies designed to probe gene-environment interactions. By enabling controlled induction of systemic inflammatory signaling, this approach provides a versatile platform for examining how genetic susceptibility and inflammatory exposures intersect to shape developmental outcomes.
Introduction
Understanding how inflammatory signals shape early neurodevelopment is essential for dissecting mechanisms underlying neurodevelopmental disorders, particularly in genetically susceptible contexts. The primary goal of this protocol is to provide a precise, reproducible approach for inducing systemic inflammatory signaling in zebrafish larvae through direct microinjection of interleukin‑6 (IL‑6) into the duct of Cuvier (the common cardinal vein).
Tuberous sclerosis complex (TSC) exemplifies such gene-environment interactions. TSC is a rare genetic disorder caused by mutations in TSC1 or TSC2, which encode hamartin and tuberin, respectively, proteins that form a complex that normally suppresses mTORC1 signaling. Loss of this inhibition leads to hyperactivation of the mTORC1 pathway, resulting in abnormal cell growth and a broad spectrum of clinical manifestations, including autism spectrum disorder (ASD)1,2. ASD is estimated to affect ~1.5% of individuals with an average diagnosis age of ~3 years in developed countries3. ASD is characterized by repetitive behaviors, impaired social interactions, and reduced cognitive flexibility4, and patients often present with additional neurobehavioral challenges such as anxiety, depression, or intellectual disability3. Notably, 40%-60% of individuals with TSC exhibit ASD-related features2, yet symptom severity varies widely – even among patients with similar mutations – suggesting that environmental factors modulate genetically driven risk.
One such factor is inflammation. Although the etiology of ASD remains largely unknown, neuroinflammation across multiple brain regions has long been implicated5. Increasing preclinical and clinical evidence indicates that fetal neuroinflammation triggered by maternal immune activation (MIA) and the resulting elevation of cytokine signaling may contribute significantly to the pathogenesis of ASD6. Thus, modeling inflammatory cytokine exposure in genetically susceptible systems, such as TSC, provides a powerful framework for probing how immune signals intersect with disrupted mTORC1 regulation to influence early brain development.
The rationale for developing this protocol stems from the growing recognition that cytokine‑mediated inflammation, including IL-6 signaling, can interact with genetic vulnerabilities to influence neurodevelopmental trajectories. Cytokines are low-molecular-weight glycoproteins that coordinate communication within the immune system. In ASD, multiple studies have consistently reported elevated levels of pro‑inflammatory cytokines, including IL‑6 in peripheral blood7,8,9,10, supporting the hypothesis that dysregulated IL‑6 signaling may contribute to the neurodevelopmental and behavioral features characteristic of the disorder. IL-6 is a key mediator of immune activation produced by diverse immune cell types in response to infection or tissue damage. Because IL‑6 can cross the blood-brain barrier and directly influence neurons, astrocytes, and microglia, sustained elevation of this cytokine has been implicated in altering neurodevelopmental pathways, synaptic plasticity, and neuroimmune homeostasis –mechanisms increasingly explored in ASD pathophysiology11,12. These links are further strengthened by MIA studies, where elevated maternal IL‑6 during pregnancy disrupts fetal brain development and increases ASD‑related risk13. However, the existing vertebrate models often rely on systemic immune stimulation through pathogen‑associated molecules or maternal exposure paradigms, which can introduce variability, activate multiple immune pathways simultaneously, and limit the ability to isolate the specific contribution of IL‑6. Direct IL‑6 microinjection in zebrafish overcomes these limitations by enabling targeted manipulation of a single cytokine within a transparent, genetically tractable organism.
Zebrafish offer several advantages for studying cytokine‑driven developmental effects. Their optical transparency allows real‑time visualization of immune and neural responses; their rapid development enables high‑throughput experimentation; and their conserved cytokine signaling pathways make them a powerful vertebrate model for dissecting inflammatory mechanisms14,15,16,17,18. In experimental studies, it is necessary to deliver exogenous materials (bacteria, cancer cells, DNA, nanoparticles, etc.) into zebrafish larvae. One approach involves exposing larvae to a solution containing the material of interest, allowing passive uptake through the skin, gills, or gastrointestinal tract. The second and more direct method is microinjection, in which external materials are delivered into specific embryonic or larval compartments using fine glass needles 19,20,21. Importantly, microinjection into the duct of Cuvier provides a reliable route for systemic delivery, ensuring rapid distribution of IL‑6 throughout the circulation without the confounding effects of whole‑organism immune stimulation.
In this protocol, we present a step-by-step procedure from the preparation of injection syringes to the injections of IL-6 into the bloodstream via the duct of Cuvier of zebrafish larvae at 2 and 3 days post fertilization (dpf). This method is particularly useful for researchers investigating how specific inflammatory cues influence early developmental processes, gene-environment interactions in models of neurodevelopmental or immune‑related disorders, the cellular and molecular consequences of cytokine exposure in vivo, or the interplay between genetic mutations and inflammatory signaling pathways. By offering a controlled, cytokine‑specific, and developmentally precise approach, this protocol provides a versatile platform for probing the mechanisms through which IL‑6 and related immune signals shape early immune, neural, and behavioral outcomes.
Protocol
For the procedure described here, the tsc2vu242/+ zebrafish line was used22,23. All experiments performed were conducted in accordance with all relevant legislation, and no additional ethics committee approval is required specifically because the developmental stage used (<5 dpf) falls outside the scope of mandatory ethical review. Figure 1 presents a schematic of the protocol.
1. Pulling of micropipettes
- Prepare microinjection needles from borosilicate glass capillaries using a micropipette puller, following established procedures24.
- Use 10 cm long borosilicate glass capillaries (1.0 mm outer diameter, thin-walled) and load them into a micropipette puller.
- Carefully position the capillary within the puller carriage, ensuring precise alignment within the designated groove, and secure it firmly using the instrument clamps to prevent movement during pulling.
- Adjust the capillary so that it is centered within the heating filament, ensuring uniform heating along the region to be pulled for consistent needle formation.
- Initiate the pull program using optimized parameters (e.g., for Sutter instrument use heat: 533, pull: 50, velocity: 60, delay: 90, and pressure: 200) for generating fine-tipped microinjection needles.
CAUTION: Microneedles pulled from glass capillaries are fragile and can easily crack, clog, or develop irregular tip shapes that alter injection volume. Inspect each needle under a stereomicroscope before use, avoid touching the tip to hard surfaces, and replace needles immediately if resistance, leakage, or inconsistent droplet size is observed.
NOTE: Following the pulling process, tapered needle tips are formed at both ends of the capillary. Prior to use, the tip should be carefully opened by gently breaking it with fine forceps under a stereomicroscope to achieve the desired aperture size for microinjection.
2. Preparation of buffers and stock solution
- Prepare a 60× stock solution of E3 embryo medium (see Table 1). Sterilize the solution by autoclaving and store at 4 °C. For use, dilute the stock solution in ultrapure water to obtain 1× E3 working solution.
NOTE: 60× stock solution of E3 embryo medium can be stored at 4 °C for long-term storage. - Prepare a 20x stock solution of tricaine (MS-222) as described in Table 1. Store the solution at 4 °C in the dark to prevent degradation. Prior to use, dilute to 1× working concentration in E3 medium.
NOTE: Adjust the pH of tricaine stock solution to 7.5 using 1 M Tris pH 9.0. This solution can be aliquoted and kept in -20 °C (frozen) for long-term storage or stored at 4 °C. Tricaine degrades at RT and under light to a toxic compound.
CAUTION: Special care should be taken when using tricaine (MS‑222) for anesthesia, as both under‑ and over‑exposure can adversely affect larval physiology and behavior. Excess exposure can depress cardiac function and alter later behavior, while insufficient anesthesia increases the risk of injury during mounting. Use only the minimal effective concentration and duration, and allow full recovery in fresh embryo medium before behavioral assays. - Prepare a 1% (w/v) agarose solution in E3 medium by heating until fully dissolved.
NOTE: If prepared in advance, the solution may be stored at 4 °C and reheated prior to use. On the day of the experiment, maintain the agarose in a liquid state at 55–60 °C to prevent premature solidification. - Prepare a 0.9% (w/v) NaCl solution and store at room temperature for up to 1 week or at 4 °C for extended storage. Before use, equilibrate the solution to room temperature or incubate at 28.5 °C to match the physiological conditions of the embryos.
- Prepare a 2 pg/nL IL-6 solution in 0.9% NaCl. Aliquot the solution to avoid repeated freeze-thaw cycles and store at -20 °C. Prior to use, thaw and bring the aliquot to room temperature.
- Prepare a 0.5 mg/mL working solution of pronase in E3 medium from a 20 mg/mL stock solution prepared in ultrapure water.
3. Obtaining and raising embryos until 2 dpf
- Set up group spawning by placing multiple tsc2vu242/vu242 adult zebrafish in a spawning tank.
NOTE: Males and females can be separated overnight using a divider to prevent premature spawning, with the divider removed the following morning to induce synchronized mating. Alternatively, fish may be maintained without a divider in a light-controlled environment, where the transition from dark (night) to light (morning) acts as a spawning cue. - On the following day, remove the divider (if used) and allow spawning to proceed for approximately 1 h.
- Collect fertilized embryos promptly and transfer them to 100 mm Petri dishes containing 40 mL of E3 embryo medium, maintaining a density of no more than ~60 embryos per dish to ensure optimal development.
- Incubate embryos at 28.5 °C under a controlled diurnal cycle of 14 h light and 10 h dark.
- At 1 dpf and 2 dpf, examine embryos under a stereomicroscope and remove dead embryos, unfertilized eggs, and debris to maintain culture quality.
- Replace the E3 medium with fresh solution to minimize waste accumulation and support normal embryonic development.
4. Preparation of agarose plates for microinjections and dechorionation
- Prepare a 1% (w/v) agarose solution in E3 medium and heat it until the agarose is completely dissolved and the solution becomes clear.
- Allow the solution to cool briefly, then pour approximately 30 mL into a 100 mm Petri dish, ensuring an even layer across the surface.
- While the agarose is still liquid but beginning to solidify, gently place a silicone mold onto the surface to create uniform grooves.
NOTE: Here, silicone molds with pyramidal-shaped patterns (Figure 2) are used to generate wells capable of retaining excess E3 during microinjection. These wells are designed to transiently provide stability during handling and injection by maintaining sufficient moisture to prevent desiccation and ensure embryo viability for several minutes outside standard incubation conditions. - Prepare agarose-coated Petri dishes for enzymatic dechorionation (50 mm diameter) by pouring approximately 5 mL of molten 1% (w/v) agarose solution and gently swirling the dish to evenly coat the surface.
- Remove any excess agarose.
- Allow the agarose to solidify at room temperature for 10–15 min. Once set, the dishes are ready for use in the enzymatic dechorionation of embryos.
5. Enzymatic dechorionation of 2 dpf fish
- Transfer approximately 100 embryos in chorions at 2 dpf into a small (50 mm) agarose-coated Petri dish.
- Remove as much E3 medium as possible to minimize dilution of the enzymatic solution and ensure efficient dechorionation.
- Add 4 mL of freshly prepared pronase solution (stock concentration: 20 mg/mL [prepared in ultrapure water], working concentration: 0.5 mg/mL [diluted in E3]) to the dish, ensuring embryos are fully submerged.
CAUTION: Pronase treatment must be carefully controlled, as over‑digestion can damage the larval tissues, leading to increased fragility during handling and potentially affecting survival or behavior. Use only the minimal effective exposure time, and rinse embryos thoroughly afterward to prevent continued enzymatic activity. - Incubate at room temperature for 3–5 min, monitoring the release from chorions under a stereomicroscope.
- Gently rotate or swirl the dish intermittently to facilitate the enzymatic removal of chorions. Continue until the majority of embryos are released from their chorions.
NOTE: Make sure the naked embryos are always submerged in solution; otherwise, the yolk sac may rupture, resulting in the embryos' death. - Once dechorionation is achieved, wash the embryos thoroughly by transferring them through 5–6 changes of fresh E3 medium.
NOTE: Make sure the naked embryos are always submerged in solution; otherwise, the yolk sac may rupture, resulting in the embryos' death. - Ensure that all chorions and pronase residues are removed to prevent damage to the larvae and to maintain optimal culture conditions.
- Transfer ~50 dechorionated larvae into a 100 mm Petri dish containing 40 mL of E3 medium using a glass Pasteur pipette.
- Maintain the larvae in these conditions until they are microinjected.
6. Injecting zebrafish embryos
- Under a stereomicroscope (≥150× magnification), use fine forceps to carefully break the tip of the pulled glass capillary (section 1), generating a micropipette with an opening of approximately 3 µm in diameter.
NOTE: A suitable micropipette can be recognized by ensuring the tip is finely opened, without visible flattening or a large open surface at the tip. If the tip is broken too widely, it will not penetrate the fish skin effectively and may result in poor or inconsistent injections. Therefore, tip opening should be performed carefully under a stereomicroscope at high magnification, ensuring a minimal, controlled break at the very end of the capillary. - Prepare injection solutions of 0.9% (w/v) NaCl (control) or IL-6 (2 pg/nL) in 0.9% NaCl and add 1 µL of 0.1% trypan blue to every 10 µL of solution to facilitate visualization during injection.
- Backfill the prepared micropipette with ~3 µL of the injection solution using a microloader tip, ensuring no air bubbles are introduced.
- Secure the loaded micropipette into the capillary holder (Figure 2) connected to the microinjection system.
- Place a small drop of mineral oil onto a calibration slide.
- Calibrate the injection volume by expelling droplets into the mineral oil and measuring their diameter using a calibration slide (Figure 2) with a 0.01 mm scale. Adjust injection pressure (between 300–500 hPa) to achieve a droplet volume of ~1 nL.
- Add tricaine (MS-222) to the E3 medium containing larvae to a final concentration of 1× for anesthesia. To minimize stress and ensure consistent sedation, use larvae in small batches.
- Transfer individual 2 dpf larvae onto a solidified agarose injection plate. Multiple larvae (e.g., up to 10) may be positioned per dish, depending on handling capacity.
- Place the dish under the stereomicroscope. Using a glass pipette, gently orient each larva such that the duct of Cuvier is clearly visible and accessible.
NOTE: When working with multiple larvae, ensure that the agarose surface remains hydrated by periodically adding drops of E3 medium containing tricaine (1×) to prevent desiccation. - Position the micropipette tip at the entry point of the duct of Cuvier (as shown in Figure 3), identifiable by tracking the blood cells moving toward the heart under the stereomicroscope.
- Inject two consecutive droplets (~1 nL each) of the prepared solution into the duct of Cuvier, with an interval of approximately 20 s between injections to allow proper distribution.
- Following injection, gently transfer the larvae from the agarose plate into a fresh 100 mm Petri dish containing 40 mL of E3 medium. Minimize mechanical stress during transfer.
- Return the larvae to the incubator at 28.5 °C for recovery.
- On the following day (3 dpf), repeat the microinjection procedure as described in steps 6.8–6.13.
NOTE: A single injection produces only short‑lived signaling and no consistent behavioral response, whereas the second injection ensures sustained activation of inflammatory pathways across the early‑larval developmental window relevant for neurodevelopment and produces behavioral changes as described in the Representative results section. - At 5 dpf, use the larvae for downstream applications, including behavioral assays, brain imaging, or immunofluorescence analysis.
Results
To evaluate the effects of IL‑6 microinjection on larval physiology and behavior, we compared IL‑6-injected larvae with NaCl‑injected controls across survival and two behavioral readouts commonly used to assess anxiety‑like and repetitive behaviors in zebrafish. IL‑6 microinjection did not affect larval viability compared to NaCl-injections (Figure 4A). Survival rates at 5 dpf were indistinguishable between IL‑6-injected and NaCl‑injected groups, indicating that the dosing regimen is well tolerated and does not introduce nonspecific toxicity. Microinjections themselves slightly reduced viability compared to uninjected siblings, indicating a modest handling‑related impact independent of IL‑6 exposure. This confirms that the protocol is suitable for downstream behavioral analyses.
To validate that the IL‑6 microinjection paradigm induces a measurable inflammatory response at 5 dpf, we quantified prostaglandin E2 (PGE2), a downstream mediator of cytokine‑driven inflammatory signaling25. The tsc2-/- homozygous mutants displayed elevated baseline PGE2 levels even without IL‑6 injection, significantly higher than their wild‑type (WT) tsc2+/+ siblings (Figure 4B). Heterozygous tsc2+/- mutants showed a modest, non‑significant increase in baseline PGE2 compared with WT larvae, but importantly, their PGE2 levels rose sharply following IL‑6 microinjection. This pattern is consistent with our goal of modeling gene × environment interactions: WT larvae remain largely unaffected by mild, transient IL‑6 exposure, whereas genetically susceptible tsc2+/- mutants exhibit a pronounced inflammatory response.
In line with these genotype‑dependent differences in inflammatory tone, we next examined whether IL‑6–induced signaling translated into measurable behavioral changes in the open‑field assay. Open‑field test at 5 dpf (as previously described22) revealed that tsc2 mutant larvae displayed increased anxiety‑like behavior compared with WT siblings (Figure 4C); however, microinjections of IL6 did not affect this behavior. Specifically, tsc2+/- and tsc2-/- larvae spent significantly more time in the outer zone of the arena and exhibited reduced center exploration compared to tsc2+/+, consistent with established anxiety‑related phenotypes in zebrafish larvae.
IL‑6 injections increased repetitive, stereotyped swimming patterns, particularly in tsc2+/- mutant larvae (Figure 4D–E), a behavioral feature commonly used as an ASD‑relevant readout in zebrafish models26. Detailed quantification of repetitive looping, defined as three or more consecutive circular swims, revealed a significant increase in the proportion of IL‑6-injected tsc2+/- mutants exhibiting this behavior compared with NaCl‑injected controls. This selective enhancement of repetitive swimming in genetically susceptible larvae further supports a gene × environment interaction, in which mild inflammatory stimulation unmasks or amplifies ASD‑like behavioral tendencies specifically in the tsc2+/- mutant background.
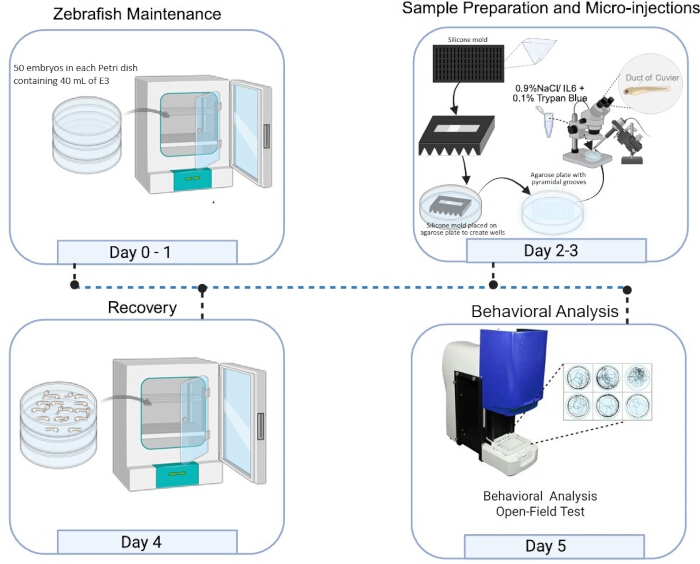
Figure 1: Schematic of the protocol. Please click here to view a larger version of this figure.
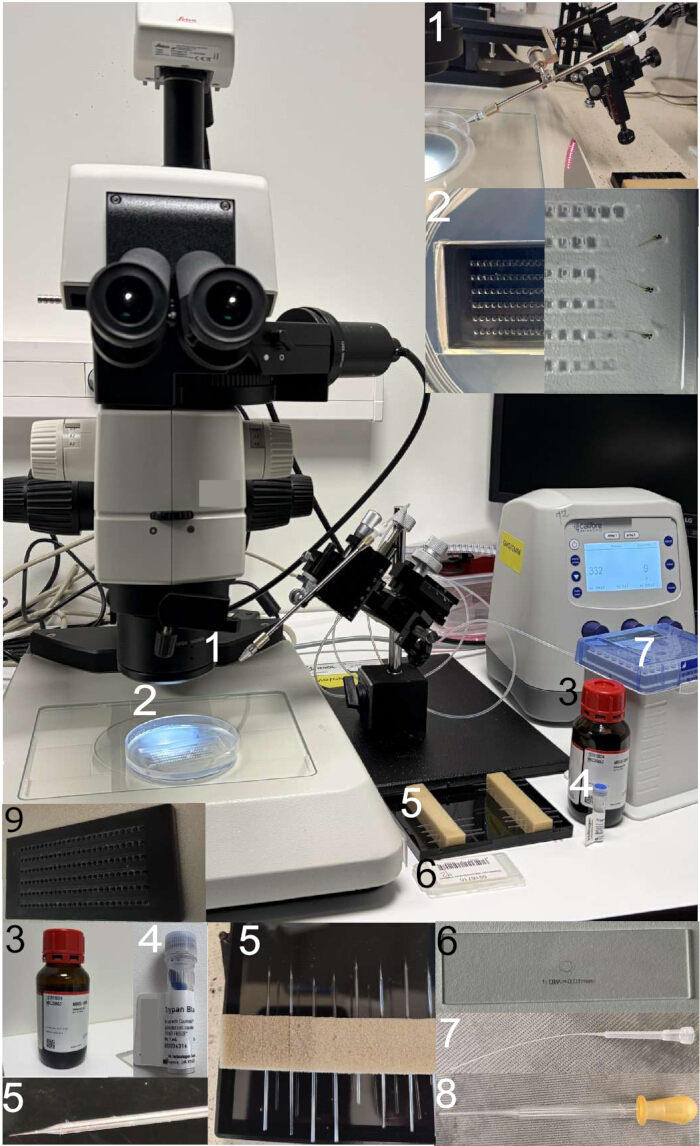
Figure 2: Microinjection workstation setup. Schematic of the microinjection workstation used for larval zebrafish injections. (1) Glass micropipette mounted on the injector holder; (2) agarose-coated Petri dish with molded wells for larval positioning; (3) mineral oil for calibration; (4) trypan blue solution; (5) pulled glass needles; (6) calibration slide; (7) extended pipette tips; (8) Pasteur pipette; (9) Silicone mold. Please click here to view a larger version of this figure.
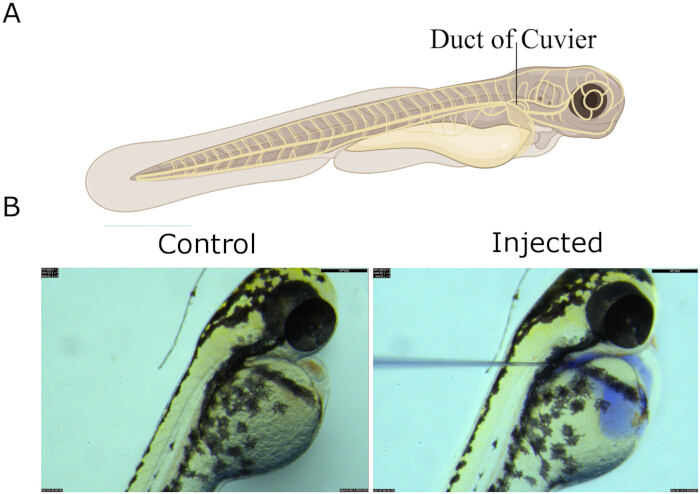
Figure 3: Injection into the duct of Cuvier. (A) Schematic representation of the duct of Cuvier (the common cardinal vein) injection site in larval zebrafish and representative open-field locomotor tracks at 5 dpf. (B) Representative images of control (un-injected), and injections with NaCl, and IL-6. Scale bar: 250 µm. Please click here to view a larger version of this figure.
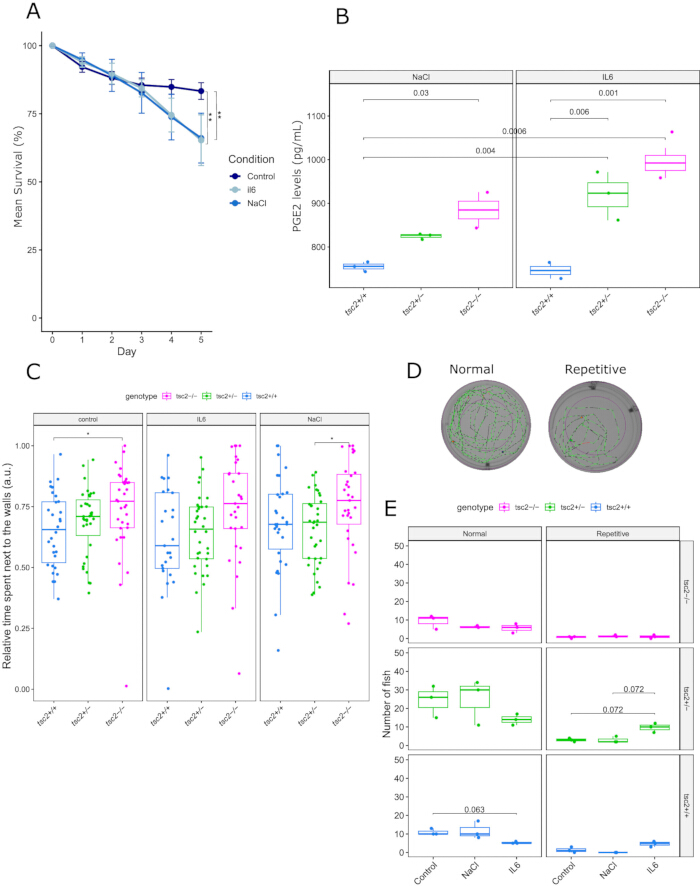
Figure 4: Representative results of gene x environment interaction using the tsc2 mutant line. (A) Survival rates (%) of tsc2vu242 larvae over the course of the experiment across control (uninjected), NaCl-injected, and IL-6-injected groups. Data are presented as mean ± SEM at 5 dpf (n = 4 independent experimental replicates, each genotype × treatment combination containing 60–70 fish). Statistical analysis was performed using ANOVA followed by Tukey post hoc test for pairwise comparison. Significant differences were observed between control and IL-6-injected groups (p = 0.00150) and between control and NaCl-injected groups (p = 0.00243). (B) Boxplots representing PGE2 levels in the tsc2 mutants and siblings, measured at 5 dpf using an enzyme-linked immunosorbent assay (ELISA) kit according to the manufacturer's protocol (2-way ANOVA for genotype: F = 7.4503; P = 0.01234). Each sample contains 20 heads (tails were used for genotyping). Dots in the boxplots represent biological replicates. (C) Boxplots of the results of the open-field test for tsc2 mutant fish showing relative time spent next to the walls for each genotype after injections with NaCl and IL-6 and for uninjected controls (2-way ANOVA for genotype: F = 7.021; P = 0.00106). The open-field test was performed using an automated analysis chamber (Table of Materials) according to the protocol reported previously22. (D) Exemplary figure showing random exploratory behavior after NaCl injection and repetitive looping after IL-6 injections. (E) Boxplots representing the number of animals showing normal and repetitive looping behaviors for each tsc2 genotype after injection with NaCl or IL-6 and for uninjected control fish (2-way ANOVA for genotype: F = 5.7615; P = 0.005849). Three independent experimental replicates, each genotype × treatment combination containing 60–70 fish were used for this. Please click here to view a larger version of this figure.
| 60 x E3 stock solution | ||
| Reagent | Final concentration | Amount |
| NaCl | 297 mM | 17.4 g |
| KCl | 10.7 mM | 0.8 g |
| CaCl2 | 19.6 mM | 2.18 g |
| MgCl2·6H2O | 24 mM | 4.89 g |
| Ultrapure H2O | N/A | fill up to 1 L |
| Total | N/A | 1 L |
| Tricaine stock solution | ||
| Reagent | Final concentration | Amount |
| Tricaine | 15.3 mM | 1 g |
| 1 M Tris-HCl pH 9 | 21 mM | 5.25 mL |
| Ultrapure H2O | N/A | 244.75 mL |
| Total | N/A | 250 mL |
Table 1: Composition of E3 and Tricaine solutions.
Discussion
As expected, tsc2 homozygous mutants displayed high baseline levels of anxiety‑like, consistent with previously reported phenotypes22,27. Because these larvae already exhibit severe behavioral abnormalities, IL‑6 injection did not further exacerbate their phenotype. In contrast, tsc2 heterozygotes showed clear IL‑6-induced changes. This selective sensitivity highlights the utility of this protocol for probing gene × environment interactions, where mild but prolonged inflammatory signaling interacts with underlying genetic vulnerability to shape neurobehavioral outcomes.
LPS exposure remains the most widely used inflammation‑inducing paradigm in zebrafish and reliably produces a broad, robust immune response characterized by strong induction of pro‑inflammatory cytokines, recruitment of innate immune cells, and dose‑dependent mortality28. While powerful, LPS activates multiple Toll‑like receptor pathways simultaneously28,29,30, making it difficult to isolate the contribution of individual cytokines to downstream neurodevelopmental effects. In contrast, the IL‑6 microinjection protocol described here provides a targeted and controlled approach by elevating a single cytokine known to be central in maternal immune activation. Importantly, IL‑6 injections do not increase mortality relative to NaCl‑injected controls, enabling behavioral and molecular phenotypes to be examined without confounding toxicity. Moreover, IL‑6 microinjection produces specific downstream inflammatory signaling, as demonstrated by elevated PGE2 levels, and induces measurable behavioral changes- particularly increased repetitive swimming in tsc2 heterozygous larvae - where genetic susceptibility interacts with cytokine exposure. Together, these distinctions underscore that while LPS models global immune activation, IL‑6 microinjection enables precise dissection of cytokine‑specific mechanisms relevant to neurodevelopmental risk.
The representative results presented here illustrate IL‑6 effects in a tsc2‑mutant background, but the protocol itself is broadly applicable. The method can be readily implemented in wild‑type larvae or other genetic models to investigate how defined inflammatory cues intersect with diverse genetic contexts during early neurodevelopment. For applications beyond the tsc2 model, we recommend empirically determining the optimal IL‑6 dose, as cytokine sensitivity and inflammatory thresholds may vary across genotypes and experimental aims.
A key technical consideration in this protocol is the consistency of injection volume, as the biological effects of IL‑6 depend on accurate delivery of approximately 1 nL per injection. Variability in droplet size often arises from differences in needle aperture or injection pressure. If droplets are too small, gradually increasing the pressure or slightly widening the needle tip under high magnification typically restores proper flow. Conversely, droplets that exceed the intended volume usually indicate that the needle opening is too wide, in which case reducing pressure or preparing a new needle with a narrower tip is necessary. Maintaining precise injection volumes is essential, as deviations can alter inflammatory load and compromise reproducibility. Occasionally, users may encounter situations where no solution is expelled from the needle. This is most often due to air bubbles, debris, or blockages at the needle tip. Inspecting the needle under a stereomicroscope and checking the injector system for leaks or loose connections typically resolves the issue. Ensuring a clean, unobstructed needle tip is essential for consistent delivery and for preventing pressure buildup that could damage the larvae.
Another important factor is the physiological tolerance of the injected volume. Larvae generally tolerate ~1 nL well, but larger volumes can increase mortality, particularly when multiple injections are performed across consecutive days. For experiments requiring repeated dosing, it is crucial to minimize mechanical stress, allow sufficient recovery time between injections, and adjust IL‑6 concentration rather than volume to achieve the desired dose. These considerations help ensure that observed phenotypes reflect cytokine exposure rather than injection‑related injury.
Finally, injection‑related mortality can vary widely depending on user experience. While skilled users typically achieve mortality rates near 5%, inexperienced users may observe rates as high as 50%. Most losses stem from mechanical damage during mounting, incorrect needle placement, or accidental puncture of the yolk sac or surrounding tissues. Practicing the procedure on wild‑type larvae before beginning experimental injections greatly improves consistency and reduces mortality. Proper positioning of larvae to clearly visualize the duct of Cuvier, combined with gentle handling during mounting and recovery, further minimizes procedural harm.
Disclosures
The authors have nothing to disclose.
Acknowledgements
We thank Kevin Ess and Lilianna Solnica-Krezel (Vanderbilt University) for tsc2vu242/+ fish and the IIMCB ZCF for assistance with the adult fish. This work was supported by the SONATA BIS grant no. 2023/50/E/NZ3/00252, a grant to JZ from the National Science Centre, Poland.
Materials
| Name | Company | Catalog Number | Comments |
|---|---|---|---|
| Borosilicate Glass capillaries (Outer diameter 1.0 mm/ inner diameter 0.75 mm) | Sutter Instrument | BF150-75-10 | |
| CaCl2 (calcium chloride) | Chempur | 118748703 | |
| Callibration Slide (1/100 mm) | Bresser | 5916710 | |
| Capillary holder (Grip head set 4 size 0) | Fertilart Sp. z o.o | 5196082001 | |
| Flaming/Brown micropipette puller | Sutter Instrument | P-1000 | |
| HCl | Chempur | 115752837 | |
| Human IL6 | Thermo Fischer Scientific | 200-06-20UG | Stock concentration: 10 µg/mL , Working concentration: 2 pg/nL (diluted in 0.9% NaCl) |
| Injector pump FemtoJet 4i | Eppendorf | E5252000021 | |
| KCl (potassium chloride) | Chempur | 117397402 | |
| MgCl2·6H2O (magnesium chloride hexahydrate) | Chempur | 116120500 | |
| Femtotips Microloader Tips for Femtojet Microinjector | Eppendorf | EPE 5242956003 | |
| Microscope Leica M165 FC 1983 magnification | Leica Microsysytems | https://www.leica-microsystems.com/products/ light-microscopes/stereo-microscopes/p/leica-m165-fc/ | |
| Mineral oil | Sigma-Aldrich | M5904 | |
| NaCl (sodium chloride) | Chempur | 117941206 | |
| Pronase | Sigma-Aldrich | P5147-1G | Stock concentration: 20 mg/mL (prepared in ultrapure water), Working concentration: 0.5 mg/mL (diluted in E3) |
| Tricaine | Sigma-Aldrich/Merck | A-5040 | |
| Tris base | Carl Roth | 4855.3 | |
| Trypan Blue | Thermo Fischer Scientific | 15250061 | |
| UltraPure Low Melting Point Agarose | Thermo Fischer Scientific | 16520050 | |
| ZebraBox extension - Photo Motor Response EZBPMR | Animalab | https://animalab.eu/zebrabox-high-throughput-monitoring-system | |
| Zebrabox | ViewPoint | https://www.viewpoint.fr/product/zebrafish/fish-behavior-monitoring/zebrabox | Automated analysis chamber |
References
- Winden, K., et al. Tuberous sclerosis complex. Nat Rev Dis Primers. 12, 11(2026).
- Ramani, R., et al. The clinical interface of tuberous sclerosis complex and autism spectrum disorder: insights and future directions. Neurol Sci. 46 (6), 2571-2580 (2025).
- Lyall, K., et al. The changing epidemiology of autism spectrum disorders. Annu Rev Public Health. 38, 81-102 (2017).
- Nazeer, A., Ghaziuddin, M. Autism spectrum disorders: clinical features and diagnosis. Pediatr Clin North Am. 59, 19-25 (2012).
- Kern, J. K., Geier, D. A., Sykes, L. K., Geier, M. R. Relevance of neuroinflammation and encephalitis in autism. Front Cell Neurosci. 9, 519(2016).
- Careaga, M., Murai, T., Bauman, M. D. Maternal immune activation and autism spectrum disorder: from rodents to nonhuman and human primates. Biol Psychiatry. 81 (5), 391-401 (2017).
- Croonenberghs, J., Bosmans, E., Deboutte, D., Kenis, G., Maes, M. Activation of the inflammatory response system in autism. Neuropsychobiology. 45, 1-6 (2002).
- Girgis, R. R., Kumar, S. S., Brown, A. S. The cytokine model of schizophrenia: emerging therapeutic strategies. Biol Psychiatry. 75 (4), 292-299 (2014).
- Heuer, L. S., et al. An exploratory examination of neonatal cytokines and chemokines as predictors of autism risk: the early markers for autism study. Biol Psychiatry. 86 (4), 255-264 (2019).
- Sasayama, D., et al. Negative correlation between serum cytokine levels and cognitive abilities in children with autism spectrum disorder. J Intell. 5 (2), 19(2017).
- Banks, W. A., Kastin, A. J., Gutierrez, E. G. Penetration of interleukin-6 across the murine blood-brain barrier. Neurosci Lett. 179 (1-2), 53-56 (1994).
- Otkıran, G., Erdoğan, M. A., Uyanıkgil, Y., Erbaş, O. Prenatal interferon-alpha exposure induces autism-like neurobehavioral and neurochemical alterations in male offspring. J Neuroimmune Pharmacol. 21, 4(2026).
- Smith, S. E. P., Li, J., Garbett, K., Mirnics, K., Patterson, P. H. Maternal immune activation alters fetal brain development through interleukin-6. J Neurosci. 27 (40), 10695-10702 (2007).
- Bedell, V. M., Meng, Q. C., Pack, M. A., Eckenhoff, R. G. A vertebrate model to reveal neural substrates underlying the transitions between conscious and unconscious states. Sci Rep. 10, 15789(2020).
- Belo, M. A. A., et al. Zebrafish as a model to study inflammation: a tool for drug discovery. Biomed Pharmacother. 144, 112310(2021).
- Ka, J., Pak, B., Han, O., Lee, S., Jin, S. -W. Comparison of transcriptomic changes between zebrafish and mice upon high fat diet reveals evolutionary convergence in lipid metabolism. Biochem Biophys Res Commun. 530 (4), 638-643 (2020).
- Li, Y., Hu, B. Establishment of multi-site infection model in zebrafish larvae for studying Staphylococcus aureus infectious disease. J Genet Genomics. 39 (9), 521-534 (2012).
- Nicoli, S., Ribatti, D., Cotelli, F., Presta, M. Mammalian tumor xenografts induce neovascularization in zebrafish embryos. Cancer Res. 67 (7), 2927-2931 (2007).
- Cao, Z., et al. Carboxyl graphene oxide nanoparticles induce neurodevelopmental defects and locomotor disorders in zebrafish larvae. Chemosphere. 270, 128611(2021).
- Martini, D., Pucci, C., Gabellini, C., Pellegrino, M., Andreazzoli, M. Exposure to the natural alkaloid berberine affects cardiovascular system morphogenesis and functionality during zebrafish development. Sci Rep. 10, 17358(2020).
- Sun, M., et al. Robotic cardinal vein microinjection of zebrafish larvae based on 3D positioning. 2021 IEEE International Conference on Robotics and Automation (ICRA), Xi'an, China, , (2021).
- Kedra, M., et al. TrkB hyperactivity contributes to brain dysconnectivity, epileptogenesis, and anxiety in zebrafish model of tuberous sclerosis complex. Proc Natl Acad Sci U S A. 117 (4), 2170-2179 (2020).
- Kim, S. -H., Speirs, C. K., Solnica-Krezel, L., Ess, K. C. Zebrafish model of tuberous sclerosis complex reveals cell-autonomous and non-cell-autonomous functions of mutant tuberin. Dis Model Mech. 4 (2), 255-267 (2011).
- Konadu, B., Cox, C. K., Gibert, Y. Protocol for the microinjection of free fatty acids and triacylglycerol in zebrafish embryos. STAR Protoc. 5 (2), 103086(2024).
- Evans, S. S., Repasky, E. A., Fisher, D. T. Fever and the thermal regulation of immunity: the immune system feels the heat. Nat Rev Immunol. 15 (6), 335-349 (2015).
- Zabegalov, K. N., et al. Abnormal repetitive behaviors in zebrafish and their relevance to human brain disorders. Behav Brain Res. 367, 101-110 (2019).
- Scheldeman, C., et al. mTOR-related neuropathology in mutant tsc2 zebrafish: phenotypic, transcriptomic and pharmacological analysis. Neurobiol Dis. 108, 225-237 (2017).
- Ilyin, N. P., et al. Effects of intracerebroventricular lipopolysaccharide administration on behavioral, neurochemical, and neurogenomic responses in adult zebrafish. Behav Brain Res. 493, 115676(2025).
- Luo, R., Yao, Y., Chen, Z., Sun, X. An examination of the LPS-TLR4 immune response through the analysis of molecular structures and protein-protein interactions. Cell Commun Signal. 23, 142(2025).
- Grebennikova, D. V., Shandilya, U. K., Karrow, N. A. Beyond TLR4 and its alternative lipopolysaccharide (LPS) sensing pathways in zebrafish. Genes. 16 (9), 1014(2025).
Reprints and Permissions
