This protocol describes a fully integrated microfluidic chip-based LAMP method enabling point-of-care detection of 15 pathogens causing lower respiratory tract infections in ICU patients within one hour.
Method Article
Rapid Point-of-Care Detection of Pathogens for Lower Respiratory Tract Infections in ICU Patients
* These authors contributed equally
In This Article
Summary
Abstract
Lower respiratory tract infections (LRTIs) are among the leading causes of clinical deterioration and death in critically ill patients. In the intensive care unit (ICU), timely identification of the causative pathogen is essential for appropriate antimicrobial therapy; however, conventional culture methods take 3 to 5 days and have suboptimal positivity rates, particularly for fungi. Molecular approaches such as PCR shorten turnaround time but still depend on manual nucleic acid extraction and thermocycling, limiting their suitability for bedside use. This protocol describes a point-of-care workflow built around a fully integrated, disc-shaped microfluidic chip (CD chip) that couples magnetic bead-based nucleic acid purification with loop-mediated isothermal amplification (LAMP). After a simplified manual liquefaction and lysis step, the processed specimen is loaded onto the chip together with two prepackaged reagent vials. The instrument then autonomously performs extraction, amplification at 65 °C, and real-time fluorescence readout, returning qualitative results for 15 targets, namely 11 bacteria, 3 fungi, and 1 atypical pathogen, within 45 min of instrument run time (approximately 1 h for the complete sample-to-answer workflow, including the manual preprocessing step). We present detection data from 10 ICU specimens, including sputum, bronchial aspirates, and bronchoalveolar lavage fluid, encompassing both single-pathogen and polymicrobial co-infections involving up to 7 organisms on a single chip. The closed cartridge design minimizes the risk of aerosol contamination, and the single loading step requires no specialized training, positioning this system as a practical bedside diagnostic tool for ICU teams.
Introduction
Among critically ill patients in the ICU, lower respiratory tract infections, with ventilator-associated pneumonia (VAP) being chief among them, remain a persistent driver of morbidity, prolonged mechanical ventilation, and excess mortality1,2. The microbiological landscape of ICU-acquired lower respiratory tract infections (LRTIs) differs markedly from that of community-acquired disease. Multidrug-resistant Gram-negatives (Klebsiella pneumoniae, Pseudomonas aeruginosa, Acinetobacter baumannii) predominate, often in polymicrobial constellations that confound empirical regimens3,4. Opportunistic fungi add a further layer of complexity. Invasive pulmonary aspergillosis, once considered a hallmark of profound immunosuppression, is now recognized with increasing frequency in non-neutropenic ICU patients, most notably after severe influenza and COVID-195. Existing diagnostic algorithms for aspergillosis couple low-yield culture with galactomannan (GM) antigen testing, yet the GM assay is constrained by well-documented diagnostic windows and variable sensitivity in non-neutropenic hosts6. Each hour of delay in initiating appropriate antimicrobial therapy for sepsis is associated with a measurable increase in mortality7. Taken together, the speed and complexity of ICU infections demand diagnostic tools that can match clinical urgency.
Standard microbiological culture, while indispensable for susceptibility testing, is fundamentally rate-limited: turnaround spans 3 to 5 days, fastidious organisms are missed, and fungal culture positivity remains low8. Metagenomic next-generation sequencing (mNGS) offers an unbiased alternative, yet its clinical adoption is tempered by cost, processing times of 24 to 48 hours, reliance on bioinformatics pipelines, and limited point-of-care feasibility9. PCR-based panels have narrowed the time gap, but they still require multi-step nucleic acid extraction, thermal cycling instrumentation, and, for conventional formats, post-amplification electrophoresis10. None of these platforms fully satisfies the convergent demands of the ICU: speed of less than one hour, minimal hands-on time, multiplexed pathogen coverage including fungi, and operational simplicity sufficient for non-laboratory personnel.
Loop-mediated isothermal amplification (LAMP) addresses several of these constraints. First described by Notomi et al., the method amplifies target DNA at a constant 65 °C using a set of four to six primers that recognize six distinct regions, driven by a strand-displacing polymerase11. The reaction generates characteristic stem-loop and cauliflower-like amplicon structures detectable via real-time fluorescence, yielding S-shaped curves within minutes of threshold crossing. Sensitivity at low template concentrations is high, and the multi-primer design confers selectivity that limits false positives12,13. When coupled with microfluidic chip platforms, LAMP can be parallelized across multiple targets from a single specimen load14. Earlier work demonstrated that LAMP chip systems detect respiratory pathogens with turnaround well under three hours15. A key limitation of those systems, however, is their dependence on separate, manual DNA extraction, which adds time, operational complexity, and contamination risk.
The system described here eliminates that bottleneck. Built around a single-use, disc-shaped microfluidic chip (86 mm in diameter), it integrates sample loading, magnetic-bead-based nucleic acid purification, and 16-plex LAMP amplification in a single sealed cartridge (Figure 1). The operator performs only a brief manual liquefaction-lysis step using a purpose-designed processing tube, then loads the lysate and two reagent vials onto the chip (Figure 2). From that point forward, the instrument handles extraction, isothermal amplification at 65 °C, and fluorescence acquisition autonomously, delivering qualitative calls for 15 clinically relevant targets, namely 11 bacteria, 3 fungi (Aspergillus spp., Candida albicans, Pneumocystis jirovecii), and 1 atypical pathogen (Mycoplasma pneumoniae), within 45 min. A neuroblastoma breakpoint family (NBPF) gene used as an internal control validates specimen adequacy and reaction integrity in each assay. This protocol provides step-by-step instructions for the complete workflow, from ICU specimen collection through preprocessing, chip loading, automated detection, and result interpretation, intended for both clinical laboratory staff and ICU bedside teams.
Protocol
All samples were collected under a protocol approved by the Ethics Review Committee of Peking Union Medical College Hospital, Chinese Academy of Medical Sciences (Approval No. I-24PJ1778). Written informed consent was obtained from each participant or their legally authorized representative prior to specimen collection. The target pathogen panel and reaction-well assignments are listed in Table 1, and the consumables used during sample preprocessing are listed in Table 2.
1. Collection of clinical samples from the lower respiratory tract in the ICU
- Sputum collection
- Rinse the oral cavity with clean water or sterile physiological saline three times to clear food residue and commensal oral flora.
- Instruct the patient to take two to three deep breaths, then cough forcefully to expel deep respiratory sputum directly into a sterile collection cup.
NOTE: An acceptable specimen consists of viscous, purulent, or blood-streaked material from below the trachea; clear saliva or postnasal drip is inadequate and may compromise downstream detection.
- Bronchial aspirate (BAS) collection
- For non-intubated patients, insert a sterile suction catheter (a 10–12 Fr catheter, with the suction source set to a pressure of −0.0267 MPa, equivalent to −200 mmHg) through the nasal or oral route to a depth of approximately 30 cm.
- Apply suction while rotating the catheter and withdraw the catheter slowly. Collect the aspirated secretions in a sterile specimen trap.
NOTE: If secretions are scant, instill approximately 5 mL of sterile saline via the catheter before suctioning. - For mechanically ventilated patients, select the suction catheter according to the endotracheal tube size: use a 10 Fr catheter for a 7.0–7.5 mm tube and a 12 Fr catheter for an 8.0 mm tube.
- Pre-oxygenate the patient with 100% oxygen for 30–60 s before suctioning. Disconnect the ventilator circuit and insert the selected catheter through the artificial airway until resistance is encountered.
- Apply a negative pressure of −0.0267 MPa (equivalent to −200 mmHg), limiting each suction pass, and thus the ventilator-disconnection time, to no more than 15 s to minimize derecruitment and hypoxemia, and re-oxygenate the patient with 100% oxygen for 30–60 s after suctioning.
- Instill 1–2 mL sterile saline through the catheter and wait for 3 s.
- Apply suction and withdraw the catheter. Collect the aspirated secretions in a sterile specimen trap. Reconnect the ventilator circuit immediately after specimen collection.
NOTE: Strict aseptic technique is essential throughout to avoid nosocomial contamination of the specimen.
- Bronchoalveolar lavage fluid (BALF) collection
- Identify the target segment on chest imaging. Advance the bronchoscope and wedge it into the appropriate segmental or subsegmental bronchus.
- Instill 20–50 mL aliquots of sterile saline rapidly, for 3–5 aliquots (60–120 mL total). Apply gentle suction after each aliquot, then collect the recovered fluid in a sterile, sealed container.
CAUTION: Continuous hemodynamic and ventilatory monitoring is mandatory during BAL in ICU patients. Adjust ventilator settings as needed for mechanically ventilated subjects.
NOTE: Typical recovery is 40–60% of the instilled volume. Poor return may necessitate repositioning the bronchoscope tip.
2. Liquefaction and pathogen lysis
- Using the #2 disposable pipette, aspirate the specimen to the marked line (approximately 1 mL) and dispense it into the liquefaction tube. Squeeze the pipette bulb repeatedly to transfer all viscous material, then cap the tube.
NOTE: For BALF or watery sputum, load two pipette volumes to ensure sufficient pathogen input. - Shake the liquefaction tube vigorously by hand for 1 min. Inspect the sample visually and continue shaking until no visible mucus clumps remain and the specimen flows freely through the #1 disposable pipette without resistance (a uniform, water-like consistency). Shake for at least 1 min, extending the time as needed for highly viscous specimens until these criteria are met.
- Open the sealing cap of the lysis tube.
- Aspirate approximately 0.5 mL of the homogenized sample using the #1 disposable pipette and dispense the sample into the lysis tube.
- Close the sealing cap and verify that the tip cap is securely tightened.
- Seat the lysis tube in the Sample Preprocessing device (SP device), pressing down until it is secure. Press Start.
- Allow the SP device to complete the automated liquefaction-lysis cycle (parameters in Table 3) lasting approximately 15 min.
NOTE: Do not open or remove the tube during processing.
3. Chip loading and automated detection
- Reagent and sample loading
- Remove the CD chip from 4 °C storage and equilibrate it at room temperature (approximately 25 °C) for 10 min.
NOTE: Reagent vials O and B and the preprocessed lysate are used at room temperature; the on-chip LAMP amplification is performed at 65 °C (see step 3.2.3 and Table 3). - Open the foil pouch and place the chip on a flat surface.
- Rotate the cap counterclockwise to open the chip.
- Flick the vial O to collect the liquid at the bottom of the vial.
- Uncap the vial O, insert the nozzle into the O port, and dispense the entire contents into the port.
- Discard vial O. Repeat the procedure using vial B and the B port.
- Remove the processed lysis tube from the SP device and remove the tip cap.
- Align the tube tip with the S port and dispense the entire lysate volume into the chip.
- Discard the used lysis tube.
- Twist the chip cap clockwise until two audible clicks confirm a complete seal.
NOTE: Incomplete loading of any port may cause individual channel failures. Confirm full dispensing before sealing. To avoid incomplete sealing and contamination risks, do not wear PE gloves when sealing the cap; latex or nitrile gloves are recommended instead.
- Remove the CD chip from 4 °C storage and equilibrate it at room temperature (approximately 25 °C) for 10 min.
- Instrument operation
- Power on the automated nucleic acid analyzer. Tap Detect, scan the barcode on the chip foil pouch, and enter patient demographics and sample ID.
- Mount the chip on the rotational spindle and press down until a click confirms engagement.
- Tap Start. The instrument autonomously performs centrifugal reagent distribution, magnetic bead extraction, LAMP amplification at 65 °C, and fluorescence acquisition. Run time is approximately 45 min (the reagent/sample loading and instrument workflow are summarized in Figure 3).
NOTE: Do not open the lid during the run.
- Result interpretation
- The software identifies the inflection point of each S-shaped amplification curve by second derivative maximum analysis and reports the corresponding TP value (time to positivity).
- Compare each TP value with the corresponding threshold listed in Table 4. Classify channels with TP values at or below the threshold as positive and channels with TP values above the threshold as negative.
- Verify that the internal control channel (well 16) exhibits an S-shaped amplification curve with a TP value below 12 min.
- Reject the run if the internal control fails. Repeat testing using a fresh chip or recollect the specimen.
Results
On completion of a valid run, the instrument displayed real-time fluorescence traces for all 16 channels. Positive channels exhibited the expected S-shaped amplification kinetics with automatically annotated TP values, whereas negative channels remained at baseline. The IC channel (well 16) yielded an S-shaped curve with TP < 12 min in all valid runs.
As a pilot, proof-of-concept demonstration of the protocol, 10 representative specimens were selected to illustrate the range of clinical scenarios encountered in ICU practice, including 6 bronchial aspirates (BAS), 2 bronchoalveolar lavage fluid (BALF) specimens, and 2 deep sputum (Spt) specimens. These specimens were deliberately chosen to span monomicrobial and complex polymicrobial cases rather than to estimate pathogen prevalence; 8 of the 10 were polymicrobial (2 to 7 targets each), and 2 were monomicrobial. Full TP data are presented in Table 5, and representative amplification curves are shown in Figure 4.
At one end of the complexity spectrum, sample S1 (BAS) produced a single positive signal for Aspergillus spp. (TP = 8 min), whereas all bacterial channels remained negative. This pattern was consistent with isolated invasive aspergillosis, a diagnosis that conventional culture frequently fails to detect promptly. Sample S10 (Spt) similarly yielded a single positive result for Streptococcus pneumoniae (TP = 5.5 min). These findings demonstrated the assay's ability to identify monomicrobial infections against a background of 15 pathogen targets.
Polymicrobial infections were observed in the remaining specimens, consistent with the epidemiology of respiratory infections in ICU patients. Samples S2–S5 each contained Aspergillus spp. together with one or more bacterial pathogens and, in two specimens, Candida albicans. The most complex specimen, S5 (BALF), generated seven simultaneous positive signals, including Aspergillus spp., Burkholderia cepacia, Corynebacterium striatum, Escherichia coli, Pseudomonas aeruginosa, Staphylococcus aureus, and Stenotrophomonas maltophilia. These results demonstrated the 16-well microfluidic chip's multiplex detection capability under clinical testing conditions.
Samples S6–S9, which contained bacterial co-infections without fungal involvement, ranged from dual-pathogen detection (S6: B. cepacia and E. coli) to quadruple-pathogen detection (S8: Acinetobacter baumannii, B. cepacia, Klebsiella pneumoniae, and S. maltophilia). Across all 10 specimens, TP values for positive channels ranged from 3.5–9 min, and all internal control channels met the predefined validity criterion of TP < 12 min.
For this pilot set, the chip results were compared with two reference methods performed in parallel on the same 10 specimens: targeted metagenomic next-generation sequencing (tNGS) and conventional sputum culture. Per-target concordance for the 15 pathogen channels is summarized in Table 6. Relative to tNGS, the assay showed 100% positive percent agreement (PPA) and 100% negative percent agreement (NPA) across all targets in these specimens. Relative to sputum culture, PPA was 100% for every culture-positive target, whereas NPA ranged from 44.4% to 100%; the lower NPA values reflected targets detected by the chip (and by tNGS) but not recovered in culture, consistent with the higher analytical sensitivity of nucleic acid amplification relative to culture rather than with false positivity. Given the small, deliberately selected sample, these figures are descriptive concordance estimates for the pilot cohort and are not intended as formal diagnostic-accuracy measures. Because tNGS is itself a nucleic acid-based method, agreement with tNGS confirms concordance at the nucleic acid level rather than establishing the clinical status of each organism; neither method, on its own, distinguishes true infection from colonization.
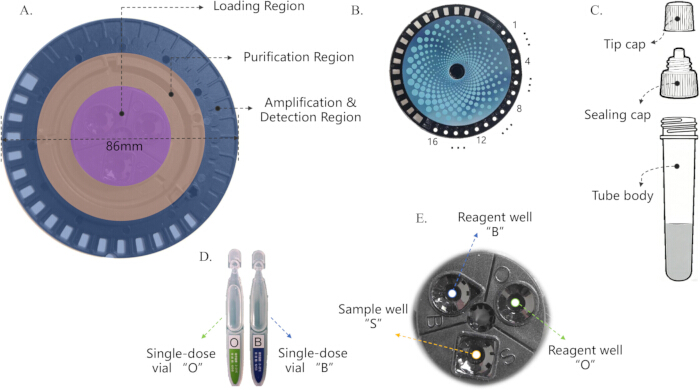
Figure 1: Microfluidic chip architecture and associated consumables. (A) Overview of the 86 mm disc chip, showing three concentric zones: a loading region, an intermediate magnetic-bead purification region, and an outer amplification and detection region. (B) Outer amplification ring housing the 16 reaction wells (positions 1, 4, 8, 12, and 16 indicated). (C) Lysis tube components (tip cap, sealing cap, and tube body). (D) Single-dose reagent vials "O" and "B." (E) Loading region showing sample well "S" and reagent wells "O" and "B." Abbreviations: O = reagent O; B = reagent B; S = sample. Please click here to view a larger version of this figure.
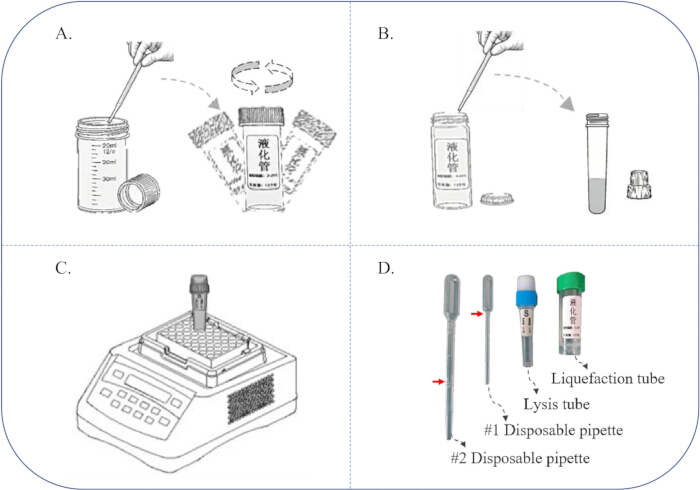
Figure 2: Preprocessing kit and sample preprocessing workflow. (A) The specimen is transferred into the liquefaction tube and homogenized by manual shaking. (B) The homogenized specimen is transferred from the liquefaction tube into the lysis tube. (C) The lysis tube is seated in the sample preprocessing (SP) device for the automated liquefaction-lysis cycle. (D) Preprocessing consumables: the #1 and #2 disposable pipettes (red arrows indicate the sample-loading marks), the lysis tube, and the liquefaction tube. Abbreviation: SP = Sample preprocessing. Please click here to view a larger version of this figure.
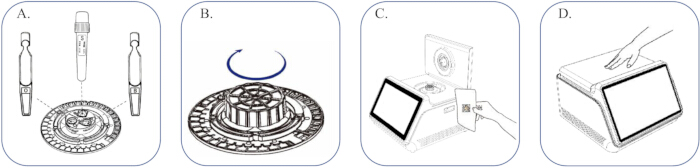
Figure 3: Chip loading and automated detection workflow. (A) Reagent vial O, reagent vial B, and the processed sample are loaded into the corresponding chip ports (O, B, and S). (B) The chip is assembled and sealed. (C) The chip is mounted on the automated nucleic acid analyzer, and the barcode is scanned. (D) The run is initiated from the touchscreen, after which nucleic acid extraction, amplification, and fluorescence detection proceed automatically. Please click here to view a larger version of this figure.
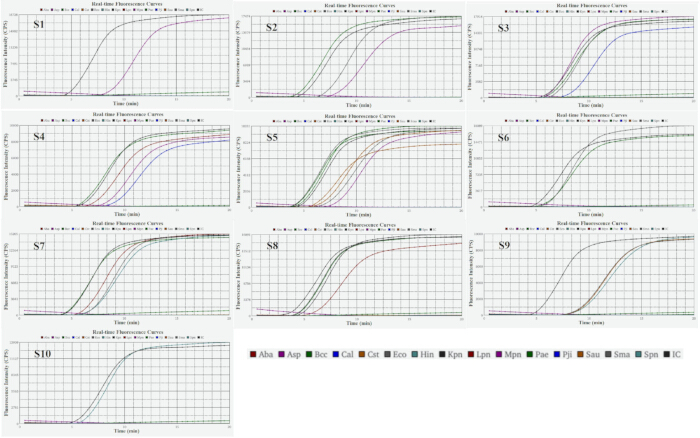
Figure 4: Representative amplification curves obtained from 10 lower respiratory tract specimens collected from ICU patients. Each panel represents a single specimen (S1–S10). S-shaped amplification curves indicate positive targets with annotated TP values, whereas flat traces indicate negative targets. Specimen S1 contained only Aspergillus spp.; specimens S2–S5 contained Aspergillus spp. together with bacterial pathogens and/or Candida albicans; specimens S6–S9 contained polymicrobial bacterial infections; and specimen S10 contained only Streptococcus pneumoniae. Corresponding TP values are provided in Table 5. Abbreviations: Aba = Acinetobacter baumannii; Asp = Aspergillus spp.; Bcc = Burkholderia cepacia; Cal = Candida albicans; Cst = Corynebacterium striatum; Eco = Escherichia coli; Hin = Haemophilus influenzae; IC = internal control; Kpn = Klebsiella pneumoniae; Lpn = Legionella pneumophila; Mpn = Mycoplasma pneumoniae; Pae = Pseudomonas aeruginosa; Pji = Pneumocystis jirovecii; Sau = Staphylococcus aureus; Sma = Stenotrophomonas maltophilia; Spn = Streptococcus pneumoniae. Please click here to view a larger version of this figure.
| Well | Target | Abbreviation | Category | Type |
| 1 | Acinetobacter baumannii | Aba | Bacteria | Bacterium |
| 2 | Aspergillus spp. | Asp | Fungi | Fungus |
| 3 | Burkholderia cepacia | Bcc | Bacteria | Bacterium |
| 4 | Candida albicans | Cal | Fungi | Fungus |
| 5 | Corynebacterium striatum | Cst | Bacteria | Bacterium |
| 6 | Escherichia coli | Eco | Bacteria | Bacterium |
| 7 | Haemophilus influenzae | Hin | Bacteria | Bacterium |
| 8 | Klebsiella pneumoniae | Kpn | Bacteria | Bacterium |
| 9 | Legionella pneumophila | Lpn | Bacteria | Bacterium |
| 10 | Mycoplasma pneumoniae | Mpn | Atypical | Atypical bacterium |
| 11 | Pseudomonas aeruginosa | Pae | Bacteria | Bacterium |
| 12 | Pneumocystis jirovecii | Pji | Fungi | Fungus |
| 13 | Staphylococcus aureus | Sau | Bacteria | Bacterium |
| 14 | Stenotrophomonas maltophilia | Sma | Bacteria | Bacterium |
| 15 | Streptococcus pneumoniae | Spn | Bacteria | Bacterium |
| 16 | NBPF (internal control) | IC | internal control | Internal control |
Table 1: Target pathogen panel and reaction well assignments.
| Consumable | Specification / volume | Function |
| Liquefaction tube | 2 mL/tube | Receives specimen; manual homogenization |
| Lysis tube | 0.5 mL/tube | Compressible silicone body with 200 µm filter membrane; preloaded lysis reagents |
| #1 disposable pipette | 0.5 mL | Transfers homogenized specimen into lysis tube |
| #2 disposable pipette | 2 mL | Aspirates specimen to marked line into liquefaction tube |
Table 2: Specifications of consumables used during sample preprocessing.
| Step | Temperature | Duration |
| Liquefaction | 50 °C | 10 min |
| Pathogen lysis | 95 °C | 5 min |
| Total cycle | — | ~15 min |
Table 3: Operating parameters of the sample preprocessing (SP) device cycle.
| Target | TP threshold (min) | Classification rule |
| Acinetobacter baumannii | 13 | TP ≤ threshold = positive |
| Aspergillus spp. | 15.5 | TP ≤ threshold = positive |
| Burkholderia cepacia | 12.5 | TP ≤ threshold = positive |
| Candida albicans | 13.5 | TP ≤ threshold = positive |
| Corynebacterium striatum | 13 | TP ≤ threshold = positive |
| Escherichia coli | 12 | TP ≤ threshold = positive |
| Haemophilus influenzae | 13.5 | TP ≤ threshold = positive |
| Klebsiella pneumoniae | 15.5 | TP ≤ threshold = positive |
| Legionella pneumophila | 14.5 | TP ≤ threshold = positive |
| Mycoplasma pneumoniae | 14 | TP ≤ threshold = positive |
| Pseudomonas aeruginosa | 12 | TP ≤ threshold = positive |
| Pneumocystis jirovecii | 14.5 | TP ≤ threshold = positive |
| Staphylococcus aureus | 15.5 | TP ≤ threshold = positive |
| Stenotrophomonas maltophilia | 12 | TP ≤ threshold = positive |
| Streptococcus pneumoniae | 14.5 | TP ≤ threshold = positive |
| NBPF (internal control) | 12 | Run valid if TP < 12 min |
Table 4: TP threshold values used for target classification.
| Specimen | Type | Detected target | TP (min) | Culture / tNGS (reads) |
| S1 | BAS | Aspergillus spp. | 8 | + / 1,253 |
| S2 | BAS | Aspergillus spp. | 7.5 | – / 3,877 |
| Pseudomonas aeruginosa | 4 | + / 55,039 | ||
| Stenotrophomonas maltophilia | 6.5 | – / 3,087 | ||
| S3 | BAS | Aspergillus spp. | 5.5 | + / 6,145 |
| Burkholderia cepacia | 6 | – / 3,221 | ||
| Candida albicans | 7.5 | – / 3,280 | ||
| Stenotrophomonas maltophilia | 6 | + / 13,189 | ||
| S4 | BALF | Acinetobacter baumannii | 6.5 | + / 10,485 |
| Aspergillus spp. | 7.5 | – / 4,432 | ||
| Burkholderia cepacia | 5.5 | – / 1,676 | ||
| Candida albicans | 8.5 | – / 576 | ||
| S5 | BALF | Aspergillus spp. | 7.5 | + / 2,869 |
| Burkholderia cepacia | 4 | – / 6,532 | ||
| Corynebacterium striatum | 5.5 | – / 71,839 | ||
| Escherichia coli | 7 | – / 1,891 | ||
| Pseudomonas aeruginosa | 4 | + / 31,386 | ||
| Staphylococcus aureus | 6.5 | – / 26,683 | ||
| Stenotrophomonas maltophilia | 4 | + / 21,467 | ||
| S6 | BAS | Burkholderia cepacia | 5.5 | – / 1,984 |
| Escherichia coli | 5.5 | + / 8,005 | ||
| S7 | BAS | Acinetobacter baumannii | 5.5 | + / 28,007 |
| Burkholderia cepacia | 4 | + / 3,585 | ||
| Haemophilus influenzae | 6.5 | – / 8,912 | ||
| Stenotrophomonas maltophilia | 6 | – / 8,865 | ||
| S8 | BAS | Acinetobacter baumannii | 5.5 | – / 43,721 |
| Burkholderia cepacia | 4 | – / 53,796 | ||
| Klebsiella pneumoniae | 3.5 | + / 23,757 | ||
| Stenotrophomonas maltophilia | 4 | – / 26,898 | ||
| S9 | Spt | Haemophilus influenzae | 9 | – / 3,636 |
| Staphylococcus aureus | 8.5 | + / 1,918 | ||
| Stenotrophomonas maltophilia | 8.5 | – / 872 | ||
| S10 | Spt | Streptococcus pneumoniae | 5.5 | – / 29,893 |
Table 5: Detection results and TP values for 10 representative lower respiratory tract specimens collected from ICU patients.
| Target | tNGS + | POCT + | tNGS − | POCT − | PPA | NPA | (SC) PPA/NPA |
| Acinetobacter baumannii | 3 | 3 | 7 | 7 | 100% | 100% | 100% / 87.5% |
| Aspergillus spp. | 5 | 5 | 5 | 5 | 100% | 100% | 100% / 71.4% |
| Burkholderia cepacia | 6 | 6 | 4 | 4 | 100% | 100% | 100% / 44.4% |
| Candida albicans | 2 | 2 | 8 | 8 | 100% | 100% | – / 80.0% |
| Corynebacterium striatum | 1 | 1 | 9 | 9 | 100% | 100% | 100% / 100% |
| Escherichia coli | 2 | 2 | 8 | 8 | 100% | 100% | 100% / 88.9% |
| Haemophilus influenzae | 2 | 2 | 8 | 8 | 100% | 100% | – / 80.0% |
| Klebsiella pneumoniae | 1 | 1 | 9 | 9 | 100% | 100% | 100% / 100% |
| Legionella pneumophila | 0 | 0 | 10 | 10 | – | 100% | – / 100% |
| Mycoplasma pneumoniae | 0 | 0 | 10 | 10 | – | 100% | – / 100% |
| Pseudomonas aeruginosa | 2 | 2 | 8 | 8 | 100% | 100% | 100% / 100% |
| Pneumocystis jirovecii | 0 | 0 | 10 | 10 | – | 100% | – / 100% |
| Staphylococcus aureus | 2 | 2 | 8 | 8 | 100% | 100% | 100% / 88.9% |
| Stenotrophomonas maltophilia | 6 | 6 | 4 | 4 | 100% | 100% | 100% / 50.0% |
| Streptococcus pneumoniae | 1 | 1 | 9 | 9 | 100% | 100% | – / 90.0% |
Table 6: Per-target concordance of the assay with targeted metagenomic next-generation sequencing (tNGS) and conventional sputum culture for the 10 representative specimens. For each of the 15 pathogen targets, the number of positive and negative results by each method and the resulting positive percent agreement (PPA) and negative percent agreement (NPA) are shown. Abbreviations: PPA = positive percent agreement; NPA = negative percent agreement; tNGS = targeted metagenomic next-generation sequencing; PPA/NPA shown as "/" where no positive (or negative) reference results were available.
| No. | Pathogen | LoD (copies/mL) |
| 1 | Acinetobacter baumannii | 1,000 |
| 2 | Aspergillus spp. | 2,000 |
| 3 | Burkholderia cepacia | 2,000 |
| 4 | Candida albicans | 1,000 |
| 5 | Corynebacterium striatum | 1,000 |
| 6 | Escherichia coli | 4,000 |
| 7 | Haemophilus influenzae | 2,000 |
| 8 | Klebsiella pneumoniae | 4,000 |
| 9 | Legionella pneumophila | 2,000 |
| 10 | Mycoplasma pneumoniae | 1,000 |
| 11 | Pseudomonas aeruginosa | 2,000 |
| 12 | Pneumocystis jirovecii | 1,000 |
| 13 | Staphylococcus aureus | 2,000 |
| 14 | Stenotrophomonas maltophilia | 2,000 |
| 15 | Streptococcus pneumoniae | 4,000 |
| 16 | Internal control (NBPF) | Not applicable (internal control) |
Table 7: Analytical limit of detection (LoD) for each panel target. LoD was determined using digital-PCR-quantified genomic nucleic acid spiked into a negative bronchoalveolar lavage fluid matrix, serially diluted and tested in triplicate, and defined as the lowest concentration detected in at least 95% of replicates. Values are expressed in copies/mL. Abbreviation: LoD = limit of detection.
| Dimension | POCT (this assay) | Sputum culture | Conventional PCR | mNGS |
| Turnaround time | ~1 h | 2–5 days | 4–8 h | > 24 h |
| Operator skill required | Low | High | High | High |
| Laboratory requirement | Low; bedside | High; bacteriology lab | High; PCR lab | High; specialized facility |
| Equipment investment | Low–moderate | Low | Moderate | High |
| Per-test cost | Moderate | Low | Moderate | High |
| Analytical sensitivity | High | Low | High | High |
| Principal advantage | Fully integrated, sample-in/result-out, no specialized operation | Reference standard; provides susceptibility | High sensitivity; quantitative | Unbiased; detects rare/unexpected pathogens; resolves difficult cases |
Table 8: Qualitative comparison of the present point-of-care assay with sputum culture, conventional PCR, and metagenomic sequencing. Methods are compared across turnaround time, operator skill requirement, laboratory infrastructure requirement, equipment investment, per-test cost, analytical sensitivity, and principal advantages. Abbreviations: POCT = point-of-care testing; PCR = polymerase chain reaction; mNGS = metagenomic next-generation sequencing.
Discussion
Rapid pathogen identification is critical in ICU infection management. The system described here reduces the time to pathogen identification from the 3 to 5 days typically required for culture to less than 1 hour, a timeframe during which first-line antimicrobial decisions are often made7. By integrating nucleic acid extraction, purification, and 16-plex LAMP amplification within a single sealed chip, this workflow eliminates the manual DNA extraction step, which has been the principal operational bottleneck of earlier LAMP chip platforms15. The result is a single loading procedure that can be performed by personnel without specialized molecular biology training.
Several procedural aspects warrant particular attention. Specimen quality is essential. Deep respiratory samples, such as bronchial aspirate or bronchoalveolar lavage fluid, are preferable to expectorated sputum in ventilated patients, in whom oropharyngeal contamination may obscure the true pathogen signal. Incomplete liquefaction is the most common cause of suboptimal lysis, and manual shaking should therefore continue until the sample has clearly reached a watery consistency. During chip loading, incomplete emptying of either the reagent vial or the lysis tube may deprive downstream wells of the required input material, resulting in channel-specific failures that may be misinterpreted as negative results. In addition, the two-click closure of the chip cap is not merely a mechanical feature; it is necessary to maintain the sealed headspace required for isothermal amplification and to prevent evaporative loss.
Troubleshooting is relatively straightforward. Highly viscous ICU sputum may require manual shaking for longer than the recommended 1 min. Dilute specimens, particularly bronchoalveolar lavage fluid, may require loading at twice the standard pipetting volume to compensate for lower pathogen density. Failure of the internal control, defined as the absence of an S-shaped amplification curve or a TP value greater than 12 min, indicates either insufficient specimen cellularity or a fluidic failure within the chip. In such cases, the appropriate response is to collect a new specimen or repeat testing using a fresh chip, rather than reinterpret individual channels.
This method also has important limitations. The panel is restricted to 15 predefined targets, and organisms outside this list, including many antimicrobial resistance determinants, cannot be detected. Each primer set targets a conserved, species-specific region of its intended organism, except for the genus-level Aspergillus assay; species or strains not represented in the panel are therefore not detected, and the panel does not capture intraspecies strain-level variation. Because each of the 16 wells contains a dedicated lyophilized primer set, the panel is modular and can be reconfigured in future versions to add targets.
The assay output is qualitative. Although TP values may show a loose relationship with pathogen burden, they cannot replace quantitative culture results or PCR-based estimates derived from cycle threshold values. As with any nucleic acid amplification test performed on respiratory specimens, the assay cannot distinguish colonization from true infection on its own. Clinical interpretation must therefore integrate chip results with inflammatory markers such as C-reactive protein and procalcitonin, imaging findings, fungal biomarkers including galactomannan and (1,3)-β-D-glucan, and the overall clinical course. In addition, the system does not provide antimicrobial susceptibility data, and conventional culture remains indispensable for that purpose.
Finally, all specimens included in this study were obtained from a single tertiary ICU, and pathogen prevalence and co-infection patterns may differ across institutions and patient populations. The present work should therefore be regarded as a pilot, proof-of-concept demonstration of the protocol on a small, deliberately selected set of representative specimens; it was not designed to estimate diagnostic accuracy. Per-target clinical sensitivity and specificity, as well as systematic concordance with conventional culture and metagenomic next-generation sequencing (mNGS), will be established in a planned prospective, consecutively enrolled, multicenter study.
As an initial measure of analytical performance, the limit of detection (LoD) for each target was estimated using digital-PCR-quantified genomic nucleic acid spiked into a negative bronchoalveolar lavage fluid matrix. Samples were serially diluted and tested in triplicate. The LoD was defined as the lowest concentration detected in at least 95% of replicates. The resulting LoD values ranged from 1,000 to 4,000 copies/mL across the panel (Table 7). Because colony-count-based quantification of each organism was not available in this pilot study, these LoD estimates will be refined using formally enumerated reference strains in future work.
Comparison with existing diagnostic approaches further clarifies the position of this platform. Conventional culture, although slow, remains the reference standard and provides susceptibility information. Metagenomic next-generation sequencing offers much broader organism coverage, but at substantially greater cost, longer turnaround times (typically 24–48 h), and with bioinformatics requirements that many ICUs cannot support on site9. Standard multiplex PCR panels shorten time to result, but they still generally require separate nucleic acid extraction and, depending on the platform, batch processing that can introduce additional delay10.
From a cost perspective, although a formal cost-effectiveness analysis was beyond the scope of this pilot study, the platform addresses the principal real-world cost drivers in the ICU, including both culture and conventional or multiplex PCR (a qualitative comparison across methods is provided in Table 8). It returns results in approximately 1 h, compared with 2–5 days for sputum culture, 4–8 h for conventional PCR (which typically requires batch processing), and >24 h for metagenomic sequencing. Because the workflow is fully integrated (sample-in, result-out), it requires only a single manual loading step with no separate nucleic acid extraction, can be performed at the bedside without a dedicated bacteriology or molecular laboratory or specialized molecular-biology staff, and uses a closed, single-use cartridge that reduces contamination-related repeat testing. Equipment costs are also modest, avoiding the need for a real-time quantitative PCR instrument or a sequencing platform. For critically ill ICU patients, this rapid turnaround may shorten the duration of inappropriate empirical therapy and reduce length of stay, providing an indirect but potentially substantial cost benefit.
The present system occupies a distinct niche defined by rapid turnaround, operational simplicity, and closed-cartridge biosafety, characteristics that together make bedside implementation feasible. The inclusion of three fungal targets is a particularly important feature. Aspergillus spp. was detected in 5 of the 10 specimens (TP range: 5.5–8 min). Given the known limitations of culture and the restricted diagnostic window of galactomannan testing for Aspergillus5,6, a molecular signal available within 45 min may allow earlier consideration of targeted antifungal therapy, although the clinical value of this earlier signal will need to be established in prospective studies.
Several future directions are evident. Expansion of the panel to include key resistance determinants, at a minimum, carbapenemase genes and mecA, would help bridge the gap between pathogen identification and empirical antimicrobial selection. In addition, as TP datasets grow, machine learning models trained on paired amplification profiles and clinical metadata may eventually help distinguish colonization from true infection, though such applications will require careful prospective validation. More broadly, multicenter evaluation across geographically diverse ICU populations will be necessary before the diagnostic performance of this platform can be considered generalizable.
Disclosures
The authors declare no competing interests.
Acknowledgements
Noncommunicable Chronic Diseases-National Science and Technology Major Project (No. 2023ZD0516500), National High-Level Hospital Clinical Research Funding (2026-PUMCH-A-103) and CMB Open Competition Program (24-561) and Peking Union Medical College Hospital Talent Cultivation Program (No.UGG11571).
Materials
| Name | Company | Catalog Number | Comments |
|---|---|---|---|
| Automated Nucleic Acid Analyzer | Beijing Taihao Biotechnology Co., Ltd | THE-T80-01 | TurboFlow T; performs centrifugal reagent distribution, magnetic-bead extraction, LAMP at 65 °C, and real-time fluorescence detection (~45 min run) |
| #1 Disposable Pasteur pipette | Zhongtai Experimental Equipment Factory (Haimen) | Custom-made | Disposable consumable; 0.5 mL; transfers homogenized specimen into lysis tube |
| #2 Disposable Pasteur pipette | Zhongtai Experimental Equipment Factory (Haimen) | Custom-made | Disposable consumable; 2 mL; aspirates specimen to marked line into liquefaction tube |
| CD chip | Beijing Hongyang Chensheng Technology Co., Ltd | Custom-made | Disposable consumable; 86 mm disc with central loading zone (ports O, B, S), magnetic-bead purification zone, and outer ring with 16 reaction wells (15 pathogen targets + NBPF internal control) |
| LAMP reaction reagents | Yeasen Biotechnology (Shanghai) Co., Ltd | 16730ES80 | LAMP reaction reagents pre-stored in CD chip as lyophilized beads |
| Liquefaction tube | Beijing Taihao Biotechnology Co., Ltd | Custom-made | Disposable consumable; 2 mL/tube; receives specimen for manual homogenization |
| Lysis tube | Beijing Taihao Biotechnology Co., Ltd | Custom-made | Disposable consumable; 0.5 mL/tube; compressible silicone body with 200 µm filter membrane; preloaded lysis reagents |
| Primers | Sangon Biotech (Shanghai) Co., Ltd | Custom-made | Primer mixture embedded in reaction chamber of CD chip |
| Sample Preprocessing device | Beijing Taihao Biotechnology Co., Ltd | THE-R10-02 | TS-2000; automated liquefaction–lysis cycle (~15 min) |
| Single-dose vial “B” | Ruifu Biotechnology (Guangzhou) Co., Ltd | Custom-made | Disposable consumable; pre-packaged on-chip reagent; one per test; stored at 4 °C and equilibrated to room temperature (~25 °C) before loading |
| Single-dose vial “O” | Ruifu Biotechnology (Guangzhou) Co., Ltd | Custom-made | Disposable consumable; pre-packaged on-chip reagent; one per test; stored at 4 °C and equilibrated to room temperature (~25 °C) before loading |
References
- GBD 2016 Lower Respiratory Infections Collaborators. Estimates of the global, regional, and national morbidity, mortality, and aetiologies of lower respiratory infections in 195 countries, 1990–2016: a systematic analysis for the Global Burden of Disease Study 2016. Lancet Infect Dis. 2018;18(11):1191-1210.
- Niederman MS, Torres A. Respiratory infections. Eur Respir Rev. 2022;31(166):220150.
- Weiser JN, Ferreira DM, Paton JC. Streptococcus pneumoniae: transmission, colonization and invasion. Nat Rev Microbiol. 2018;16(6):355-367.
- Reynolds D et al. The threat of multidrug-resistant/extensively drug-resistant gram-negative respiratory infections: another pandemic. Eur Respir Rev. 2022;31(166):220068.
- Schauwvlieghe AFAD et al. Invasive aspergillosis in patients admitted to the intensive care unit with severe influenza: a retrospective cohort study. Lancet Respir Med. 2018;6(10):782-792.
- Meersseman W et al. Galactomannan in bronchoalveolar lavage fluid: a tool for diagnosing aspergillosis in intensive care unit patients. Am J Respir Crit Care Med. 2008;177(1):27-34.
- Seymour CW et al. Time to treatment and mortality during mandated emergency care for sepsis. N Engl J Med. 2017;376(23):2235-2244.
- Noviello S, Huang DB. The basics and the advancements in diagnosis of bacterial lower respiratory tract infections. Diagnostics (Basel). 2019;9(2):37.
- Chiu CY, Miller SA. Clinical metagenomics. Nat Rev Genet. 2019;20(6):341-355.
- Hanson KE et al. Molecular testing for acute respiratory tract infections: clinical and diagnostic recommendations from the IDSA's diagnostics committee. Clin Infect Dis. 2020;71(10):2744-2751.
- Notomi T et al. Loop-mediated isothermal amplification of DNA. Nucleic Acids Res. 2000;28(12):E63.
- Soroka M, Wasowicz B, Rymaszewska A. Loop-mediated isothermal amplification (LAMP): the better sibling of PCR? Cells. 2021;10(8):1931.
- Parida M et al. Loop-mediated isothermal amplification (LAMP): a new generation of innovative gene amplification technique; perspectives in clinical diagnosis of infectious diseases. Rev Med Virol. 2008;18(6):407-421.
- Ou H et al. Rapid detection of multiple pathogens by the combined loop-mediated isothermal amplification technology and microfluidic chip technology. Ann Palliat Med. 2021;10(10):11053-11066.
- Lai JX et al. Rapid detection of bacterial pathogens causing lower respiratory tract infections via microfluidic-chip-based loop-mediated isothermal amplification. J Vis Exp. 2024;(205):e66677.
Reprints and Permissions
