This protocol describes the establishment of a microfluidic co-culture blood–brain barrier model using human brain endothelial cells and astrocytes. The method incorporates shear flow, transendothelial electrical resistance measurements, and immunofluorescent characterization to assess endothelial barrier formation and cell–cell interactions under dynamic flow conditions.
Method Article
Establishing a Microfluidic Co-Culture Blood–Brain Barrier Model Using Human Brain Endothelial Cells and Astrocytes
* These authors contributed equally
In This Article
Summary
Abstract
The blood–brain barrier (BBB) is a highly selective physiological interface that regulates molecular transport between the bloodstream and the central nervous system. In vitro BBB models are valuable tools for studying endothelial barrier formation, cell–cell interactions, and responses to dynamic flow conditions. This protocol describes the establishment of a three-dimensional microfluidic co-culture BBB model using human brain endothelial cells and primary human astrocytes cultured in separate but interconnected compartments of a microfluidic chip. The protocol includes chip preparation, extracellular matrix coating, endothelial and astrocyte seeding, introduction of programmable shear flow, transendothelial electrical resistance (TEER) measurement, fixation, immunofluorescent staining, and confocal imaging. Shear flow is applied to the endothelial compartment using programmable syringe pumps to support endothelial alignment and tight junction formation under dynamic culture conditions. Barrier formation is evaluated using TEER measurements and immunofluorescent characterization of endothelial and astrocytic markers, including cluster of differentiation 31, zonula occludens-1, and glial fibrillary acidic protein. This methodology provides a reproducible workflow for establishing a microfluidic endothelial–astrocyte co-culture model suitable for studying BBB-associated cellular interactions and barrier formation under controlled flow conditions. The protocol is intended to support reproducible implementation of BBB chip workflows by providing detailed guidance for device preparation, cell culture, flow setup, imaging, and data acquisition.
Introduction
The blood–brain barrier (BBB) is a highly selective physiological membrane that maintains the homeostasis of the brain microenvironment, regulates the movement of solutes from the blood into the brain, and protects the brain from harmful pathogens. The BBB consists of multiple components that aid in the restriction of molecules. Brain endothelial cells line blood capillaries and are tightly adhered to each other by tight junctions. A basement membrane embedded with pericytes surrounds the endothelium. Astrocytic endfeet cover the majority of the capillary surface and provide further support and induction of BBB properties. The wider neurovascular unit (NVU) additionally contains microglia, the central nervous system (CNS) immune cells, and neurons1,2. In the present study, the microfluidic model represents an endothelial–astrocyte co-culture approximation of the BBB and does not fully recapitulate the complete multicellular NVU architecture present in vivo1,2.
To study the BBB, researchers have developed different in vitro and in vivo models. In line with the principles of the 3Rs (replacement, reduction, and refinement)3, there is a need to develop more physiologically relevant in vitro systems that can better replicate aspects of organ-specific microenvironments while contributing to the reduction and refinement of animal use in research. The development of microfluidic chips has offered an additional approach in the biomedical sciences field4. Microfluidic chips are small devices that contain microchannels cut or molded into materials such as silicon, glass, or polymers, including polydimethylsiloxane (PDMS). These microchannels are arranged according to specific designs for desired applications and are often interconnected. With the use of inlet and outlet wells or ports, fluid can pass through the chip on the nanoliter to microliter scale. Microfluidics enable the precise control of small fluid volumes with high surface-to-volume ratios. These chips can be specifically designed to manipulate shear flow, enhance mass transfer, tune retention times, and control fluid–fluid or fluid–solid interfaces. As a result, microfluidic chips have numerous applications, including diagnostics, drug discovery and delivery, organ-on-a-chip modelling, and personalized medicine, with additional applications continuing to emerge regularly5.
The use of microfluidic chips to develop organ-on-a-chip models has grown substantially in recent years, with numerous organ systems being recapitulated in these devices. These systems are particularly useful for modelling aspects of complex physiology, such as the BBB6. In comparison to established BBB models, such as the Transwell system, brain-on-a-chip models can offer several advantages in addition to the ability to measure transendothelial electrical resistance (TEER). One such advantage is the ability to form three-dimensional (3D) cultures, particularly for BBB modelling, enabling the culture of a 3D endothelial “lumen” to approximate aspects of blood capillary architecture7. Syringe pumps or rocking systems enable shear flow to be introduced into these models, which can be used to mimic aspects of blood movement under controlled in vitro conditions. Shear stress has been reported to increase the expression of tight junctions and adherens junctions, which are important for barrier formation, improve TEER, and influence the expression of ion channels and transporter proteins, amongst other effects8,9. Additionally, the separation of cell populations allows environmental conditions, such as media composition, static or flow conditions, and neighboring cell interactions, to be tailored to specific cell populations within different regions of the device. Micropores between channels or chambers often allow both physical and chemical communication between cell populations. Microfluidic chips can facilitate real-time visualization of cell movement, simplified imaging workflows, and TEER measurements using either embedded electrodes or external electrode systems. Due to the small size of these devices, multiple chips can be operated simultaneously while using reduced reagent volumes. The use of human cells in in vitro models can contribute to reducing animal use in research, and when combined with microfluidic systems, may provide a more physiologically relevant platform for pre-clinical investigations. However, despite these advantages, microfluidic models often involve complex methodologies that require specialized training, extensive protocol optimization, and substantial initial investment in associated equipment.
This paper describes the establishment of a human co-culture BBB microfluidic chip model consisting of immortalized human cerebral microvascular endothelial cells (hCMEC/D3) and human primary astrocytes. Building on previously published work10, the methodology presented herein has been further refined and optimized to provide more detailed instructions for accurate replication and improved reproducibility. Additionally, the paper provides practical information that may support multidisciplinary research applications, including CNS and BBB-related investigations. The protocol is intended to facilitate implementation for researchers who may not have access to more advanced BBB chip systems that require extensive optimization or specialized expertise. The microfluidic chip used in this study is commercially available from SynVivo, and the workflow described is specifically optimized for this chip architecture and associated flow system. The chips utilize programmable syringe pumps to introduce shear flow conditions that mimic aspects of in vivo microvascular blood movement and support endothelial barrier formation9. The achieved shear flow conditions more closely approximate lower shear microvascular environments rather than fully physiological capillary shear stress. The protocol includes basement membrane coating, endothelial cell culture, astrocyte cell culture, introduction of shear flow, maintenance of co-cultures, measurement of TEER, immunofluorescent staining, and confocal imaging.
Protocol
All human-derived cell lines used in this protocol were commercially obtained from authenticated repositories. Because these materials consist of established, commercially available, and de-identified human cells, they are exempt from institutional review board (IRB) or human research ethics committee approval according to institutional guidelines.
CAUTION: Follow institutional procedures for the handling, storage, and disposal of all chemicals, compressed gases, biological materials, and human-derived cell culture waste used in this protocol. Handle paraformaldehyde (PFA), Triton X-100, ethanol, and compressed nitrogen gas using appropriate personal protective equipment and ventilation procedures.
NOTE: Perform all procedures inside a Category 2 Class II biosafety cabinet to maintain sterility and ensure user safety. Remove microfluidic chips from the biosafety cabinet only after inserting tubing into all ports and applying clamps. Store chips in a sealed plastic container during transport to the incubator. If the microscope cannot be placed inside the biosafety cabinet, insert tubing into all ports and place chips into the bottom of sterile Petri dishes before transport to the microscope. Minimize the time that chips remain outside of the biosafety cabinet. A step-by-step workflow of the protocol is provided in Supplementary Figure 1.
1. Culturing Human Cerebral Microvascular Endothelial Cells (hCMEC/D3)
NOTE: Cell culture media and supplements are listed in the Table of Materials. Additional information regarding the hCMEC/D3 cell line is provided in Supplementary Table 1, Note 1.
- Preparation and maintenance of hCMEC/D3 cultures
- Prepare endothelial cell culture medium using EndoGRO medium supplemented with the MV supplement kit and 2% penicillin/streptomycin. Refer to the Table of Materials for the complete medium composition.
- Coat T175 culture flasks with 10 mL of a 1:20 dilution of rat tail collagen I and incubate for 1 h at 37°C. Remove the collagen solution and add 10 mL of supplemented endothelial cell culture medium to each flask.
- Thawing and expansion of hCMEC/D3 cells
- Remove a vial of frozen hCMEC/D3 cells from liquid nitrogen storage and thaw rapidly in a 37°C water bath for approximately 2 min or until only a small ice crystal remains.
- Transfer the thawed cell suspension into a 15 mL conical tube containing 9 mL of endothelial cell culture medium.
- Centrifuge the cells at 300 × g for 5 min. Remove the supernatant and resuspend the cell pellet in 10 mL of endothelial cell culture medium.
- Transfer the cell suspension into collagen-coated T175 culture flasks.
- Routine maintenance and passaging of hCMEC/D3 cells
- Replace the culture medium every 2–3 days. Monitor cultures regularly and passage the cells at 80%–90% confluence, determined by visual estimation using a phase-contrast microscope.
- Wash the cells twice with 10 mL of phosphate-buffered saline (PBS) without calcium or magnesium. Add 5 mL of 0.05% trypsin/EDTA solution and incubate for 5 min at 37°C.
- Transfer detached cells into a 50 mL conical tube and rinse the flask with 10 mL of endothelial cell culture medium.
- Centrifuge the cells at 300 × g for 5 min. Resuspend the cell pellet and determine the cell concentration using a hemocytometer.
- Seed cells equally into collagen-coated T175 culture flasks for continued expansion.
- Preparation of cells for microfluidic chip seeding
- Prepare endothelial cells at a final concentration of 3 × 10⁷ cells/mL before seeding into the microfluidic chip.
- Expand approximately three T175 culture flasks to obtain sufficient cell numbers for one seeding preparation.
NOTE: hCMEC/D3 cells maintain reported barrier-associated characteristics up to passage 3511. Observations from this study indicated reduced tolerance to prolonged shear flow exposure above this passage number.
2. Nitrogen Priming and Basement Membrane Coating
NOTE: Examine chips before use and perform nitrogen priming prior to coating (Supplementary Table 1, Notes 2 and 3; Figure 1A–1C).
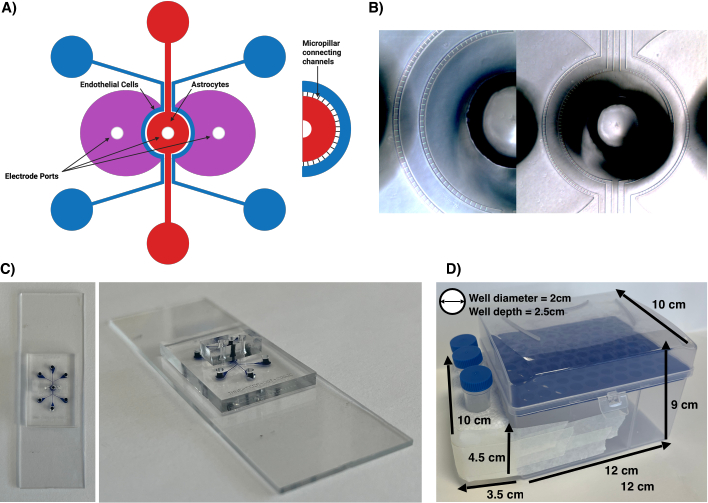
Figure 1. Architecture and handling setup of the blood–brain barrier (BBB) microfluidic chip model. (A) Schematic representation of the microfluidic BBB chip showing the outer apical vascular channels used for culturing human cerebral microvascular endothelial cells (hCMEC/D3; blue) and the inner basolateral chamber used for culturing human primary astrocytes (red). Electrode ports positioned adjacent to the endothelial channels enable transendothelial electrical resistance (TEER) measurements. Micropillar channels permit physical and chemical communication between compartments. Schematic created using BioRender. (B) Representative brightfield images showing the architecture of the microfluidic chip and micropillar interface. (C) Representative images of the microfluidic chip perfused with dye to visualize channel connectivity and fluid distribution. (D) Example configuration of the humidity box used during chip incubation, including representative dimensions and placement of waste collection tubes. Please click here to view a larger version of this figure.
- Preparation of tubing and insertion
- Insert Tygon tubing into the three outlet ports and three electrode ports of the microfluidic chip using sterile tweezers.
- Cut the outlet tubing to a length of 10 cm. Cut the electrode port tubing to a length shorter than the electrodes intended for use to ensure that the electrodes extend beyond the tubing and contact the glass base of the electrode chamber.
- Determine the required tubing length by inserting an electrode into the tubing, marking the appropriate position, removing the electrode, and cutting the tubing at the marked location.
- Perfusion of the chip with PBS
- Attach approximately 24 cm of Tygon tubing to a 1 mL syringe needle.
- Aspirate PBS into the syringe and tubing until the system is completely filled and free of visible air bubbles.
- Insert the PBS-filled tubing into one outer apical channel inlet port using sterile tweezers.
- Gently depress the syringe plunger until approximately three drops of PBS emerge from the outlet tubing (approximately 10 µL per drop). Apply a clamp to the outlet port tubing.
- Continue depressing the syringe plunger until PBS fills the electrode chamber and electrode port tubing and approximately three drops emerge from the electrode port tubing.
- Apply a clamp to the electrode port tubing.
- Cut the inlet tubing to leave approximately 8 cm attached to the chip.
- Repeat Steps 2.2.3–2.2.7 for the second outer apical channel. Repeat Steps 2.2.3–2.2.6 for the inner basolateral channel.
- Leave the tubing attached to the syringe connected to the basolateral channel. Remove only the syringe barrel from the needle assembly to permit subsequent connection to the pneumatic primer system.
- Priming with nitrogen gas
CAUTION: Handle compressed nitrogen gas cylinders according to institutional compressed gas safety procedures. Secure cylinders appropriately and use compatible pressure regulators.- Attach the pneumatic primer to the nitrogen gas cylinder. Attach the multiport manifold to the pneumatic primer to enable simultaneous priming of multiple chips.
- Connect the chip to the manifold by securing the syringe needle attached to the chip tubing into the luer-lock connector closest to the pneumatic primer. Connect additional chips to downstream luer-lock connectors as required.
- If downstream connectors remain unused, adjust the final occupied connector dial to prevent nitrogen flow into unoccupied ports.
- Open the nitrogen gas cylinder regulator and maintain the inlet pressure below 20 PSI. Set the pneumatic primer pressure to 7.5 PSI and prime the chips for 25–30 min. Disconnect the chips from the manifold and inspect the channels under a microscope for residual air bubbles.
- Repeat nitrogen priming for an additional 25–30 min if visible air bubbles remain within the channels. Continue priming until no visible air bubbles remain within the channels or electrode chambers.
- Basement membrane coating using laminin, Matrigel, and fibronectin (LMF)
- Attach approximately 24 cm of Tygon tubing to a 1 mL syringe needle.
- Prepare a coating solution containing laminin (5 µg/mL), Matrigel (1:10 dilution), and fibronectin (300 µg/mL) in cold PBS to obtain a final volume of 0.5 mL per chip.
NOTE: Thaw coating reagents on ice and prepare all dilutions using 4°C PBS to minimize premature matrix polymerization. Matrigel is subject to lot-to-lot variability. - Aspirate the coating solution into the syringe and tubing while avoiding the introduction of air bubbles.
- Place a drop of PBS around the inserted tubing and port region to prevent introducing air bubbles into the channels. Gently remove the tubing.
- Gently depress the syringe plunger until a small meniscus forms at the end of the tubing outlet. Insert the coating solution tubing into the inlet port connected to one outer apical channel using sterile tweezers.
- Gently depress the syringe plunger until approximately three drops of coating solution emerge from the outlet tubing.
- Cut the inlet tubing to leave approximately 8 cm attached to the chip and apply a clamp.
- Repeat Steps 2.4.4–2.4.7 for the second outer apical channel and then for the inner basolateral channel.
- Transfer the chips to a humidity box and incubate for 1 h at 37°C, 5% CO2, and 95% humidity (Figure 1D; Supplementary Table 1, Note 4).
NOTE: Maintain a humidified environment throughout the coating incubation period to minimize evaporation from the microchannels. - Following incubation, repeat Steps 2.4.4–2.4.8 instead using PBS to remove excess coating solution from the channels.
- Measure background TEER immediately after coating or transfer the chips to a humidity box and incubate overnight (12-18 h) before measuring background TEER on the following day as described in Step 3.
3. Transendothelial Electrical Resistance (TEER)
- Calibration of the impedance analyzer
NOTE: Calibrate the impedance analyzer at least once per week before performing TEER measurements.- Connect the impedance analyzer to the power supply and attach the micro-grabber leads.
- Measure the resistance of the supplied calibration resistors (200 kΩ, 49.9 kΩ, and 28 kΩ; tolerance ±1%) by attaching the micro-grabbers to opposite sides of each resistor. Measure resistance at 500 Hz, 1 kHz, and 10 kHz.
- Record at least three measurements at each frequency. Change the measurement frequency using the toggle switch and initiate each measurement using the measurement button.
- Calculate the average resistance value for each resistor at each frequency. Confirm that the measured impedance values are within ±5% of the expected resistor values. Contact the manufacturer if any measured value falls outside the acceptable range.
- Measurement of background TEER
- Remove the humidity box containing the microfluidic chip from the incubator and disinfect the external surface using 70% ethanol.
- Transfer the humidity box to a biosafety cabinet and place the chip on a hot plate set to 37°C for 10 min before measurement. Remove the clamps from the electrode port tubing.
- Disinfect two electrodes using 70% ethanol. Insert one electrode into the tubing connected to the apical electrode port and a second electrode into the tubing connected to the shared basolateral electrode port (Figure 2A).
- Advance the electrodes until the tips contact the glass base of the electrode chambers.
- Attach the micro-grabbers to the electrodes. Measure TEER for both apical channels at 500 Hz, 1 kHz, and 10 kHz. Record at least three measurements at each frequency for each apical channel.
- Calculate the average background TEER value for each channel at each frequency.
- Remove the electrodes carefully to minimize fluid displacement and prevent the introduction of air bubbles. Disinfect the electrodes with 70% ethanol before reuse.
- TEER measurements during cell culture
- Measure TEER throughout endothelial cell culture by repeating the procedure described in Step 3.2. Perform TEER measurements at regular intervals (every 1–3 days) to monitor endothelial monolayer formation and barrier integrity.
- Refer to Figure 2B for a representative example of TEER progression between day 4 and day 10 of endothelial cell culture.
- Subtract the background TEER value from all subsequent measurements to obtain TEER values associated with cultured cells only.
- Normalize TEER values to the first TEER measurement obtained after endothelial cell seeding to calculate fold-change values for comparison between experimental conditions.
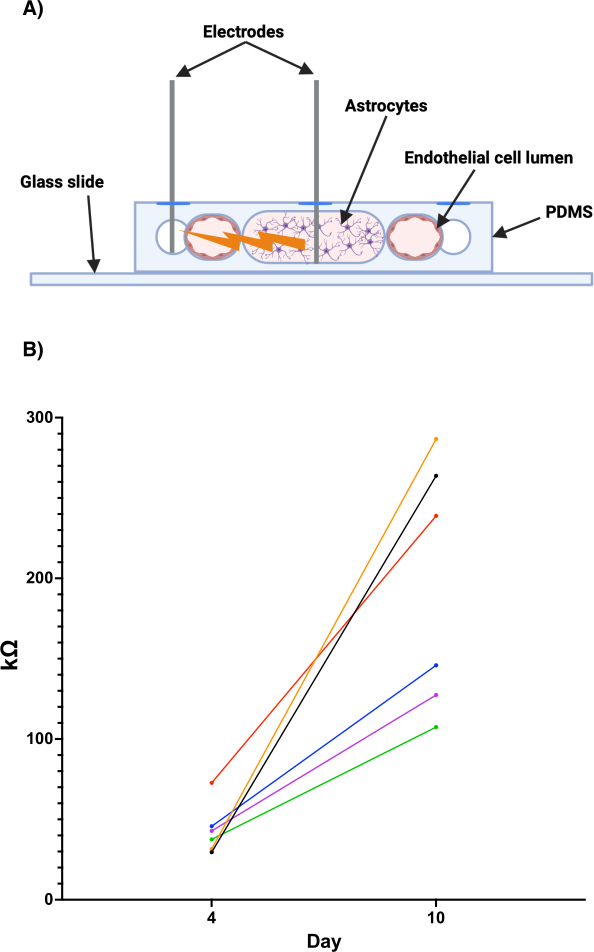
Figure 2. Measurement of TEER in the BBB microfluidic chip model. (A) Schematic representation of electrode placement for TEER measurements across the endothelial barrier within the microfluidic chip. Electrodes were inserted into the apical and basolateral electrode ports to measure impedance across the endothelial cell layer at 500 Hz, 1 kHz, and 10 kHz. Schematic created using BioRender. (B) Representative progression of TEER values measured at 1 kHz between day 4 and day 10 following endothelial cell seeding. Individual lines represent separate apical endothelial channels from three independent microfluidic chips (n = 6 channels). Values are presented as resistance measurements following subtraction of background TEER measured in coated cell-free chips. Please click here to view a larger version of this figure.
4. Cerebral Microvascular Endothelial Cell Seeding
- Detachment and filtering of endothelial cells
- Detach hCMEC/D3 cells from three T175 culture flasks at approximately 90% confluence using the procedure described in Step 1.3.
- Resuspend the cell pellet in endothelial cell culture medium. Adjust the resuspension volume according to the number of chips being seeded (e.g., 333.3 µL for one chip or 1 mL for three chips).
- Pipette the suspension gently up and down to disperse visible cell aggregates. Filter the cell suspension through a 40 µm cell strainer to remove remaining aggregates.
- Determine the cell concentration using a hemocytometer or equivalent cell counting method and adjust the suspension to a final concentration of 3 × 10⁷ cells/mL.
- Transfer the filtered cell suspension into a sterile microcentrifuge tube for immediate use. Store the microcentrifuge tube in a 37°C, 5% CO₂ incubator between chip seedings.
- Mix the suspension by gentle inversion or flicking before each aspiration step to maintain a uniform cell distribution. Complete all chip seedings within 30 min of final resuspension.
- First endothelial cell seeding under inverted conditions
- Attach 15 cm of Tygon tubing to a 1 mL syringe and needle.
- Remove the endothelial cell suspension and the humidity box containing the coated microfluidic chip from the incubator.
- Disinfect the external surfaces of the microcentrifuge tube and humidity box using 70% ethanol before placing them in a biosafety cabinet.
- Mix the endothelial cell suspension by gentle inversion or flicking immediately before aspiration.
- Aspirate the endothelial cell suspension into the tubing and syringe until approximately 100 µL remains within the syringe barrel.
- Return the remaining cell suspension to the incubator between chip seedings.
- Remove the clamp from the outlet tubing connected to one outer apical channel.
- Apply a drop of endothelial cell culture medium to the inlet port and gently remove the existing tubing.
- Gently depress the syringe plunger until a small meniscus forms at the tubing outlet.
- Insert the tubing into the inlet port connected to the apical channel.
- Slowly depress the syringe plunger until approximately three drops of endothelial cell suspension emerge from the outlet tubing.
NOTE: Monitor the fluid level continuously during seeding. Do not allow air to enter the tubing or microfluidic channel. Aspirate additional cell suspension if the fluid column decreases to approximately 5 cm within the tubing. - Reapply the clamp to the outlet tubing.
- Cut the inlet tubing to leave approximately 5 cm attached to the chip and apply a clamp.
- Repeat Steps 4.2.2–4.2.13 for the second apical channel.
- Examine the seeded channels under a microscope and confirm that endothelial cell coverage is approximately 70% or greater and evenly distributed throughout the channel (Figure 3A).
- Promote uniform cell distribution by gently adjusting the attached tubing using tweezers while observing the cells under the microscope. Stop once cells are distributed evenly throughout the channel.
- Repeat the seeding procedure if cell coverage remains sparse or uneven.
NOTE: To reduce migration of endothelial cells into the basolateral chamber, apply a thicker Matrigel coating (1:5 dilution in 4°C PBS) to the basolateral channel before laminin–Matrigel–fibronectin (LMF) coating using the procedure described in Step 2.4. Increased Matrigel thickness may increase the risk of PDMS lifting or detachment from the glass substrate. - Repeat Step 4.2 for additional chips as required.
- Place seeded chips in an inverted orientation inside the humidity box with the glass surface facing upward and the PDMS surface facing downward.
- Secure the chip using masking tape attached to both ends of the glass slide and fixed to the inside of the humidity box lid. Close the humidity box lid carefully while ensuring that all tubing remains inside the container.
- Transfer the humidity box to a 37°C, 5% CO₂ incubator and incubate for at least 4 h before performing the second endothelial cell seeding.
- Preparation of endothelial cells for second seeding
- Repeat the endothelial cell detachment and filtering procedure described in Step 4.1.
- Second endothelial cell seeding under upright conditions
- Repeat the seeding procedure described in Step 4.2 while positioning the chip upright inside the humidity box with the glass surface facing downward and the PDMS surface facing upward.
- Transfer the humidity box to a 37°C, 5% CO₂ incubator and incubate overnight (12–18 h) before connecting the chip to the syringe pump medium replacement system described in Step 5.
- Monitor endothelial cell growth regularly using microscopy and TEER measurements as described in Step 3.3. Refer to Figure 3B–3E for representative examples of endothelial cell progression. Refer to Figure 3F for a representative failed model resulting from endothelial cell detachment under flow conditions.
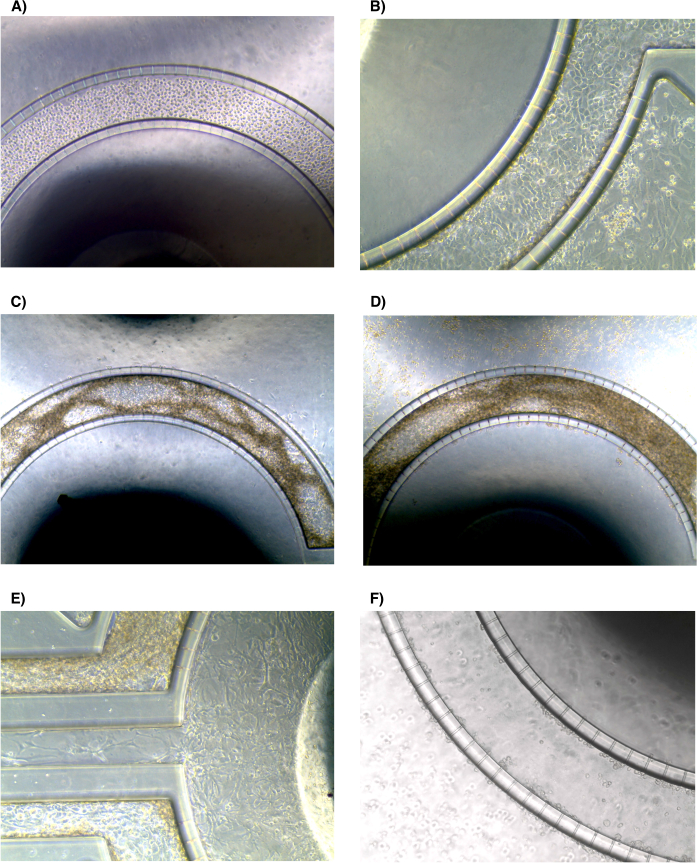
Figure 3. Representative brightfield images demonstrating endothelial cell growth and co-culture establishment within the BBB microfluidic chip model. (A) Representative endothelial cell distribution immediately following seeding of hCMEC/D3 into the apical vascular channel. (B–D) Representative progression of endothelial cell growth, barrier formation, and lumen development within the apical channel at increasing culture durations. (E) Representative co-culture showing hCMEC/D3 endothelial cells within the apical vascular channels and human primary astrocytes within the basolateral chamber. (F) Representative failed culture resulting from endothelial cell detachment and loss of barrier formation within the apical channel. Brightfield images were acquired using identical microscope settings where possible. Please click here to view a larger version of this figure.
5. Syringe Pump Attachment
- Filling glass syringes with culture medium
- Calculate the volume of culture medium required for the remaining culture period and all planned chip experiments.
- Include the volume required to fill the tubing connected to the syringes and syringe pump using an estimated tubing volume of approximately 2 µL/cm.
- Select appropriately sized glass syringes based on the calculated medium volume. Prepare two syringes per chip for the apical channels.
- Aliquot culture medium into a 50 mL conical tube.
- Attach a syringe needle and submerge the needle in the culture medium.
- Slowly aspirate culture medium into the syringe by retracting the plunger gradually.
- Fill all syringes equally to ensure compatibility with syringe pump positioning.
- Inspect the syringe barrel and needle for visible air bubbles.
- Hold the syringe vertically with the needle facing upward and gently tap the syringe to move air bubbles toward the needle.
- Slowly depress the plunger to expel medium containing trapped air.
- Re-aspirate culture medium to the required volume.
- Repeat Steps 5.1.8–5.1.11 until no visible air bubbles remain within the syringe or needle.
- Preparation of tubing for syringe pump connection
NOTE: Tubing used in this study had an inner diameter of 0.51 mm and an outer diameter of 1.52 mm.- Cut tubing to a length sufficient to allow transfer of the microfluidic chip between the biosafety cabinet and incubator while remaining connected to the syringe pump.
NOTE: Tubing lengths of 105 cm were used in this study. Fluid dynamics calculations and representative flow characteristics presented in this manuscript were determined using this tubing length. Changes in tubing length may alter flow behavior and pressure characteristics. - Attach the tubing securely to the syringe needle of each syringe.
- Cut tubing to a length sufficient to allow transfer of the microfluidic chip between the biosafety cabinet and incubator while remaining connected to the syringe pump.
- Placement of syringes onto the syringe pump
- Attach an extension rack to the syringe pump if additional syringe positions are required (Figure 4A).
- Install the extension rack according to the manufacturer’s instructions. Loosen the syringe pump fixtures and adjust the spacing to accommodate the selected syringes.
- Position each syringe individually within the syringe pump rack. Ensure that the distal ends of the tubing remain within the biosafety cabinet during setup.
- Secure the tubing using tape if necessary to minimize movement. Tighten all syringe pump fixtures. Use the syringe pump forward function to advance culture medium through the tubing.
- Confirm that culture medium fills the entire tubing length and that no visible air bubbles remain.
- Attachment of syringe tubing to the microfluidic device
- Remove the humidity boxes containing the chips from the incubator and disinfect the external surfaces using 70% ethanol. Transfer the humidity boxes to a biosafety cabinet.
- Prepare one chip at a time when connecting multiple devices. Remove the chip from the humidity box and place it on a hot plate set to 37°C. Remove the clamps from the outlet tubing connected to the apical channels.
- Using sterile tweezers, create a circular opening approximately 1.5 mm in diameter in the lid of a microcentrifuge tube or 5 mL conical tube.
- Insert the outlet tubing through the opening until approximately 2 cm extends into the collection tube.
- Use the collection tube as a waste reservoir for medium exiting the outlet tubing.
NOTE: Retain collected medium for downstream analysis of secreted proteins, cytokines, or other soluble factors if required. - Apply a drop of culture medium to the inlet port of each apical channel. Remove the existing inlet tubing from both apical channels. Inspect the syringe-connected tubing and confirm that a visible meniscus is present at the tubing outlet.
- Elevate the tubing if the meniscus has receded because of backflow.
- Trim the tubing incrementally if the medium does not reach the tubing outlet after repositioning. Insert the tubing gently into the inlet port of each apical channel.
- Return the chip to the humidity box and transfer the box to the incubator. Repeat Step 5.4 for additional chips as required.
- Position the syringe pump and external tubing above the level of the microfluidic device.
- Place the humidity box containing the chip on a shelf below the syringe pump level inside the incubator. Secure the tubing inside the incubator using tape to minimize tubing movement during routine incubator access.
- Programming the syringe pump
NOTE: Detailed syringe pump programming instructions are provided in Figure 4B and Supplementary Table 2.
NOTE: Different syringe pump models may vary in programming capability and user interface. The workflow described in this study corresponds to the programmable syringe pump model listed in the Table of Materials.
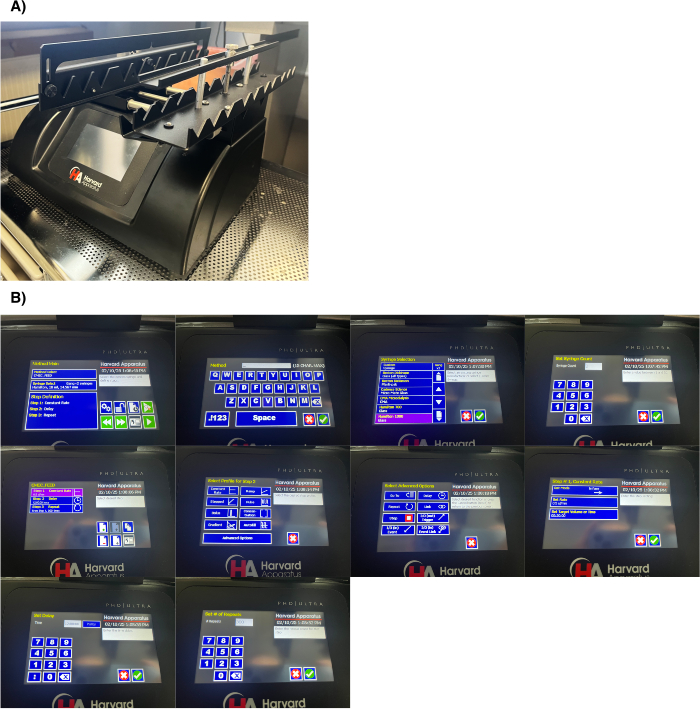
Figure 4. Automated syringe pump setup for medium replenishment and shear flow induction. (A) Programmable syringe pump equipped with an extension rack enabling simultaneous operation of multiple syringes connected to microfluidic chips. (B) Representative screen-by-screen workflow used to configure automated infusion protocols, including method creation, syringe selection, flow rate programming, pause intervals, and repeat cycles for automated medium replenishment and shear flow application. Screens are representative of the syringe pump model used in this study and may differ between manufacturers. Please click here to view a larger version of this figure.
6. Introduction of Constant Shear Flow
- Programming the syringe pump for constant flow
NOTE: Detailed syringe pump programming instructions are provided in Supplementary Table 3.- Maintain endothelial cell cultures initially under static conditions using only the programmed feeding protocol described in Step 5.5. Continue static culture until endothelial cells begin to proliferate and exhibit early 3D growth characteristics.
- Introduce shear flow gradually to minimize endothelial cell detachment and allow adaptation to continuous flow conditions.
NOTE: In this study, constant shear flow was introduced at least 48 h prior to any further experimental procedures. - Monitor endothelial cell morphology regularly using brightfield microscopy throughout shear flow conditioning. Measure TEER every 1–3 days during shear flow conditioning to assess progression of endothelial barrier integrity.
NOTE: The following flow conditioning protocol was developed for hCMEC/D3 endothelial cells cultured under the conditions described in this study. Different cell types and culture conditions may require optimization of flow rates and exposure durations.
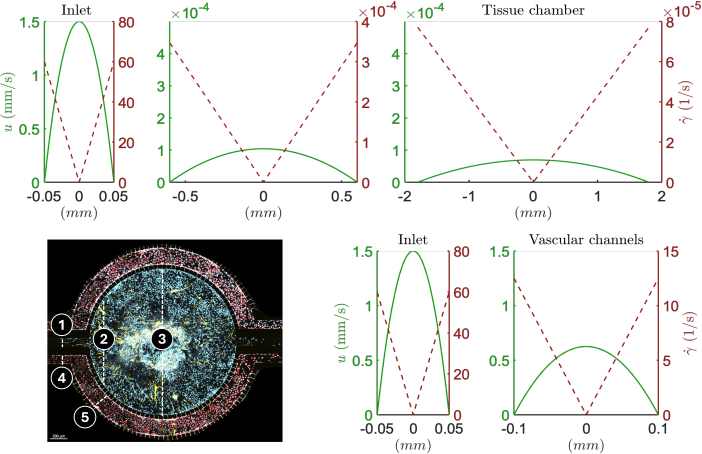
Figure 5. Representative fluid mechanics calculations and estimated flow profiles within the BBB microfluidic chip. Representative velocity (u, mm/s) and shear rate (γ·, s⁻1) profiles calculated for five regions of the microfluidic device under idealized steady state Poiseuille flow assumptions. Profiles correspond to the labeled locations shown on the chip schematic: (1) basolateral chamber inlet, (2) basolateral chamber entry region, (3) center of the basolateral chamber, (4) apical vascular channel inlet, and (5) apical vascular channel cross-section. Solid green lines represent calculated velocity profiles and dashed red lines represent calculated shear rate profiles. Calculations assume incompressible Newtonian flow and do not account for resistance introduced by cell growth, extracellular matrix deposition, or other biological factors. Flow calculations were performed using a volumetric flow rate of 0.0083 mm3/s (0.5 µL/min). Please click here to view a larger version of this figure.
7. Culturing of Primary Astrocytes
- Preparation and maintenance of astrocyte cultures
NOTE: Additional information regarding astrocyte culture is provided in Supplementary Table 1, Note 5.- Prepare astrocyte culture medium supplemented with the manufacturer-provided astrocyte supplement kit.
- Coat T175 culture flasks with poly-L-lysine (PLL) at 2 µg/cm2 (35 µL of 10 mg/mL PLL stock diluted in 13 mL PBS per flask). Incubate the coated flasks for 1 h at 37°C.
- Remove the PLL solution and wash the flasks twice with PBS. Add 10 mL of supplemented astrocyte culture medium to each flask.
- Thawing and expansion of primary astrocytes
- Remove a vial of frozen astrocytes from liquid nitrogen storage and thaw rapidly in a 37°C water bath. Transfer the thawed cells dropwise into a 15 mL conical tube containing 9 mL of astrocyte culture medium.
- Transfer the cell suspension into PLL-coated T175 culture flasks.
- Routine maintenance and passaging of astrocytes
- Replace astrocyte culture medium every 2–3 days until cultures reach approximately 90% confluence. Wash the cells twice with 10 mL PBS.
- Prepare a detachment solution consisting of 5 mL trypsin/EDTA and 5 mL PBS. Add the detachment solution to the culture flask and incubate for 5 min at 37°C. Transfer detached cells into a 50 mL conical tube containing 5 mL fetal bovine serum (FBS).
- Rinse the culture flask with 10 mL trypsin neutralization solution consisting of 1 mL FBS diluted in 9 mL astrocyte culture medium.
- Transfer the rinse solution into the same 50 mL conical tube.
- Centrifuge the cells at 300 × g for 5 min. Resuspend the cell pellet and determine cell concentration using a hemocytometer or equivalent cell counting method.
- Seed cells equally into PLL-coated T175 culture flasks for continued expansion.
- Preparation of astrocytes for microfluidic chip seeding
- Prepare astrocytes at a final concentration of 1 × 10⁷ cells/mL before seeding into the microfluidic chip.
- Do not use astrocytes beyond passage 4.
8. Astrocyte Seeding
- Detachment and preparation of astrocytes
- Detach astrocytes from one T175 culture flask at approximately 90% confluence using the procedure described in Step 7.3.
- Resuspend the cell pellet in astrocyte culture medium. Adjust the resuspension volume according to the number of chips being seeded (e.g., 333.3 µL for one chip or 1 mL for three chips).
- Pipette the suspension gently up and down to disperse visible cell aggregates.
- Determine the cell concentration using a hemocytometer or automated cell counter.
- Transfer the astrocyte suspension into a sterile microcentrifuge tube for immediate use.
- Store the microcentrifuge tube in a 37°C, 5% CO₂ incubator between chip seedings.
- Mix the suspension by gentle inversion or flicking before each aspiration step to maintain a uniform cell distribution.
- Complete all chip seedings within 30 min of final resuspension.
- Seeding astrocytes into the basolateral channel
- Remove the humidity box containing the microfluidic chip from the incubator and disinfect the external surface using 70% ethanol.
- Transfer the humidity box to a biosafety cabinet.
- Seed one chip at a time when preparing multiple devices.
- Remove the chip from the humidity box and place it on a hot plate set to 37°C.
- Attach 8 cm of Tygon tubing to a 1 mL syringe and needle.
- Remove the astrocyte suspension from the incubator and disinfect the external surface of the microcentrifuge tube using 70% ethanol before placing it in the biosafety cabinet.
- Mix the astrocyte suspension by gentle inversion or flicking immediately before aspiration.
- Aspirate the astrocyte suspension into the tubing and syringe until approximately 100 µL remains within the syringe barrel.
- Return the remaining astrocyte suspension to the incubator between chip seedings.
- Remove the clamp from the outlet tubing connected to the basolateral channel.
- Apply a drop of astrocyte culture medium around the inlet tubing and gently remove the tubing.
- Depress the syringe plunger gently until a visible droplet forms at the tubing outlet.
- Insert the tubing into the inlet port connected to the basolateral channel.
- Slowly depress the syringe plunger until approximately three drops emerge from the outlet tubing.
- Reapply the clamp to the outlet tubing.
- Cut the inlet tubing and apply a clamp to the remaining tubing attached to the chip.
- Examine the basolateral chamber under a microscope and confirm that astrocyte coverage is approximately 70% or greater and evenly distributed throughout the chamber.
- Repeat Steps 8.2.10–8.2.16 if cell coverage remains sparse or uneven.
NOTE: Minor adjustments to the attached tubing, similar to those described in Step 4.2.16, may be used to improve cell distribution while monitoring the chamber under a microscope. - Return the chip to the humidity box once adequate astrocyte coverage has been achieved.
- Transfer the humidity box to a 37°C, 5% CO₂ incubator.
- Incubate for at least 4 h, or until cell attachment is observed, before replenishing the culture medium.
NOTE: Overnight incubation (12–18 h) before medium replenishment is acceptable.
- Manual replenishment of astrocyte culture medium
- Replenish medium in the basolateral channel every 12–24 h using the perfusion procedure described in Steps 8.2.10–8.2.16, substituting astrocyte culture medium for the cell suspension.
NOTE: Perform medium replenishment gently to minimize astrocyte disruption or detachment. - Maintain chips in the humidity box within a 37°C, 5% CO₂ incubator and monitor astrocyte growth regularly using microscopy.
- Replenish medium in the basolateral channel every 12–24 h using the perfusion procedure described in Steps 8.2.10–8.2.16, substituting astrocyte culture medium for the cell suspension.
- Optional automated replenishment of astrocyte culture medium
- Automated medium replenishment using a syringe pump may be performed as described in Supplementary Table 4.
9. Fluid Mechanics Analysis (Supplementary Information)
NOTE: Representative fluid dynamics calculations, velocity profiles, shear rate profiles, equations, assumptions, and wall shear stress calculations are provided in Supplementary Table 5 and Figure 5. These calculations are based on idealized Poiseuille flow assumptions12 and provide theoretical estimates of flow behavior within the microfluidic device. The calculations were not experimentally validated.
10. Fixation with PFA and Immunofluorescent Staining
NOTE: Perform fixation, staining, and imaging only after establishment of a stable 3D culture. Before fixation, disconnect the chip from the syringe pump by cutting the tubing attached to the syringes while leaving approximately 6 cm of tubing connected to the chip. Remove outlet tubing from the waste tubes and clamp all tubing until fixation begins.
CAUTION: PFA is toxic and should be handled inside a certified biosafety cabinet or chemical fume hood while wearing appropriate personal protective equipment, including gloves, lab coat, and eye protection. Dispose of PFA waste according to institutional chemical safety procedures.
- Fixation
- Fill a sterile 1 mL syringe with PBS and attach approximately 20 cm of tubing.
- Exchange tubing using the procedure described previously, ensuring that a droplet of fluid surrounds the tubing before removal and that a visible droplet is present at the tubing tip before insertion to minimize introduction of air bubbles.
- Remove the clamps from the inlet and outlet tubing connected to one outer apical channel.
- Perfuse the channel gently with PBS until approximately three drops emerge from the outlet tubing.
- Clamp the outlet tubing and then cut and clamp the tubing connected to the syringe.
- Repeat Steps 10.1.1–10.1.5 for all remaining channels.
- Repeat Steps 10.1.1–10.1.6 using freshly prepared 4% PFA (prepared by diluting stock PFA 1:8 in PBS) instead of PBS.
- Incubate the chip at room temperature (18°C–22°C) for 15 min.
- Repeat Steps 10.1.1–10.1.6 using PBS to remove residual PFA from all channels.
- Wash each channel twice with PBS using approximately 2–3 channel volumes per wash.
NOTE: Ice-cold methanol fixation may improve membrane-associated staining of tight junction proteins compared with PFA fixation13.
- Immunofluorescent staining
NOTE: Perform all perfusion steps using the procedure described in Step 10.1.1-10.1.6. Use separate syringes, needles, and tubing for each reagent where possible. Immunofluorescent reagents and antibody dilutions are listed in Table 1.- Perfuse each channel with permeabilization solution containing 0.1% Triton X-100 and 1% (w/v) bovine serum albumin (BSA).
- Incubate the chip at room temperature for 30 min. Wash each channel once with PBS.
- Perfuse each channel with neat Dako blocking solution. Incubate the chip at room temperature for 5 min.
- Perfuse the outer apical channels with primary antibodies diluted in permeabilization solution to stain endothelial cell markers, including cluster of differentiation 31 (CD31), zonula occludens-1 (ZO-1), and DAPI.
- Perfuse the basolateral channel with primary antibodies diluted in permeabilization solution to stain astrocyte markers, including glial fibrillary acidic protein (GFAP) and DAPI.
- Confirm complete reagent exchange by perfusing sufficient volume to fill the channels and tubing, as indicated by approximately three drops (~10 µL/drop) emerging from the outlet tubing. Use antibody dilutions listed in Table 1.
NOTE: When using antibodies for the first time on these cell types, perform preliminary optimization or titration experiments using standard cell culture plates to determine optimal staining conditions. - Incubate the chip at 4°C overnight (12–18 h) in the dark.
- Wash each channel three times with PBS to remove unbound primary antibodies.
- Perfuse the relevant channels with species-appropriate secondary antibodies diluted in permeabilization solution. Use secondary antibody dilutions listed in Table 1.
- Incubate the chip at room temperature for 1 h in the dark. Wash each channel three times with PBS to remove unbound secondary antibodies. Store the chip protected from light at 4°C until imaging is performed (within 3 days).
| Target | Antibody/Reagent | Host Species | Fluorochrome / Conjugate | Fluorescence Channel | Working Dilution |
| Cluster of differentiation 31 (CD31) | Thermo Fisher Scientific, Cat. No. 558068 | Mouse | Alexa Fluor 488-conjugated | Green | 1:100 |
| Zonula occludens-1 (ZO-1) | Invitrogen, Cat. No. 40-2200 | Rabbit | Unconjugated; detected using secondary antibody | N/A | 1:100 |
| Rabbit IgG secondary antibody | Invitrogen, Cat. No. A31573 | Donkey | Alexa Fluor 647-conjugated | Red | 1:500 |
| Glial fibrillary acidic protein (GFAP) | Thermo Fisher Scientific, Cat. No. 41-9892-82 | Mouse | eFluor 570-conjugated | Yellow | 1:200 |
| 4′,6-diamidino-2-phenylindole (DAPI) | Merck, Cat. No. 5087410001 | N/A | N/A | Blue | 1:1000 |
Table 1: Immunofluorescent staining reagents used for characterization of endothelial cells and astrocytes within the BBB microfluidic chip model. The table lists the primary antibodies, secondary antibodies, fluorochrome conjugates, fluorescence channels, and working dilutions used for immunofluorescent staining and confocal imaging of hCMEC/D3 and human primary astrocytes cultured within the BBB microfluidic chip. Antibodies were diluted in permeabilization solution and applied according to the staining procedure described in the Protocol. Fluorescence channel assignments correspond to the representative images shown in Figure 6.
11. Imaging by confocal microscopy
- Acquire immunofluorescent images of stained microfluidic chip cultures using confocal microscopy. Representative microscope settings are provided in Supplementary Tables 6 and 7.
NOTE: Supplementary Table 6 contains microscope hardware and acquisition settings. Supplementary Table 7 contains fluorophore excitation/emission parameters and image acquisition settings used in this study.
Results
Development of a Co-culture BBB Microfluidic Model
The protocol described above provides a step-by-step method for developing a co-culture BBB microfluidic model containing immortalized hCMEC/D3 endothelial cells and primary human astrocytes. Figure 3 presents representative images of cell culture progression within the microfluidic device, including the target endothelial cell density during the seeding process and an example of endothelial cell detachment representing a failed culture outcome. The development and morphology of each cell population depend on successful cell attachment, uniform seeding, and tolerance to shear flow following introduction into the device. Therefore, the appearance of a mature 3D culture may vary between experiments and should not be expected at a fixed time point. Instead, culture progression should be monitored routinely using visual assessment and TEER measurements to determine whether the model is suitable for progression to subsequent experimental stages.
Representative TEER measurements exceeding 50 kΩ were consistently associated with stable endothelial cell growth and 3D lumen formation under the conditions described in this study. However, acceptable TEER thresholds may vary depending on the experimental application, cell passage number, and flow conditions used. Chips demonstrating substantial endothelial cell detachment, inconsistent TEER progression, persistent air bubbles, or non-uniform cell distribution should be excluded from downstream experiments. Once a stable co-culture has been established, additional downstream analyses, including immunofluorescent staining and imaging, can be performed to characterize cellular morphology and marker expression within the model.
Characterization of the BBB Microfluidic Model
The co-culture BBB microfluidic model was characterized by immunofluorescent staining and confocal imaging of endothelial cell and astrocyte markers (Figure 6A). The tight junction protein ZO-1 was observed throughout the hCMEC/D3 endothelial cell layer within the apical channels, while the endothelial cell marker CD31 was also detected within the endothelial cell population. Human primary astrocytes cultured within the basolateral chamber expressed GFAP, confirming astrocyte identity under the culture conditions used in this study. Representative immunofluorescent images demonstrated extension of astrocytic processes through the micropillars separating the apical and basolateral compartments, indicating the potential for physical interaction between the two cellular compartments in addition to soluble factor exchange. Figure 6B shows a representative cross-sectional z-stack image of the apical channel, demonstrating progression of the endothelial cell layer toward a lumen-like morphology surrounding the perimeter of the channel. These observations are qualitative and representative of the culture morphology obtained under the described experimental conditions.
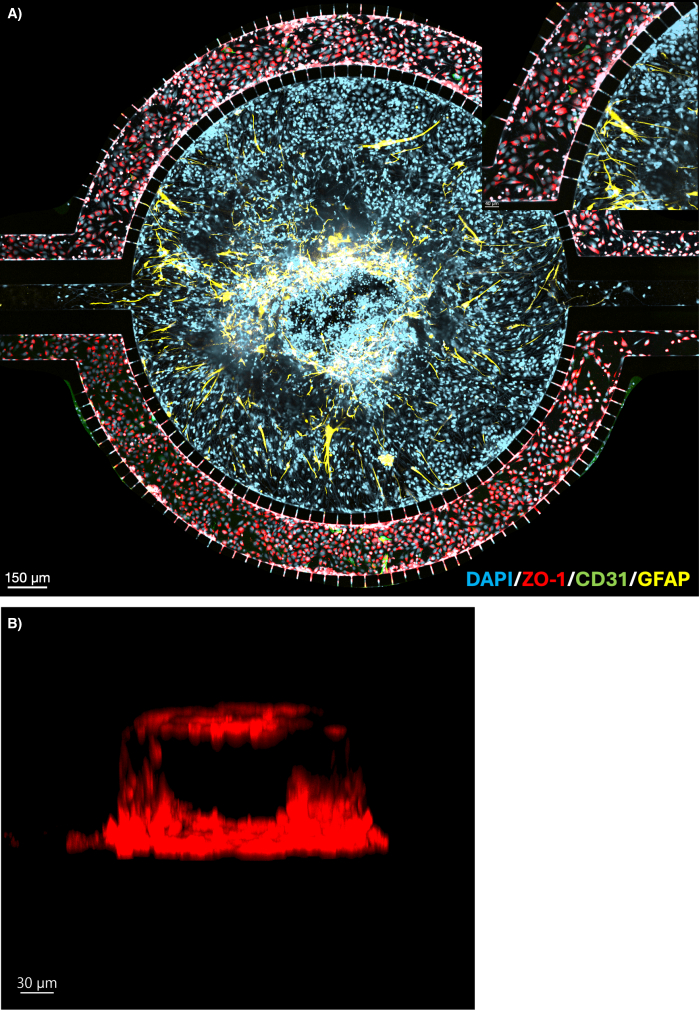
Figure 6. Immunofluorescent characterization of the co-culture BBB microfluidic chip model. (A) Representative confocal image showing organization of the endothelial–astrocyte co-culture within the microfluidic chip. hCMEC/D3 lining the apical vascular channels express the endothelial marker cluster of differentiation 31 (CD31; green) and the tight junction protein zonula occludens-1 (ZO-1; red). Human primary astrocytes within the basolateral chamber express glial fibrillary acidic protein (GFAP; yellow). Cell nuclei were counterstained with 4′,6-diamidino-2-phenylindole (DAPI; blue). Representative astrocytic projections extending toward the vascular channels through the micropillar interface are visible. Non-channel regions of the device were digitally masked during image processing to improve visualization of the regions of interest. Scale bar = 200 µm. (Inset) Higher magnification view of endothelial cell organization within the vascular channel. (B) Representative confocal z-stack cross-sectional reconstruction demonstrating lumen formation within the apical vascular channel. Scale bar = 30 µm. Images were acquired using a Leica DMi8 inverted microscope coupled with an Andor Dragonfly spinning-disk confocal imaging system. Please click here to view a larger version of this figure.
Throughout development of the co-culture model, TEER measurements were used as a non-destructive indicator of endothelial barrier formation and culture integrity. Figure 2B presents representative TEER measurements collected from day 4 to day 10 following endothelial cell seeding. Under the conditions described in this protocol, all representative apical channels exceeded 100 kΩ by day 10, with some channels approaching 300 kΩ. TEER measurements should be interpreted alongside morphological assessment of the cultures, as values may be influenced by factors including electrode placement, air bubbles, cell density, and shear flow conditions. For the hCMEC/D3 cultures described here, TEER values above 50 kΩ were consistently associated with stable 3D endothelial growth. However, TEER values alone do not directly measure molecular permeability or transporter function, and additional functional assays may be required depending on the intended downstream application of the model.
Fluid Mechanics
Velocity and shear rate profiles were estimated under idealized flow assumptions, as described in the Fluid Mechanics Calculations section and shown in Figure 5. These calculations represent theoretical estimates only and were not experimentally validated using direct flow or shear stress measurements.
Based on the calculated profiles, the estimated wall shear stress near the entry region of the basolateral chamber (Point 2, Figure 5) was approximately 0.24 mPa (approximately 0.0024 dyne/cm2) and decreased further within the middle region of the basolateral chamber (approximately 0.00054 dyne/cm2 at Point 3, Figure 5). These low predicted shear stress conditions suggest that astrocytes within the basolateral chamber are exposed to near-quiescent flow during medium replenishment cycles, which may support cell attachment and proliferation under the conditions used in this study.
In contrast, endothelial cells cultured within the outer apical vascular channels were exposed to substantially higher estimated shear stresses, with maximum predicted wall shear stress values reaching approximately 41 mPa (approximately 0.41 dyne/cm2) at a flow rate of 0.5 µL/min. These conditions were selected to promote endothelial cell alignment, 3D lumen formation, and increased tight junction expression during culture progression.
The calculated shear stress values are dependent on the assumptions of Newtonian fluid behavior, steady laminar flow, idealized channel geometry, and the absence of flow resistance caused by cell proliferation or extracellular matrix deposition. Consequently, actual flow conditions within the microfluidic device may differ from the theoretical estimates presented here.
Supplementary Figure 1. Workflow for establishment of the co-culture BBB microfluidic chip model. Representative workflow illustrating the sequential stages used to establish the endothelial cell–astrocyte co-culture BBB microfluidic model, including endothelial cell expansion, nitrogen priming, basement membrane coating, background TEER measurement, endothelial cell seeding, endothelial cell culture and monitoring, astrocyte seeding, introduction of gradual shear flow, and downstream experimental applications. Approximate culture timelines and progression from static culture to continuous shear flow conditioning are shown. Typical experimental endpoints include TEER measurements, immunofluorescence imaging, gene expression analysis, pathogen infection studies, and therapeutic or drug screening applications.Please click here to download this file.
Supplementary Figure 2. Relative expression of endothelial cell tight junction and adherens junction genes in microfluidic BBB chips. Relative gene expression of zonula occludens-1 (TJP1/ZO-1), claudin-5 (CLDN5), vascular endothelial cadherin (CDH5/VE-cadherin), and occludin (OCLN) was measured in hCMEC/D3 endothelial cells cultured within microfluidic BBB chips. Gene expression values were normalized to ACTB expression and are presented on a logarithmic scale. Individual colored data points represent separate apical channels obtained from three independent microfluidic chips (1L, 1R, 2L, 2R, 3L, and 3R), with two technical replicates analyzed per channel. Total RNA was isolated using TRIzol reagent, RNA quality was assessed by NanoDrop spectrophotometry, and gene expression was quantified using a one-step reverse transcription quantitative polymerase chain reaction (RT-qPCR) system. Primer/probe information is provided in the Table of Materials. Thermal-cycling conditions consisted of reverse transcription at 45°C for 15 min, initial denaturation at 95°C for 2 min, followed by 45 amplification cycles of 95°C for 3 s and 55°C for 30 s. Boxes indicate the interquartile range, center lines indicate the median, and whiskers indicate the minimum and maximum values.Please click here to download this file.
Supplementary Table 1. Additional methodological notes supporting the development and operation of the microfluidic BBB model. The table provides supplementary information related to cell culture, nitrogen priming, microfluidic device quality control, humidity box preparation, and astrocyte culture that supports reproducibility of the protocol. These notes are intended to complement, but not replace, the procedural steps described in the main Protocol.Please click here to download this file.
Supplementary Table 2. Representative syringe pump programming workflow used to automate periodic medium replenishment within the apical endothelial channels before the introduction of continuous shear flow. The workflow was optimized for the experimental conditions used in this study, including tubing dimensions, coating conditions, and cell type. Modifications to these parameters may require further optimization of the programmed feeding schedule. Programming interfaces and terminology may vary between syringe pump manufacturers. Users should adapt the workflow as required for their specific syringe pump system.Please click here to download this file.
Supplementary Table 3. Representative syringe pump programming workflow used to gradually introduce continuous shear flow to endothelial cell cultures within the microfluidic BBB model. Flow rates were increased incrementally to minimize endothelial cell detachment and allow adaptation to flow conditions. The table includes representative flow-conditioning steps and corresponding medium delivery volumes. Final programmed volumes should be verified according to the syringe size, flow-conditioning parameters, and experimental requirements used. All flow-conditioning parameters are representative of the conditions used in this study and may require optimization for alternative cell types, microfluidic devices, or culture conditions.Please click here to download this file.
Supplementary Table 4. Representative syringe pump programming workflow used to automate medium replenishment within the basolateral astrocyte channel of the microfluidic BBB model. The workflow consists of periodic medium infusion followed by extended pause intervals to minimize disturbance of the astrocyte culture. Automated replenishment was included as an optional procedure and was not experimentally validated against manual medium replacement. Users adopting automated astrocyte feeding should independently verify astrocyte viability, morphology, and culture performance under their specific experimental conditions.Please click here to download this file.
Supplementary Table 5. Representative fluid mechanics calculations used to estimate velocity, shear rate, and wall shear stress profiles within the microfluidic BBB device. Calculations were performed for the basolateral astrocyte chamber and apical vascular channels using idealized assumptions of Newtonian fluid behavior and laminar flow. These calculations are intended to provide theoretical estimates of flow characteristics under the experimental conditions used in this study and were not experimentally validated. Calculated values do not account for changes in flow resistance associated with cell growth, extracellular matrix deposition, channel fouling, or other biological factors that may occur during culture.Please click here to download this file.
Supplementary Table 6. Confocal microscopy setup and image acquisition workflow used for imaging microfluidic BBB cultures. The table summarizes microscope configuration, fluorescence channel setup, image acquisition procedures, and image processing considerations used during imaging experiments. Detailed acquisition parameters used in this study are provided in Supplementary Table 7. Any image processing, masking, segmentation, or visualization adjustments applied to representative images should be disclosed in the corresponding figure legends and should not alter the biological interpretation of the data.Please click here to download this file.
Supplementary Table 7. Representative imaging acquisition, processing, and analysis parameters used for confocal microscopy of microfluidic BBB cultures. Images were acquired using a Leica DMi8 inverted microscope coupled with an Andor Dragonfly spinning-disk confocal imaging system. Acquisition settings, fluorescence channel configurations, software versions, and image processing procedures used to generate representative images are summarized. Identical acquisition settings were maintained within experimental comparisons wherever possible to minimize imaging related variability. Image processing procedures were applied for visualization purposes only. Any masking, segmentation, stitching, projection, or intensity adjustment steps should be reported transparently and interpreted in the context of the original image data.Please click here to download this file.
Discussion
Research involving the BBB remains challenging because of the limited availability of reproducible and physiologically relevant experimental models. This paper describes a co-culture BBB microfluidic chip protocol using immortalized hCMEC/D3 endothelial cells and primary human astrocytes. In contrast to traditional static systems, such as Transwell models, this protocol incorporates programmable shear flow using syringe pumps to partially replicate selected physiological features of the BBB within an in vitro environment. Although static BBB models, including porcine-based systems, can produce high TEER values and remain valuable alternatives14, shear flow has been shown to influence endothelial cell differentiation, tight junction formation, transporter expression, and metabolic regulation associated with BBB phenotypes9.
Using simplified fluid mechanics calculations under idealized flow assumptions, the theoretical upper limits of shear rates and shear stresses experienced by cells within the microfluidic device can be estimated. These calculations provide a useful framework for comparing feeding and culture conditions between studies rather than relying solely on manufacturer-provided flow metrics. The velocity and shear rate profiles shown in Figure 5 demonstrate that flow behavior differs substantially between the outer apical channels and the inner basolateral chamber, highlighting the influence of device geometry on local flow conditions and predicted cellular shear exposure. Consequently, direct comparison of syringe pump flow rates alone may not accurately reflect the shear stresses experienced by endothelial cells across different microfluidic platforms. The estimated shear flow conditions in this model are lower than those reported for some smaller microvascular systems and may be more representative of larger microvessels or post-capillary venules15. Careful optimization of flow conditions is important because excessive shear stress has been associated with endothelial disruption and altered BBB integrity16,17. Therefore, when implementing flow-based BBB microfluidic systems, users should consider the potential effects of shear stress on endothelial cell stability, barrier formation, and experimental interpretation. The theoretical calculations presented here assume Newtonian fluid behavior, ideal laminar flow, and the absence of resistance caused by cell proliferation or extracellular matrix deposition. As a result, actual flow conditions within the device may differ from the predicted values, and further experimental validation may be required depending on the intended application of the model.
There are numerous microfluidic device designs available for BBB modeling, including commercially available platforms such as the chip used in this study. Commercially produced systems may improve accessibility and reduce the technical challenges associated with in-house device fabrication; however, these platforms are often dependent on fixed chip geometries, electrode layouts, and flow configurations that may limit direct transferability of protocols between systems. Consequently, the protocol described here is specific to the device architecture used in this study and may require optimization when applied to alternative microfluidic platforms. Successful development of a stable 3D endothelial culture was strongly influenced by the quality of initial cell seeding, basement membrane coating consistency, and gradual introduction of shear flow. Variability between experiments was observed during optimization of the protocol, particularly following initiation of flow, where endothelial cell detachment represented one of the most common causes of culture failure. Under the conditions described in this study, cultures in which more than approximately 50% of previously adherent endothelial cells detached following flow introduction were considered failed cultures and excluded from downstream analysis. The composition and handling of basement membrane coatings also substantially influenced endothelial cell attachment and progression toward 3D growth.
The impedance analyzer used for TEER measurements in this study exhibited some variability between repeated measurements. Although electrode placement in this system may be less variable than in conventional Transwell systems because the electrodes are inserted through dedicated ports, minor differences in electrode positioning may still contribute to measurement variability. To minimize this effect, repeated TEER measurements were collected and averaged for each channel and frequency condition. Accurate electrode positioning also depends on trimming the electrode port tubing to a length that allows the electrodes to contact the glass bottom of the device. Repeated insertion and removal of electrodes may introduce small air bubbles into the system, which can interfere with impedance measurements and artificially alter TEER values. One approach proposed to reduce variability and minimize disruption during repeated measurements is the incorporation of embedded electrodes directly into the structure of microfluidic devices18. Temperature fluctuations may also influence TEER measurements19. To reduce variability, chips were equilibrated on a 37°C hot plate prior to measurement.
It should be noted that hCMEC/D3 cells, although widely used and validated for human BBB modeling, demonstrated reduced tolerance to prolonged shear flow exposure under the conditions used in this study. Previous reports indicate that hCMEC/D3 cells generally maintain their endothelial characteristics up to approximately passage 3511,20, which is why this protocol recommends avoiding use beyond this passage number. Passage number, shear flow duration, and endothelial cell morphology should therefore be carefully monitored throughout culture progression when using this cell line in flow-based BBB systems. Induced pluripotent stem cell (iPSC)-derived brain-like endothelial cells are increasingly being incorporated into BBB microfluidic models because they may provide a scalable alternative to primary endothelial cells, particularly in protocols requiring high cell densities. However, differentiation protocols for iPSC-derived brain-like endothelial cells remain variable, and some published methods have reported incomplete endothelial phenotypes, altered transcriptional profiles, or expression of epithelial-associated markers and proteins21. Consequently, further validation and standardization of iPSC-derived endothelial cell protocols is still required before widespread implementation in shear flow BBB microfluidic systems.
This model has multiple downstream applications beyond the scope of the present protocol. For example, cells cultured within the microfluidic chip may be detached for RNA extraction and downstream quantitative polymerase chain reaction (qPCR) analysis (Supplementary Figure 2), which can provide an additional method for assessing expression of tight junction proteins and other genes of interest22. In the present study, barrier integrity was primarily assessed using TEER; however, permeability assays using fluorescent tracers may also be incorporated to calculate permeability coefficients and further evaluate barrier function10,22,23. Measurement of efflux transporter activity, including P-glycoprotein and breast cancer resistance protein, may also be relevant for pharmacological and drug screening applications24. Additionally, material selection should be considered carefully in drug screening studies because PDMS may absorb hydrophobic compounds25. Microfluidic BBB systems similar to the platform described here have been applied to therapeutic testing26,27, leukocyte migration studies28,29, and investigations of infectious agent interactions with the BBB. Previous studies have also reported multicompartment microfluidic platforms incorporating endothelial cells, astrocytes, microglia, and neurons to model more complex neurovascular interactions, including immune cell migration following herpes simplex virus type 1 infection30. However, those authors acknowledged that their system operated under static conditions. The model presented in this paper incorporates endothelial cells and astrocytes only and therefore represents a simplified endothelial–astrocyte BBB co-culture model rather than a complete NVU. Additional cell populations, including pericytes, microglia, and neurons, are not included in the present protocol, despite their recognized contributions to BBB maturation, tight junction regulation, and long-term barrier stability31. Future optimization of this protocol may therefore involve incorporation of additional neurovascular cell types to further improve physiological relevance. In conclusion, microfluidic chip–based BBB models provide new opportunities for studying complex neurovascular interactions in controlled in vitro systems. The protocol described in this paper presents a shear flow–based endothelial–astrocyte co-culture BBB microfluidic model incorporating immortalized hCMEC/D3 endothelial cells and primary human astrocytes. The model demonstrates expression of key BBB-associated markers and reproducible TEER measurements under dynamic flow conditions. Although the present model does not fully replicate the complete NVU, the protocol provides a reproducible and adaptable platform that may be further modified for applications including barrier function assessment, drug screening studies, and investigations of cellular interactions at the BBB.
Disclosures
Conflict of Interest:
G.F. is the former President and Chief Executive Officer of SynVivo Inc., and J.M.R. is an employee of SynVivo Inc., the company that develops and commercializes the microfluidic organ-on-chip devices used in this study.
The authors declare that this work describes one approach for modeling the blood–brain barrier and does not constitute endorsement or recommendation of any specific commercial technology or product. Use of trade names or manufacturer names is for identification purposes only and does not imply endorsement.
Laboratory work was performed at the Clinical Sciences Centre, Aintree Hospital, Liverpool, in affiliation with the University of Liverpool. Confocal imaging was performed at the Centre for Cell Imaging, University of Liverpool.
Acknowledgements
S.A.B. is supported by the University of Liverpool Health and Life Sciences Faculty Supported Studentship Fund. F.E.N. is supported by the Wellcome Accelerator Award (315711/Z/24/Z).
C.D. and S.A.B. are supported by The Pandemic Institute/Defence Science and Technology Laboratory (DSTL) Pump Priming Grant (TPI/DSTL/TPI FA010 B Michael UoL). B.D.M. is supported by UK Research and Innovation/Medical Research Council (UKRI/MRC; MR/V03605X/1), the National Institute for Health and Care Research (NIHR; award CO-CIN-01), the Medical Research Council (MC_PC_19059), the NIHR Health Protection Research Unit (HPRU) in Emerging and Zoonotic Infections at the University of Liverpool in partnership with the UK Health Security Agency (UKHSA), in collaboration with the Liverpool School of Tropical Medicine and the University of Oxford (award 200907), the NIHR HPRU in Respiratory Infections at Imperial College London with UKHSA (award 200927), the MRC/UKRI (MR/V007181/1), the MRC (MR/T028750/1), and Wellcome (ISSF201902/3).
S.T.J.R. is supported by a Brain Research UK Project Grant, a Thrasher Child Health Early Career Award, an Academy of Medical Sciences Starter Grant, and a European Society for Paediatric Infectious Diseases Diagnostic Grant. S.T.J.R. is also an Olink-48 Grant Prize winner and a member of the Early Career Research Committee at the Wellcome Centre for Human Genetics, University of Oxford.
This study was funded by the NIHR Health Protection Research Unit in Emerging and Zoonotic Infections (NIHR207393). The views expressed are those of the authors and not necessarily those of the NIHR, the Department of Health and Social Care, or affiliated institutions.
The authors acknowledge the Liverpool Centre for Cell Imaging, University of Liverpool, for access to the Andor Dragonfly spinning-disk confocal microscope funded by Biotechnology and Biological Sciences Research Council (BBSRC) grant BB/R01390X/1.
The authors also acknowledge partial publication funding support from SynVivo Inc. SynVivo Inc. had no role in the experimental design, data collection, data analysis, data interpretation, manuscript preparation, or publication decision.
S.A.B. performed all experimental procedures. All authors contributed feedback and manuscript revisions.
A.P. is supported by a Springboard Award by the Academy of Medical Sciences, the Wellcome Trust, the Government Department of Business, Energy and Industrial Strategy and the British Heart Foundation and Diabetes UK (SBF008\1135)
Materials
| Name | Company | Catalog Number | Comments |
|---|---|---|---|
| 1 mL pipette tip box (empty; humidity box) | Fisher Scientific | 11973466 | Used as a sterile humidity chamber to prevent evaporation during chip incubation. |
| 15 mL conical tube | Fisher Scientific | 10263041 | Used for cell thawing, centrifugation, and preparation of cell suspensions. |
| 50 mL conical tube | Fisher Scientific | 10788561 | Used for media preparation, centrifugation, and reagent handling. |
| Alexa Fluor 647 secondary antibody | Invitrogen | A351573 | Used for fluorescent detection of tight-junction proteins such as ZO-1; dilution 1:500. |
| Astrocyte medium complete kit | ScienCell | SC-1801 | Used for culturing and maintaining primary human astrocytes. Proprietary supplements included. |
| Bovine serum albumin (BSA) | Fisher Scientific | BP-9701-100 | Used in permeabilization and blocking solutions during immunofluorescent staining. |
| Calibration resistors (200 kΩ, 49.9 kΩ, 28 kΩ) | SynVivo | 402002 | Used for impedance analyser calibration during TEER measurements. |
| Cell strainer (40 µm) | Fisher Scientific | 439600 | Used to remove cell aggregates before microfluidic-chip seeding. |
| CD31 primary antibody | BD Bioscience | 558068 | Used to stain endothelial cell marker CD31 during immunofluorescence. |
| Clamps | SynVivo | 202001 | Used to close tubing lines and prevent unwanted fluid flow or air entry. |
| Collagen type I (rat tail) | Thermo Fisher Scientific | A1048301 | Used to coat culture flasks for endothelial cell attachment. |
| CO2 incubator | New Brunswick | Galaxy 170S | Used to maintain humidified culture conditions at 37°C and 5% CO2. |
| Confocal imaging acquisition software | Fusion | Version 2.4.0.22 | Used for acquisition and management of fluorescence imaging datasets. |
| Dako blocking solution | Agilent | X090930-2 | Used to reduce nonspecific antibody binding during staining procedures. |
| DAPI stain | Merck | 5087410001 | Used for nuclear staining during immunofluorescent imaging. |
| Dulbecco’s PBS without calcium and magnesium, without phenol red | Capricorn Scientific | CSR155 | Used for washing, dilution, and perfusion steps. |
| Electrodes | SynVivo | 208002 | Used to perform TEER measurements across endothelial barriers. |
| EndoGRO medium with MV supplement kit | Merck | SCME-BM; SCME004-S | Used for culturing hCMEC/D3 endothelial cells. Complete medium contains 5% fetal bovine serum (FBS), 0.2% EndoGRO-LS supplement, 5 ng/mL rhEGF, 10 mM L-glutamine, 1.0 µg/mL hydrocortisone hemisuccinate, 0.75 U/mL heparin sulfate, and 50 µg/mL ascorbic acid. |
| Ethanol, extra pure | Thermo Fisher Scientific | E-0600DF-17 | Used for sterilization and disinfection of surfaces and equipment. |
| EVOS microscope | Thermo Fisher Scientific | EVOS XL Core | Used for brightfield monitoring of cell growth and chip quality. |
| Fetal bovine serum (FBS) | Merck | 12306C | Used as a supplement for cell-culture media. |
| Fibronectin | SLS | 11533610 | Used in basement-membrane coating mixtures for chip preparation. |
| Gas regulator | BOC | 86753 | Used to regulate nitrogen-gas pressure during chip priming. |
| GFAP primary antibody | Thermo Fisher Scientific | 41-9892-82 | Used to stain astrocyte marker GFAP during immunofluorescence. |
| Glass syringe (1 mL) | Biochrom | 721831 | Used for precise perfusion and cell seeding within microfluidic chips. |
| Glass syringe (10 mL) | Biochrom | 721834 | Used for long-term media perfusion via syringe pumps. |
| Hot plate | Appleton Woods | ST2331 | Used to maintain chips at 37°C during handling outside the incubator. |
| Human cerebral microvascular endothelial cells (hCMEC/D3) | Merck | SCC066 | Used as the endothelial cell component of the BBB model. |
| Human fibronectin | SLS | 356008 | Used as an extracellular matrix component during chip coating. |
| Human primary astrocytes | ScienCell | SC-1800 | Used as the astrocyte component of the BBB co-culture model. |
| Humidity box | Custom setup | N/A | Used to maintain humidity and prevent evaporation during incubations. |
| Impedance analyser | SynVivo | 304001 | Used to measure transendothelial electrical resistance (TEER). |
| Imaris software | Oxford Instruments | Version 9.3 | Used for fluorescence-image visualization and post-processing. |
| Laminin | Bio-Techne | 3400-010-02 | Used as part of the basement-membrane coating mixture. |
| Leica DMi8 microscope | Leica Microsystems | Andor iXon Ultra 888 Ultra EMCCD Camera | Used for confocal fluorescence imaging of stained cultures. |
| Matrigel | SLS | 356231 | Used as an extracellular matrix component during chip coating. |
| Microcentrifuge tube (1.5 mL) | Starlab | S1615-5510 | Used for temporary storage of concentrated cell suspensions. |
| Mycoplasma detection kit | Lonza | LZLT07-118 | Used to confirm cultures are free from Mycoplasma contamination. |
| Needles for syringes | SynVivo | 204002 | Used for fluid transfer and tubing attachment. |
| Nitrogen gas | BOC Gas | UN1066 | Used for pneumatic chip priming and removal of air bubbles. |
| Objective lenses | Leica Microsystems | 11506375 HC FLUOTAR L 25×/0.95 W VISIR | Used for fluorescence and brightfield image acquisition at different magnifications. |
| Paraformaldehyde (PFA) 32% (w/v) | Thermo Fisher Scientific | 047377.9L | Used for fixation of cells prior to immunofluorescent staining. |
| PBS without calcium and magnesium | Thermo Fisher Scientific | 20012-019 | Used for washing cells and preparing reagents. |
| Penicillin/streptomycin | Thermo Fisher Scientific | 15140122 | Used as an antibiotic supplement for cell-culture media. |
| Pneumatic primer | SynVivo | 205001 | Used to introduce nitrogen pressure for chip priming. |
| Poly-L-lysine | ScienCell | SC-0413 | Used to coat culture flasks for astrocyte attachment. |
| Polystyrene block | Any supplier | N/A | Used to support tubing and waste-tube setup within the humidity box. |
| qPCR primer/probe: ACTB | IDT | Hs.PT.39a.22214847 | Used for qPCR normalization/control gene analysis. |
| qPCR primer/probe: CDH5 | IDT | Hs.PT.58.4732035 | Used for endothelial cell marker gene-expression analysis. |
| qPCR primer/probe: CLDN5 | IDT | Hs.PT.58.1483777 | Used for tight-junction gene-expression analysis. |
| qPCR primer/probe: OCLN | IDT | Hs.PT.58.1235048 | Used for occludin gene-expression analysis. |
| qPCR primer/probe: TJP1 | IDT | Hs.PT.58.2456962 | Used for tight-junction protein 1 gene-expression analysis. |
| qPCR system: GoTaq Probe 1-Step RT-qPCR System | Promega | A6120 | Used for reverse-transcription quantitative PCR analysis. |
| Screw-cap macro tubes (5 mL) | Merck | MTCC2530 | Used as waste-collection tubes during chip perfusion. |
| Software: GraphPad Prism | GraphPad | Version 11.0.1 | Used for data analysis and graph preparation. |
| Syringe pump infuse/withdraw programmable | Harvard Apparatus | 70-3007 | Used to automate media perfusion and shear flow application. |
| Syringe pump multirack | Harvard Apparatus | 70-3024A | Used to hold multiple syringes during parallel chip perfusion. |
| SynBBB TEER chip | SynVivo | 102015-SB3 | Used as the microfluidic BBB culture platform. |
| T175 culture flask | Greiner | 660175 | Used for expansion and maintenance of cell cultures. |
| Tape (masking tape) | Any supplier | N/A | Used to secure chips and tubing during inverted incubation. |
| Triton X-100 | Merck | 93443 | Used for cell permeabilization during immunofluorescent staining. |
| TRIzol Reagent | Invitrogen | 15596018 | Used for RNA extraction prior to qPCR analysis. |
| Trypsin-EDTA (0.05%) | Thermo Fisher Scientific | 25300054 | Used for detachment and passaging of cultured cells. |
| Tweezers | Fisher Scientific | 19-062530 | Used for tubing insertion and sterile chip handling. |
| Tygon tubing (0.02 × 0.06 in) | SynVivo | 201001 | Used for fluid transfer between syringes and microfluidic chips. |
| ZO-1 primary antibody | Invitrogen | 40-2200 | Used to stain tight-junction protein ZO-1 during immunofluorescence. |
References
- Abbott NJ, et al. Structure and function of the blood-brain barrier. Neurobiol Dis. 2010;37(1):13-25.
- Boardman SA, et al. Viral infection and the blood-brain barrier: molecular research insights and therapies. J Infect Dis. 2025;232(6):1273-1282.
- Hubrecht RC, Carter E. The 3Rs and humane experimental technique: implementing change. Animals (Basel). 2019;9(10):754.
- Gharib G, et al. Biomedical applications of microfluidic devices: a review. Biosensors (Basel). 2022;12(11):1023.
- Niculescu AG, Chircov C, Bîrcă AC, Grumezescu AM. Fabrication and applications of microfluidic devices: a review. Int J Mol Sci. 2021;22(4):2011.
- Li M, et al. Blood-brain barrier microfluidic chips and their applications. Organs-on-a-Chip. 2023;5:100027.
- Admiraal J, et al. Building the blood-brain barrier: a scalable self-assembling 3D model of the brain microvasculature under unidirectional flow. Fluids Barriers CNS. 2026;23:29.
- DeStefano JG, et al. Effect of shear stress on iPSC-derived human brain microvascular endothelial cells (dhBMECs). Fluids Barriers CNS. 2017;14(1):20.
- Cucullo L, et al. The role of shear stress in blood-brain barrier endothelial physiology. BMC Neurosci. 2011;12:40.
- Brown TD, et al. A microfluidic model of human brain (µHuB) for assessment of blood-brain barrier. Bioeng Transl Med. 2019;4(2).
- Weksler B, Romero IA, Couraud PO. The hCMEC/D3 cell line as a model of the human blood-brain barrier. Fluids Barriers CNS. 2013;10:16.
- Lenk RS. The Hagen-Poiseuille equation and the Rabinowitsch correction. In: Polymer Rheology. Dordrecht: Springer Netherlands; 1978:75-85.
- Lindner M, et al. Flow-induced glycocalyx formation and cell alignment of HUVECs compared to iPSC-derived ECs for tissue engineering applications. Front Cell Dev Biol. 2022;10:953062.
- Patabendige A, Skinner RA, Morgan L, Abbott NJ. A detailed method for preparation of a functional and flexible blood-brain barrier model using porcine brain endothelial cells. Brain Res. 2013;1521:16-30.
- Ballermann BJ, Dardik A, Eng E, Liu A. Shear stress and the endothelium. Kidney Int Suppl. 1998;67.
- Garcia-Polite F, et al. Pulsatility and high shear stress deteriorate barrier phenotype in brain microvascular endothelium. J Cereb Blood Flow Metab. 2017;37(7):2614-25.
- Aryal R, Patabendige A. Blood-brain barrier disruption in atrial fibrillation: a potential contributor to the increased risk of dementia and worsening of stroke outcomes? Open Biol. 2021;11(4):200396.
- Ceccarelli MC, et al. Real-time monitoring of a 3D blood-brain barrier model maturation and integrity with a sensorized microfluidic device. Lab Chip. 2024;24(22):5085-100.
- Ghane N, Jafari R, Valipour Motlagh N. Standardizing TEER measurements in blood-brain barrier-on-chip systems: a systematic review of electrode designs and configurations. Biomimetics. 2026;11(2):119.
- Weksler BB, et al. Blood-brain barrier-specific properties of a human adult brain endothelial cell line. FASEB J. 2005;19(13):1872-1874.
- Lu TM, et al. Pluripotent stem cell-derived epithelium misidentified as brain microvascular endothelium requires ETS factors to acquire vascular fate. Proc Natl Acad Sci U S A. 2021;118(8).
- Campisi M, et al. 3D self-organized microvascular model of the human blood-brain barrier with endothelial cells, pericytes and astrocytes. Biomaterials. 2018;180:117-129.
- Adriani G, et al. A 3D neurovascular microfluidic model consisting of neurons, astrocytes and cerebral endothelial cells as a blood-brain barrier. Lab Chip. 2017;17(3):448-59.
- Bagchi S, et al. In vitro blood-brain barrier models for drug screening and permeation studies: an overview. Drug Des Devel Ther. 2019;13:3591-3605.
- Toepke MW, Beebe DJ. PDMS absorption of small molecules and consequences in microfluidic applications. Lab Chip. 2006;6(12):1484-1486.
- Greene C, et al. NX210c drug candidate peptide strengthens mouse and human blood-brain barriers. Fluids Barriers CNS. 2024;21(1):76.
- Yang JY, et al. Evaluation of drug blood-brain-barrier permeability using a microfluidic chip. Pharmaceutics. 2024;16(5):574.
- Meena M, et al. A microfluidic in vitro three-dimensional dynamic model of the blood-brain barrier to study the transmigration of immune cells. Brain Sci. 2022;12(10):1293.
- Ohbuchi M, et al. Modeling of blood-brain barrier dysfunction and immune cell migration using human BBB-on-a-chip for drug discovery research. Int J Mol Sci. 2024;25(12):6496.
- Zhang M, et al. A microengineered 3D human neurovascular unit model to probe the neuropathogenesis of herpes simplex encephalitis. Nat Commun. 2025;16(1):3701.
- Hajal C, et al. Engineered human blood-brain barrier microfluidic model for vascular permeability analyses. Nat Protoc. 2022;17(1):95-128.
Reprints and Permissions
This article has been published
Video Coming Soon