This protocol presents a microscope-compatible magnetic nano-actuation platform integrating fluorescent superparamagnetic nanoparticles, a calibrated electromagnet, and real-time confocal imaging to remotely and controllably stimulate Schwann cells and dynamically monitor their mechanosensory responses.
Method Article
Magnetic Nano-Actuation Platform for Remote and Controllable Mechanostimulation of Schwann Cells with Real-Time Confocal Imaging
In This Article
Summary
Abstract
Mechanical forces critically regulate cellular behavior, yet many existing methods of mechanical stimulation rely on direct physical contact or artificially engineered extracellular environments, thereby limiting their flexibility in dynamic live-cell studies. Here, we present a magnetic nano-actuation platform for remote, non-contact, and controllable mechanostimulation of Schwann cells in vitro. This integrated setup enables remote magnetic stimulation and synchronized live-cell imaging in the same experimental session. This manuscript describes the preparation of fluorescent superparamagnetic nanoparticles (SPIONs), optionally actin-targeting functionalized SPIONs (f-SPIONs), the construction and calibration of a microscope-compatible electromagnetic stimulation device, the estimation of magnetic forces at the single-particle and single-cell levels, and the integration of magnetic actuation with real-time confocal imaging. Schwann cells are highly mechanosensitive glial cells that play essential roles in the development, maintenance, and repair of peripheral nerves. Real-time monitoring of their responses to mechanical stimulation is crucial for understanding how mechanical forces influence cytoskeletal organization and cellular behavior. This platform provides a reproducible workflow for studying Schwann cell mechanobiology and may be adapted to other mechanically responsive cell types and multicellular systems.
Introduction
Mechanical cues regulate a wide range of cellular processes, including adhesion, migration, proliferation, differentiation, and phenotypic plasticity1,2,3. Studies in mechanobiology have shown that both neurons and glial cells exhibit pronounced mechanosensitivity and responsiveness throughout development4,5,6,7. To investigate how cells sense and respond to force, multiple experimental approaches have been developed, including atomic force microscopy (AFM), micropipette aspiration, optical tweezers, stretch-based culture systems, and microfluidic platforms8,9,10,11,12. These techniques have greatly advanced the study of mechanotransduction. However, many require direct physical contact with cells or depend on predefined artificial mechanical environments, making them less suitable for remote, dynamically controllable, and imaging-compatible stimulation.
Magnetic nanoparticle-mediated force delivery offers an alternative strategy for remote mechanostimulation13,14,15,16,17,18. Because most biological tissues exhibit low magnetic susceptibility, externally applied magnetic fields can penetrate biological samples without direct contact and selectively act on magnetically responsive particles delivered into cells or tissues. In the presence of a magnetic field gradient, these particles experience directional forces that can be used to impose mechanical perturbations at the subcellular, cellular, or tissue level8,9. This approach is attractive because it is non-contact, tunable, compatible with live imaging, and potentially extendable to more complex biological systems.
Schwann cells are highly mechanosensitive glial cells19,20 that play critical roles in peripheral nerve development, maintenance, and repair21,22. Dynamic observation of Schwann cell responses to physical stimulation is important for understanding how force regulates cytoskeletal organization and cell behavior. However, many conventional force-delivery systems are not readily compatible with real-time high-resolution microscopy. To address this limitation, we developed a magnetic nano-actuation platform that combines actin cytoskeleton-targeting fluorescent magnetic superparticles (f-SPIONs), a custom electromagnetic device compatible with a confocal microscope stage, and a quantitative framework for force estimation. This integrated setup enables remote magnetic stimulation and synchronized live-cell imaging in the same experimental session.
The workflow described here includes preparation of fluorescent magnetic superparticles (SPIONs), optional phalloidin-based actin-targeting functionalization to generate f-SPIONs, nanoparticle characterization, electromagnetic device construction and field calibration, magnetic force estimation, and combined magnetic stimulation with real-time confocal imaging. Although optimized here for Schwann cells, the platform may provide a practical framework for related studies in other mechanically responsive living systems.
Protocol
The experiments described in this protocol used an established rat Schwann cell line (RSC96) and did not involve human participants or live animals. This study was conducted as part of a broader research project involving animal experiments, which was approved by the Animal Welfare and Ethics Committee of the First Hospital of Jilin University (Approval No. 2022-0045).
1. Preparation of fluorescent magnetic superparticles
- Synthesize oleic acid-coated Fe₃O₄ nanoparticles.
NOTE: Oleic acid-coated Fe₃O₄ nanoparticles were synthesized by thermal decomposition as described previously20,23.- Add 2 mmol of Fe(acac)₃, 6 mmol of oleic acid, 6 mmol of oleylamine, and 5 mmol of 1,2-hexadecanediol to 20 mL of benzyl ether in a reaction flask.
- Stir the mixture under a nitrogen atmosphere for 15 min until a homogeneous precursor solution is obtained.
- Heat the mixture to 200 °C at a rate of 20 °C/min.
- Maintain the reaction at 200 °C for 30 min.
- Increase the temperature to 265 °C and reflux the mixture for 30 min.
- Allow the reaction mixture to cool naturally to room temperature.
- Collect the Fe₃O₄ nanoparticles by magnetic separation.
- Wash the nanoparticles 3 times with ethanol.
- Redisperse the purified nanoparticles in toluene.
- Assemble Fe₃O₄·Cy3.5 superparticles.
NOTE: Fe₃O₄·Cy3.5 superparticles were prepared as described previously20,24,25.- Disperse 28 mg of oleic acid-coated Fe₃O₄ nanoparticles in 4 mL of toluene in a 50 mL three-necked round-bottom flask.
- Prepare an aqueous phase containing 12.5 mg of sodium dodecyl sulfate and 3 mg of Cyanine 3.5 (Cy 3.5) in 12.5 mL of water.
- Combine the Fe₃O₄ nanoparticle suspension in toluene (28 mg in 4 mL; 7 mg/mL) with the aqueous surfactant/dye solution to form an oil-in-water microemulsion.
- Mix thoroughly until a stable emulsion is obtained.
- Heat the three-necked round-bottom flask to 60 °C and stir continuously at 300 rpm for 6 h.
NOTE: No reduced-pressure or rotary evaporation procedure is required. - Evaporate the toluene under the conditions described above to induce the aggregation of the Fe₃O₄ nanoparticles. Using a disposable transfer pipette, transfer a small aliquot of the solution into a test tube and allow it to stand. The absence of phase separation indicates that the toluene has been completely removed.
- Transfer the Fe₃O₄·Cy3.5 superparticle suspension into 15 mL centrifuge tubes. Centrifuge at 2,370 × g for 5 min at room temperature to collect the superparticles, and carefully discard the supernatant without disturbing the pellet.
- Redisperse the pellet in ultrapure deionized water and centrifuge again at 2,370 × g for 5 min at room temperature. Discard the supernatant and repeat the washing procedure three times to remove residual free Cy3.5 dye and sodium dodecyl sulfate.
- Coat the superparticles with polydopamine (PDA).
NOTE: Polydopamine-coated superparticles were prepared as described previously20,26.- Centrifuge the Fe₃O₄·Cy3.5 superparticle suspension at 2,370 × g for 5 min at room temperature, and discard the supernatant.
- Redisperse the pellet in 10 mM Tris buffer (pH 8.5).
- Add 26 mg of dopamine monomer to the suspension.
- Stir the mixture at room temperature for 3 h under alkaline conditions.
- Centrifuge the suspension at 2,370 × g for 5 min at room temperature.
- Remove the supernatant and redisperse the pellet in ultrapure water to obtain Fe₃O₄·Cy3.5@PDA particles (SPIONs).
- Optionally functionalize the particles with phalloidin-Alexa Fluor 350.
NOTE: The superparticles were surface-functionalized using commercially available phalloidin-Alexa Fluor 35020.- Prepare 5 mL of aqueous solution containing 100 units of phalloidin-Alexa Fluor 350.
- Add 200 µL of Fe₃O₄·Cy3.5@PDA suspension containing 2 mg of particles to the solution.
- Stir the mixture gently at room temperature for 24 h.
- Centrifuge the mixture at 2,370 × g for 5 min at room temperature.
- Discard the supernatant and redisperse the pellet in deionized water.
- Store the final Fe₃O₄·Cy3.5@PDA@phalloidin (f-SPIONs) formulation protected from light until use.
2. Characterization of the nanoparticles
- Determine morphology and size.
- Prepare nanoparticle samples for transmission electron microscopy (TEM) or high-resolution transmission electron microscopy (HRTEM) according to the instrument requirements.
- Acquire images to determine the overall particle morphology, core-shell structure, and average diameter (Figure 1).
- Prepare aqueous nanoparticle suspensions for dynamic light scattering (DLS).
- Measure the hydrodynamic diameter and polydispersity index (PDI).
- Compare electron microscopy and DLS results to assess formulation uniformity and colloidal behavior.
- Determine magnetic properties.
- Prepare dried or concentrated nanoparticle samples suitable for superconducting quantum interference device (SQUID) analysis.
- Record magnetic hysteresis curves at 300 K.
- Determine saturation magnetization, remanence, and coercivity.
- Confirm that the particles exhibit superparamagnetic behavior with negligible remanence and coercivity.
- Determine fluorescence properties.
- Prepare an f-SPION suspension in ultrapure deionized water and transfer the suspension to a quartz cuvette.
- Record photoluminescence spectra using a fluorescence spectrophotometer.
- Confirm that the fluorescent signal remains detectable after washing and resuspension.
- Validate actin-associated localization when using the targeted formulation.
- Obtain RSC96 cells.
NOTE: The RSC96 cells used in this study, a spontaneously transformed rat Schwann cell line established through long-term culture of primary rat Schwann cells, were obtained from the Cell Bank of the Chinese Academy of Sciences, Shanghai, China (CSTR: 19375.09.3101RATGNR6) and tested negative for mycoplasma and fungal contamination. Cells at passages 3–10 were used. - Culture the cells in Dulbecco’s modified Eagle medium (DMEM) supplemented with 10% fetal bovine serum (FBS) and 1% penicillin–streptomycin solution (100 U/mL penicillin and 100 µg/mL streptomycin).
- Seed RSC96 cells at a density of 1 × 10⁵ cells per 35 mm cell culture microscopy dish and culture them for 24 h at 37 °C in a humidified atmosphere containing 5% CO₂ to allow cell attachment.
- Aspirate the existing culture medium, wash the cells twice with phosphate-buffered saline (PBS), and add complete culture medium containing 15 µg/mL f-SPIONs. Incubate the cells with f-SPIONs for 12 h.
- Aspirate the culture medium and wash the cells twice with ice-cold PBS containing 1 mM deferoxamine to thoroughly remove non-internalized particles.
- Acquire confocal images to evaluate the intracellular distribution of the particles. Set the imaging parameters to a pinhole of 1 Airy unit (AU) and a z-step of 0.43 µm to obtain high-resolution optical sections of the intracellular structures.
- Examine whether the particles show enrichment in actin-associated cellular regions.
- Obtain RSC96 cells.
3. Construction and calibration of the electromagnetic stimulation device (Figure 2)
- Assemble the electromagnetic device.
- Construct a compact electromagnetic coil system sized to fit the confocal microscope stage and live-cell chamber (Figure 2A,B).
- Connect the coil to a controllable power supply or external current source.
- Numerically simulate the gradient magnetic field environment using COMSOL Multiphysics 4.3b (Figure 2C,D).
- Confirm that the electromagnet generates the corresponding gradient magnetic field (GMF) under different input currents (Figure 2G).
- Measure magnetic flux density and calibrate the gradient magnetic field.
- Position the electromagnet beside the culture dish, with the pole tip directed toward the center of the dish and located 1 mm from the outer wall of the dish (Figure 2E,F).
- Maintain this relative geometric configuration between the electromagnet and the culture dish during all subsequent live-cell magnetic force stimulation and imaging experiments.
- Use a digital Gauss meter to measure the magnetic flux density at predefined positions within the stimulation region, using the positioning grid on the bottom of the culture dish as a spatial reference.
- Calculate the local field gradient from the spatial change in magnetic flux density.
- Calibrate and validate the numerically simulated magnetic field gradient using the experimentally measured and calculated magnetic field gradient values.
4. Estimation of magnetic forces delivered by the platform.
- Define the force-estimation model.
- Use the force equation for magnetic nanoparticles in a nonuniform magnetic field27,28:

- Under the assumption of superparamagnetic alignment with the applied field, simplify the equation to
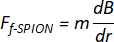
where:
F is the nanomagnetic force
m is the magnetic dipole moment
 is the magnetic field gradient
dB/dr is the magnetic field gradient (T/m) generated by the corresponding magnetic field generation device. - Use the measured field gradient from the calibrated device in all calculations.
- Use the force equation for magnetic nanoparticles in a nonuniform magnetic field27,28:
- Estimate the force acting on a single nanoparticle.
- Determine the average particle dimensions from HRTEM images.
- Calculate the magnetic core volume assuming spherical geometry.
- Estimate the Fe₃O₄-specific magnetic volume based on the magnetic fraction of the core.
- Calculate the magnetic dipole moment according to

where:
Mm represents the mass magnetization of the f-SPIONs (16 A·m2/kg) under the given field intensity;
ρ is the density of Fe₃O₄ (5.24 g/cm3).
V is the volume of the Fe₃O₄ magnetic core within each f-SPION (5.89 × 10⁻17 cm3). - Multiply the dipole moment by the measured field gradient to estimate the force acting on a single nanoparticle (
 ).
).
- Estimate nanoparticle uptake per Schwann cell.
- Seed RSC96 Schwann cells at 5 × 10⁵ cells per well in 35 mm cell culture microscopy dishes.
- Incubate the cells for 24 h under standard culture conditions.
- Replace the medium with fresh medium containing 15 µg/mL f-SPIONs.
- Incubate the cells for an additional 12 h.
- Wash the cells twice with ice-cold phosphate-buffered saline containing 1 mM deferoxamine.
- Collect and count the cells.
- Measure intracellular iron content using inductively coupled plasma atomic emission spectroscopy (ICP-AES).
- Calculate the number of internalized particles per cell by dividing the average iron mass per cell by the iron mass per particle
 .
.
- Estimate the force delivered to a single Schwann cell.
- Calculate the cell-level force according to

where:
is the magnetic force exerted on a single f-SPION.
 is the number of f-SPIONs internalized per cell.
Fcell is the magnetic force exerted on a single cell. - Report the resulting value as the estimated magnetic force delivered to a single Schwann cell (Fcell).
- State clearly that the value is a model-based estimate rather than a direct intracellular force measurement.
- Calculate the cell-level force according to
5. Combining magnetic stimulation with real-time confocal laser scanning microscopy (CLSM) imaging
- Load Schwann cells with magnetic nanoparticles.
- Seed Schwann cells in imaging-compatible ibidi culture dishes or microfluidic culture chambers.
- Allow the cells to adhere and recover.
- Replace the existing medium with fresh culture medium containing 15 µg/mL f-SPIONs.
- Incubate the cells for 12 h to allow f-SPION loading.
- Inspect cell morphology before proceeding.
- Remove noninternalized particles.
- Remove the nanoparticle-containing medium.
- Wash the cells twice with PBS containing 1 mM deferoxamine.
- Replace the wash solution with imaging-compatible live-cell medium.
- Confirm low extracellular particle background before imaging.
- Integrate the electromagnet device with the CLSM imaging system.
- Assemble the electromagnet with the live-cell culture chamber, positioning the electromagnet at its pre-calibrated location.
- Place the assembled live-cell culture chamber on the stage of the confocal microscope (Figure 3). Confirm that the culture dish is located within the effective stimulation region (Figure 3A).
- Energize the electromagnet according to the preset parameters and confirm effective gradient magnetic field exposure within the culture dish area (Figure 3B).
- Confirm that the objective lens can reach the focal plane without interference.
- Confirm that the device does not obstruct objective positioning or stage movement.
- Considering the heat generated during electromagnet operation, adjust the temperature settings of the live-cell chamber components according to the pre-determined optimal culture conditions to ensure an internal environment of 37 °C and 5% CO₂ (Figure 3C).
- Confirm that the entire system operates normally and stably.
- Functional Ca2⁺ imaging in living cells.
- Incubate the cells with Krebs–Ringer’s solution (pH 7.4) containing 3 µM Fluo-4 AM and 0.1% Pluronic F-127 at 37 °C for 30 min.
- After incubation, wash the cultures twice with PBS and transfer them to the live-cell imaging platform of the CLSM system for imaging (Figure 4A).
- Using the positioning grid on the bottom of the ibidi culture dish, image five predefined locations.
- Divide each imaging field equally into 25 regions and select 0–3 cells from each region for fluorescence quantification, depending on the actual cell density within that region.
- Define the complete outline of an individual cell as the region of interest (ROI), and monitor the magnetically induced calcium response by analyzing changes in fluorescence intensity (ΔF) within the ROI.
- Calculate the change in fluorescence intensity as ΔF = (Fstim - F0). Consider a change in fluorescence intensity before and after stimulation (ΔF/F0) exceeding 10% a calcium-response event.
NOTE: Funstim represents the fluorescence intensity before magnetic force stimulation, F0 represents the baseline fluorescence intensity, and Fstim represents the evoked fluorescence intensity after magnetic force stimulation. - For background correction, subtract the mean background fluorescence intensity measured in a cell-free region from the fluorescence intensity value of each ROI.
- Perform three independent experiments, with one culture dish included in each experiment.
- Perform time-lapse imaging and apply magnetic stimulation during imaging.
- Set the time-lapse imaging parameters as follows: an acquisition interval of 2.1 s per frame, a total acquisition duration of 650 s, and standard high-resolution optical-section imaging using 1 AU.
- During cellular imaging, acquire images continuously for 50 s without current input to record the intracellular calcium fluorescence intensity in the absence of magnetic force stimulation (Funstim) (Figure 2H and Figure 4B).
- Normalize the fluorescence intensity recorded during the first 50 s and define it as the baseline fluorescence intensity (F0).
- Subsequently, apply a constant current input of 3.0 A to the electromagnet, exposing Schwann cells loaded with magnetic nanoparticles to a gradient magnetic field of 3.25 T/m and thereby subjecting them to magnetic force stimulation. Continue time-lapse imaging for 10 min to record the intracellular calcium fluorescence intensity during magnetic force stimulation (Fstim) (Figure 2H and Figure 4C).
- Quantitatively calculate the change in fluorescence intensity as ΔF/F0 (Figure 4D,E).
- Perform statistical analysis and analyze Ca2⁺ fluorescence data.
- For each cell, calculate the median ΔF/F₀ value across the analyzed time series and use this value as the cell-level Ca2⁺ response metric.
- Perform three independent experiments for each experimental condition, with one culture dish per condition in each experiment. Pool the cells analyzed across the three independent experiments for descriptive presentation, and report n as the total number of cells analyzed in each group.
- Assess the normality of the cell-level ΔF/F₀ data using the Kolmogorov-Smirnov test.
- Because the Ca2⁺ fluorescence-response data are non-normally distributed, present the data as the median and interquartile range (IQR).
- Analyze differences among groups using the nonparametric Friedman test, followed by Wilcoxon signed-rank tests for pairwise comparisons, as previously reported.
- Consider P < 0.05 to indicate statistical significance.
Results
High-resolution transmission electron microscopy (HRTEM) showed that the final nanoparticle formulation possessed a clustered magnetic core and an outer shell after surface modification (Figure 1). The final f-SPIONs had an average overall diameter of 63.36 ± 16.65 nm, with a Fe₃O₄-rich magnetic core of approximately 56.60 ± 6.19 nm and an outer shell composed of polydopamine and phalloidin-Alexa Fluor 350 with an average thickness of approximately 5.79 ± 1.36 nm. These results confirmed the successful construction of a superparticle architecture suitable for magnetic actuation and fluorescence-based visualization.
Magnetic hysteresis analysis showed that the particles exhibited pronounced superparamagnetic behavior, with negligible remanence and coercivity. Under an applied magnetic field of 10,000 Oe (1.0 T), their saturation magnetization reached approximately 35 A·m2/kg (Figure 5). In the absence of a magnetic field gradient, f-SPIONs exhibited good dispersibility in an aqueous medium (Figure 6A). Upon exposure to a gradient magnetic field, f-SPIONs demonstrated sensitive magnetic responsiveness (Figure 6B). Fluorescence analysis further confirmed that the particles retained optical detectability after synthesis and surface modification (Figure 7).
The electromagnetic stimulation device was successfully integrated into the live-cell imaging system (Figure 3). Magnetic field calibration showed that the device generated a stable gradient magnetic field across the cell culture region (Figure 2E,F), with an in vitro gradient magnetic field of approximately 3.25 T/m under the present experimental configuration (Figure 2G).
Confocal imaging demonstrated efficient loading of the fluorescent magnetic nanoparticles into Schwann cells (Figure 7). After washing, the fluorescence signal remained primarily associated with the cells rather than with free particles in the medium. For the actin-targeted formulation, confocal imaging further showed enrichment of the particles in actin-associated cellular regions.
Time-lapse confocal imaging demonstrated that magnetic stimulation and live-cell imaging could be performed within the same experimental workflow, while maintaining stable optical access to the cells throughout the stimulation period (Figure 2H and Figure 4A).
A quantitative summary further linked nanoparticle design, device calibration, and cellular loading. Under the 3.25 T/m in vitro gradient magnetic field, the magnetic force acting on a single f-SPION was estimated to be approximately 1.59 × 10⁻⁵ pN. Based on intracellular iron quantification, each RSC96 Schwann cell internalized approximately 9.30 ± 2.88 × 10³ particles, corresponding to an estimated total magnetic force of approximately 0.15 ± 0.05 pN per cell.
Compared with the baseline fluorescence, under the magnetic stimulation mediated by f-SPIONs, RSC96 cells exhibited active Ca2+ dynamics and significantly increased Ca2+ fluorescence signals (Figure 4D). Quantitative analysis of the Ca2+ fluorescence signals revealed that the change in Ca2+ fluorescence intensity (ΔF/F0) within RSC96 cells in the magnetic stimulation group (62.96 [35.07–91.67]) was significantly higher than that in the normal control group (-5.74 [-15.66–1.20]), the f-SPIONs control group (-16.70 [-22.02–-12.00]), and the gradient magnetic field control group (-12.90 [-21.24–-6.97]) (Figure 4E).
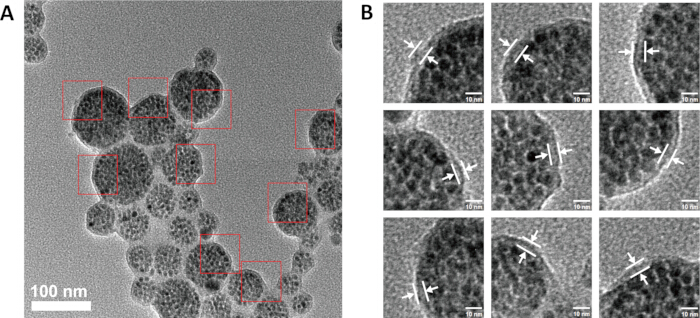
Figure 1: Morphology and core-shell structure of f-SPIONs by HRTEM. (A) The f-SPIONs are spherical and exhibit a typical core–shell structure, with an internal magnetic core composed of Fe₃O₄ nanoparticles and Cy3.5. (B) The outer shell is composed of PDA and phalloidin-Alexa Fluor 350. The images in panel B show representative enlarged views of the red-boxed regions in panel A, with the white lines and arrows indicating the measured shell thickness. The scale bar in panel B represents 10 nm. Three independent measurements were performed, with a total of 680 nanoparticles analyzed. Please click here to view a larger version of this figure.
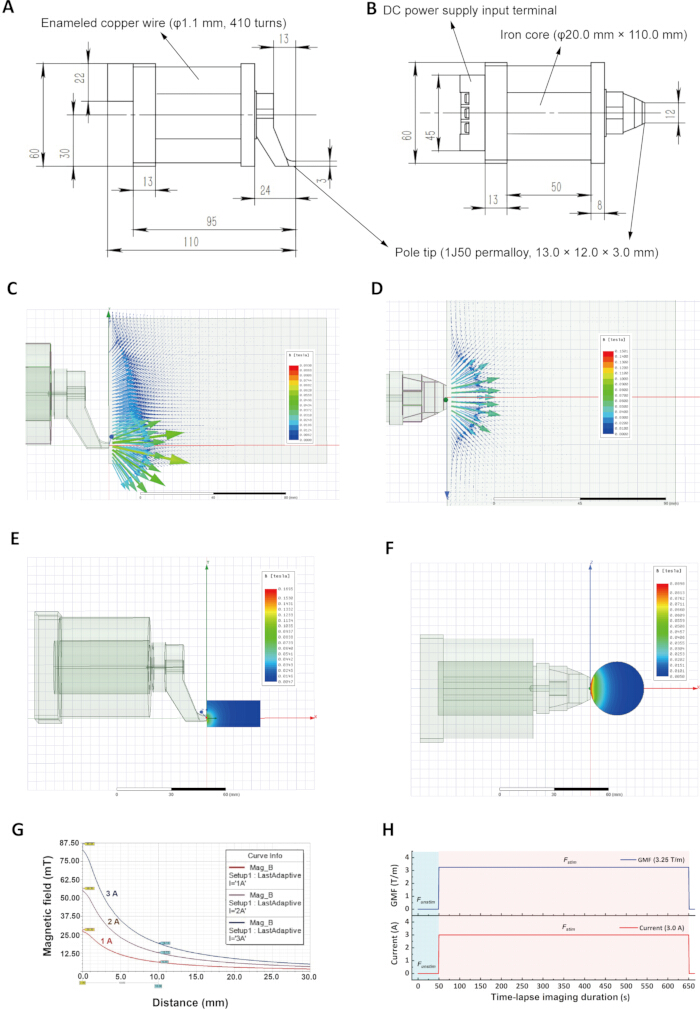
Figure 2: Construction, calibration, and operation of the custom electromagnet for live-cell magnetic stimulation. (A,B) The electromagnet coil was wound around an iron core using 1.1 mm enameled copper wire, with a total of 410 turns. The coil had an outer diameter of 60 mm, an inner diameter of 20 mm, a length of 110 mm, and a direct-current resistance of approximately 1.2 Ω. The pole tip measured 13.0 mm × 12.0 mm × 3.0 mm (length × width × height) and was fabricated from 1J50 permalloy. (C,D) The maximum input current of the electromagnet did not exceed 3 A. At an input current of 3 A, a magnetic field gradient of approximately 6.7 T/m was generated near the pole tip. (E,F) Distribution of the gradient magnetic field within the culture dish near the pole tip at an input current of 3 A. An average static magnetic field gradient of approximately 3.25 T/m was generated across the cellular imaging region. (G) Magnetic field gradients generated by the electromagnet at different input currents of 1 A, 2 A, and 3 A. (H) Protocol for live-cell time-lapse imaging, current application, and gradient magnetic field exposure in this study. Time-lapse images were acquired continuously for 50 s without current input. A continuous constant current of 3.0 A was then applied, and time-lapse imaging was continued for 10 min. DC: Direct current. GMF: Gradient magnetic field. Panels E, F, and G were adapted with permission from Liu et al.20. Please click here to view a larger version of this figure.
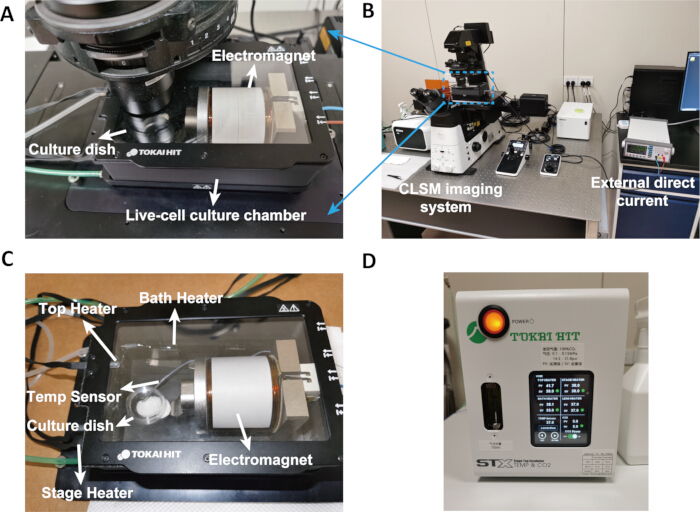
Figure 3: Integration of the electromagnet into the live-cell culture chamber. (A) A custom compact electromagnet positioned at the calibrated location within the live-cell culture chamber for gradient magnetic field exposure of the cell culture dish area. (B) Integrated setup of the CLSM imaging system, the magnetic nano-actuation platform, and the external direct current power supply. (C) Optimization of the temperature settings for the individual components of the cell culture chamber ensures a stable temperature within the culture dish during electromagnet operation. (D) Temperature-setting parameters for the individual components of the cell culture chamber. CLSM: confocal laser scanning microscopy. PV: Measured Value. SV: Set Value. Top Heater: Temperature of the top-cover heater. Stage heater: Heating temperature of the microscope stage and the bottom of the culture chamber. Bath heater: Temperature of the water bath. Lens heater: Temperature of the objective-lens heater. Temp sensor: Actual temperature measured by the temperature probe. Please click here to view a larger version of this figure.
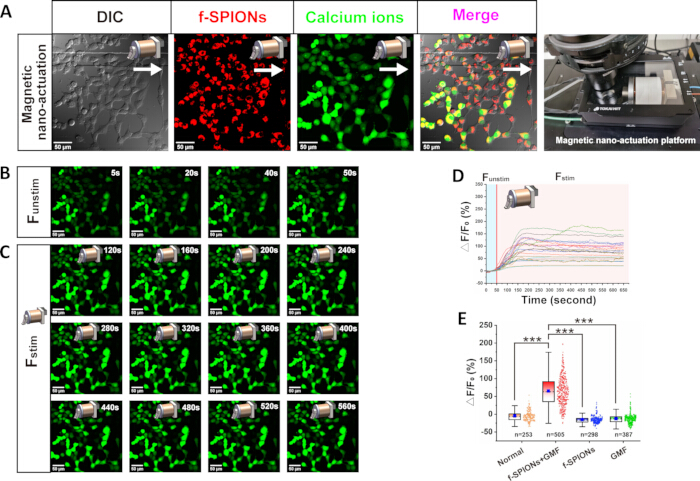
Figure 4: Representative images of calcium responses in Schwann cells under magnetic force stimulation. (A) Integrated workflow for magnetic stimulation and live-cell Ca2+ imaging in the magnetic nano-actuation platform. (B) Baseline Ca2+ fluorescence image acquired before magnetic stimulation (Funstim). (C) Ca2+ fluorescence image acquired after magnetic stimulation (Fstim), showing the change in fluorescence intensity (ΔF). (D) Time-resolved Ca2+ signal traces monitored before and after magnetic stimulation. (E) Quantitative analysis and comparison of changes in Ca2+ fluorescence (ΔF/F₀) among the different experimental groups. DIC: Differential Interference Contrast. Funstim: the fluorescence intensity before magnetic force stimulation. F0: the baseline fluorescence intensity. Fstim: the evoked fluorescence intensity after magnetic force stimulation. ΔF: the change in fluorescence intensity. “Normal” represents the normal control group, “f-SPIONs+GMF” represents the magnetic nano-actuation group, “f-SPIONs” represents the f-SPIONs control group, and “GMF” represents the gradient magnetic field control group. Three independent experiments were performed, with one culture dish per experimental condition in each experiment. For each cell, the median ΔF/F₀ value across the analyzed time series was used as the cell-level response metric. Data are presented as the median and interquartile range (IQR), and n indicates the total number of cells analyzed across the three independent experiments. Statistical analysis was performed using the Friedman test followed by the Wilcoxon signed-rank test, as previously reported in Liu et al. The quantitative data in panel E were adapted with permission from Liu et al.20. Please click here to view a larger version of this figure.
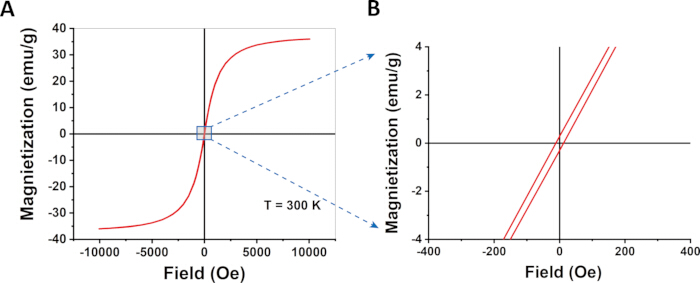
Figure 5: Superparamagnetic properties of f-SPIONs. (A) Magnetic hysteresis loop of f-SPIONs, showing typical superparamagnetic behavior. (B) Enlarged view of the hysteresis loop near zero magnetic field. Please click here to view a larger version of this figure.
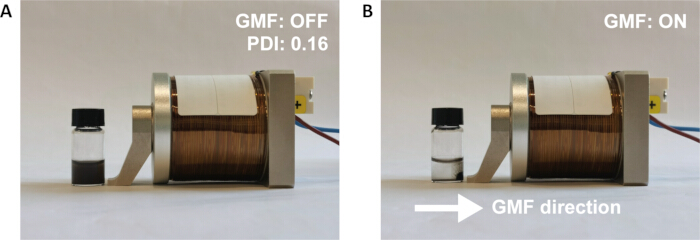
Figure 6: Aqueous dispersibility and gradient magnetic field responsiveness of f-SPIONs. (A) In the absence of a gradient magnetic field, the f-SPIONs remain well dispersed in the aqueous medium. (B) When the gradient magnetic field is applied, the f-SPIONs rapidly migrate and accumulate along the field gradient direction. GMF: Gradient magnetic field. PDI: Polydispersity index. The arrow indicates the direction of the gradient magnetic field. Please click here to view a larger version of this figure.
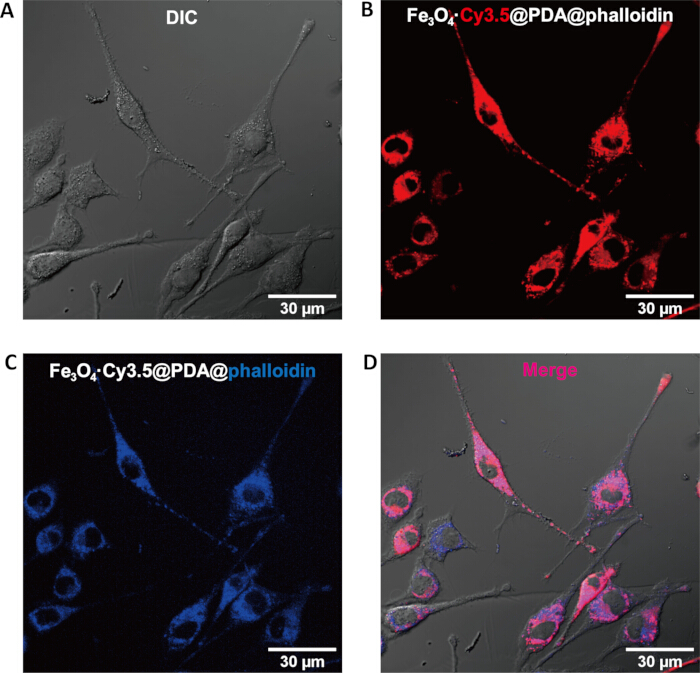
Figure 7: CLSM fluorescence imaging of f-SPION internalization in Schwann cells. (A) CLSM imaging of Schwann cells after co-incubation with f-SPIONs (15 µg/mL) for 12 h and subsequent washing (pinhole = 1 AU; z-step = 0.43 µm), showing preserved cell morphology and minimal extracellular particle background. (B) Red fluorescence detected in the Cy3.5 channel (Ex/Em: 561–568/607 nm), indicating the presence of Cy3.5-labeled f-SPIONs within Schwann cells. (C) Blue fluorescence detected in the Alexa Fluor 350 channel (Ex/Em: 350–360 nm/440–460 nm), supporting successful incorporation of the phalloidin-Alexa Fluor 350 functionalization module. (D) Merged image showing substantial spatial overlap between the red and blue fluorescence signals, consistent with successful construction of the magnetic-fluorescent superparticles. DIC: Differential interference contrast. Please click here to view a larger version of this figure.
Discussion
Iron oxide nanoparticles are widely recognized as magnetic nanomaterials with favorable biocompatibility. As widely used magnetic resonance imaging contrast agents, superparamagnetic Fe₃O₄ nanoparticles have been extensively applied in clinical imaging diagnosis29,30. In our group’s recent study20, f-SPIONs were demonstrated to exhibit extremely low cytotoxicity and excellent biosafety. The nanomagnetic actuation platform, constructed using f-SPIONs as mechanical actuators in combination with a controllable electromagnet, effectively activated cytoskeletal dynamics in Schwann cells, induced the opening of the mechanosensitive Piezo1 ion channel, triggered transmembrane Ca2⁺ influx, and subsequently promoted gene-expression “reprogramming” and phenotypic changes in the cells20.
Several steps are particularly important for the successful implementation of this platform. The first critical step is nanoparticle preparation. The particles must remain well dispersed, magnetically responsive, and optically detectable after synthesis and surface modification. Aggregation at any stage can reduce cellular uptake consistency, alter effective magnetic properties, and compromise live-cell imaging quality.
The second critical step is the cellular loading and washing procedure. The nanoparticle concentration and incubation time must be sufficient to produce detectable intracellular loading without causing excessive extracellular accumulation or compromising cell morphology. Thorough removal of noninternalized and membrane-associated particles is essential, particularly when fluorescence imaging is used to evaluate intracellular localization. Inadequate washing can lead to misinterpretation of localization patterns and may also distort cell-level force estimates.
The third critical step is the geometric alignment of the magnetic stimulation device relative to the sample. Because the magnetic force depends directly on the local field gradient, the relative position of the electromagnetic coil and the sample plane must remain consistent with the calibration configuration. Even small changes in coil-sample distance or alignment can alter the effective stimulation conditions.
The platform can be modified according to the biological question being addressed. When general magnetic loading and force delivery are sufficient, the PDA-coated fluorescent superparticles (SPIONs) may be used without actin-targeting functionalization. When subcellular localization near actin-rich regions is desired, the phalloidin-functionalized formulation (f-SPIONs) may be used instead. This modularity is a practical advantage of the platform.
The current technique has several limitations. First, the calculated number of magnetic particles taken up per cell represents a population-average value, whereas particle loading at the single-cell level inevitably exhibits heterogeneity. Second, the magnetic force values reported in this study are model-based estimates rather than direct measurements of intracellular mechanical loads. Third, this protocol was primarily designed and developed for Schwann cells cultured under in vitro imaging conditions. In dense three-dimensional cell culture systems and tissues, substantial optimization may be required because nanoparticle uptake, intracellular distribution, optical accessibility, and mechanical coupling may differ from those in two-dimensional cultures. Finally, the optional actin-targeting strategy increases the likelihood of particle localization to actin-associated regions but does not ensure uniform or specific targeting of all actin-rich structures within living cells.
Despite these limitations, the present magnetic nano-actuation platform offers several distinct methodological advantages over existing force-delivery techniques. For example, atomic force microscopy (AFM) enables precise localized force application but requires direct mechanical contact with the target and is not always readily integrated with long-term live-cell imaging8. Stretch-based systems and engineered substrates can provide mechanical cues at the cell-population level, but they rely on predefined material interfaces and are not well suited for remote intracellular force delivery10. Optical tweezers provide high spatial resolution for force application but carry risks of laser-induced tissue damage8. Micropipette-based methods are relatively simple to operate but have relatively low throughput and force resolution12. Microfluidic systems are advantageous for generating specific mechanical microenvironments, such as shear stress and fluid pressure, but face technical challenges in reproducing complex cellular environments and integrating multiple modes of mechanical stimulation11. In contrast, the present platform integrates remote, non-contact stimulation, controllable magnetic actuation, fluorescence-based particle tracking, and direct compatibility with real-time confocal imaging within a single workflow.
The same general strategy may be adapted to other mechanically responsive cell types and more complex biological models. It may also be extendable to denser multicellular systems such as neural organoids, epithelial cysts, or Madin-Darby canine kidney (MDCK)-like epithelia. In such settings, additional optimization would be required for particle penetration, particle distribution, and force estimation in mechanically coupled three-dimensional samples. Even with these challenges, the current workflow provides a practical foundation for the broader development of magnetomechanical stimulation strategies in living systems.
Disclosures
The authors declare no competing financial interests.
Acknowledgements
This work was supported by the National Natural Science Foundation of China (Grant Numbers 82571677 and 82001304 to Y.W.), the Special Program for Medical and Health Care Talents in Jilin Province (Grant Number JLSRCZX2025-134 to Y.W.), and the Bethune Program Project of Jilin University (Grant Number 2024B19 to Y.W.). The authors thank the College of Chemistry, Jilin University (State Key Laboratory of Supramolecular Structure and Materials), and the Changchun Institute of Applied Chemistry, Chinese Academy of Sciences, for assistance with the design, synthesis, and characterization of nanomaterials. The authors also thank the Institute of Translational Medicine at The First Hospital of Jilin University for assistance with CLSM imaging.
Materials
| Name | Company | Catalog Number | Comments |
|---|---|---|---|
| 1,2-Hexadecanediol | Sigma-Aldrich | 213748 | Technical grade, 90%; used in thermal decomposition synthesis |
| 35 mm ibidi µ-dishes | ibidi | 80156 | Used for Schwann cell culture and imaging |
| Benzyl ether | Sigma-Aldrich | 108014 | 98%; solvent for Fe3O4 nanoparticle synthesis |
| Confocal laser scanning microscope | Nikon | AXR (Ti2-E) | Used for live-cell and fluorescence imaging |
| Custom electromagnet | Custom-built | N/A | Compact unipolar electromagnet for in vitro gradient magnetic field generation |
| Cyanine3.5 carboxylic acid | Duofluor Inc. | D10128 | Fluorescent dye used for Fe3O4·Cy3.5 superparticle assembly; MW 593.20; store at -20 °C, protected from light |
| Deferoxamine mesylate salt | Sigma-Aldrich | D9533 | Iron-chelating agent used to remove noninternalized and membrane-associated iron |
| Digital Gauss meter | WEITE MAGNETIC | WT103 | Used to measure magnetic flux density and calibrate the gradient magnetic field generated by the custom electromagnet |
| Dopamine hydrochloride | Sigma-Aldrich | H8502 | ≥98% (TLC); used for polydopamine coating |
| Dynamic light scattering instrument | Malvern Instruments | Zetasizer Nano-ZS | Used for hydrodynamic diameter and PDI measurement |
| Fluo-4 AM | Invitrogen, Thermo Fisher Scientific | F14201 | Calcium indicator used for live-cell Ca2+ imaging |
| Fluorescence spectrophotometer | Shimadzu | RF-6000 | Used for photoluminescence characterization |
| High-resolution transmission electron microscope | JEOL | JEM-F200 | Used for HRTEM imaging of nanoparticle morphology and core–shell structure |
| Inductively coupled plasma atomic emission spectrometer | PerkinElmer | Optima 3300 DV | Used for intracellular iron quantification |
| Iron(III) acetylacetonate, Fe(acac)3 | Sigma-Aldrich | F300 | 97%; precursor for Fe3O4 nanoparticle synthesis |
| Live-cell stage-top incubator | TOKAI HIT | TENP&CO2 | Used for live-cell confocal imaging during magnetic stimulation |
| Oleic acid | Sigma-Aldrich | O1008 | ≥99% (GC); surface ligand for Fe3O4 nanoparticle synthesis |
| Oleylamine | Sigma-Aldrich | O7805 | Technical grade, 70%; ligand for nanoparticle synthesis |
| Phalloidin–Alexa Fluor 350 | Invitrogen, Thermo Fisher Scientific | A22281 | Optional actin-targeting functionalization reagent |
| Pluronic F-127 | Invitrogen, Thermo Fisher Scientific | P3000MP | Used to facilitate Fluo-4 AM loading for live-cell Ca2+ imaging |
| Programmable DC regulated power supply | Tongmen | eTM-L605SPL (60 V, 5 A) | Used to power the custom electromagnet for in vitro gradient magnetic field generation |
| RSC96 Schwann cells | Cell Bank of the Chinese Academy of Sciences | N/A | Rat-derived Schwann cell line |
| Sodium dodecyl sulfate (SDS) | Sigma-Aldrich | 436143 | ACS reagent, ≥99.0%; surfactant for oil-in-water microemulsion |
| SQUID magnetometer | Quantum Design Inc. | MPMS-XL | Used for magnetic hysteresis measurement at 300 K |
| Toluene | Sigma-Aldrich | 244511 | Anhydrous, 99.8%; solvent for superparticle assembly |
| Transmission electron microscope | FEI | EP 5018/40, Tecnai Spirit Biotwin | Used for cellular and neural tissue ultrastructure observation |
References
- Cheng B, et al. Mechanobiology across timescales. Nat Rev Phys. 2025;7:621-44.
- Di X, et al. Cellular mechanotransduction in health and diseases: from molecular mechanism to therapeutic targets. Signal Transduct Target Ther. 2023;8:282.
- Pillai EK, Franze K. Mechanics in the nervous system: from development to disease. Neuron. 2024;112(3):342-61.
- Franze K. The mechanical control of nervous system development. Development. 2013;140(15):3069-77.
- Franze K, Guck J. The biophysics of neuronal growth. Rep Prog Phys. 2010;73:094601.
- Moore SW, Sheetz MP. Biophysics of substrate interaction: influence on neural motility, differentiation, and repair. Dev Neurobiol. 2011;71(11):1090-101.
- Franze K, Janmey PA, Guck J. Mechanics in neuronal development and repair. Annu Rev Biomed Eng. 2013;15:227-51.
- Sun W, et al. Biophysical approaches for applying and measuring biological forces. Adv Sci (Weinh). 2022;9(5):e2105254.
- Mohammed D, et al. Innovative tools for mechanobiology: unraveling outside-in and inside-out mechanotransduction. Front Bioeng Biotechnol. 2019;7:162.
- Constantinou I, Bastounis EE. Cell-stretching devices: advances and challenges in biomedical research and live-cell imaging. Trends Biotechnol. 2023;41:939-50.
- Polacheck WJ, Li R, Uzel SGM, Kamm RD. Microfluidic platforms for mechanobiology. Lab Chip. 2013;13(12):2252-67.
- Li Z, et al. Non-invasive acquisition of mechanical properties of cells via passive microfluidic mechanisms: a review. Biomicrofluidics. 2021;15(3):031501.
- Xiao Y, Du J. Superparamagnetic nanoparticles for biomedical applications. J Mater Chem B. 2020;8(3):354-67.
- Yang X, et al. Nanotechnology enables novel modalities for neuromodulation. Adv Mater. 2021;33(52):e2103208.
- Semeano AT, et al. Effects of magnetite nanoparticles and static magnetic field on neural differentiation of pluripotent stem cells. Stem Cell Rev Rep. 2022;18(4):1337-54.
- Lee B, et al. Design of oxide nanoparticles for biomedical applications. Nat Rev Mater. 2025;10:252-67.
- Kim YJ, et al. Magnetoelectric nanodiscs enable wireless transgene-free neuromodulation. Nat Nanotechnol. 2025;20:121-31.
- Signorelli L, Hescham SA, Pralle A, Gregurec D. Magnetic nanomaterials for wireless thermal and mechanical neuromodulation. iScience. 2022;25(11):105401.
- Liu T, Wang Y, Lu L, Liu Y. SPIONs-mediated magnetic actuation promotes nerve regeneration by inducing and maintaining repair-supportive phenotypes in Schwann cells. J Nanobiotechnology. 2022;20:159.
- Liu T, et al. f-SPION-mediated magnetic stimulation induces reparative Schwann cell reprogramming via cytoskeletal dynamics-gated activation of Piezo1. J Nanobiotechnology. 2026;24:298.
- Jessen KR, Mirsky R, Lloyd AC. Schwann cells: development and role in nerve repair. Cold Spring Harb Perspect Biol. 2015;7(7):a020487.
- Jessen KR, Mirsky R. The repair Schwann cell and its function in regenerating nerves. J Physiol. 2016;594(13):3521-31.
- Sun S, Zeng H. Size-controlled synthesis of magnetite nanoparticles. J Am Chem Soc. 2002;124(28):8204-5.
- Zhuang J, Wu H, Yang Y, Cao YC. Controlling colloidal superparticle growth through solvophobic interactions. Angew Chem Int Ed Engl. 2008;47(12):2208-12.
- Bai F, et al. A versatile bottom-up assembly approach to colloidal spheres from nanocrystals. Angew Chem Int Ed Engl. 2007;46(35):6650-3.
- Tang L, et al. Investigating the optimal size of anticancer nanomedicine. Proc Natl Acad Sci U S A. 2014;111(43):15344-9.
- Tay A, Kunze A, Murray C, Di Carlo D. Induction of calcium influx in cortical neural networks by nanomagnetic forces. ACS Nano. 2016;10(2):2331-41.
- Tay A, Di Carlo D. Magnetic nanoparticle-based mechanical stimulation for restoration of mechano-sensitive ion channel equilibrium in neural networks. Nano Lett. 2017;17(2):886-92.
- Cheng FY, et al. Characterization of aqueous dispersions of Fe(3)O(4) nanoparticles and their biomedical applications. Biomaterials. 2005;26(7):729-38.
- Lee N, et al. Iron oxide-based nanoparticles for multimodal imaging and magnetoresponsive therapy. Chem Rev. 2015;115(19):10637-89.
Reprints and Permissions
This article has been published
Video Coming Soon