We describe a technically accessible, cost-effective protocol for imaging worm early development, written for new researchers.
Method Article
Imaging Worm Early Development: A Practical Manual for New Researchers
* These authors contributed equally
In This Article
Summary
Abstract
According to the strain distribution record from the Caenorhabditis Genetics Center (CGC) presented at the 25th International Worm Meeting in 2025, approximately 8,000 laboratories across 80 countries use these animals in their research. Establishing a sustainable culture and maintenance platform is essential for generating first-hand data on worm behaviors, particularly in laboratories with limited experience or resources. Here, using Caenorhabditis elegans as an example, we present a practical protocol for new researchers to establish basic worm-handling and -imaging workflows. We then describe procedures for collecting normal and perturbed C. elegans samples at selected early developmental stages for microscopic imaging. The imaging targets include germ cell development (mitosis and meiosis), prefertilization oocytes, oocyte-sperm pronuclear migration and fusion, pseudocleavage, and embryonic development (mitosis) that gives rise to the organism. Although embryonic and whole-organism imaging is straightforward, we provide enhanced guidelines and technical tips to facilitate precise germline and embryo dissection, rapid sample collection, mounting, timelapse imaging, and basic image analysis.
Introduction
Nematode worms are among the most powerful model organisms in biomedical research1,2, owing to their highly reproducible developmental program and the diversity revealed through gene perturbations3,4,5,6 and related species7,8,9,10. Since its introduction by Sydney Brenner in the 1960s, Caenorhabditis elegans (C. elegans) has emerged as a representative distinguished by its small size, optical transparency, rapid three-day life cycle, fully resolved cell lineage, sequenced and annotated genome, and advanced genetic toolkits for controlling gene function11,12,13,14,15,16. Central to these investigations is the ability to visualize dynamic biological events through microscopy, particularly in the germline and embryo—the continuum of development from meiosis and mitosis to the formation of a complete organism17. Throughout this process, rapid meiotic and successive mitotic divisions, and multicellular reorganization proceed with remarkable spatiotemporal precision17.
Compared with the embryo, which is typically monitored in vitro, the germline in vivo is an ideal system for studying both meiosis and mitosis within a single tissue, particularly for new researchers, as its spatially segregated meiotic and mitotic zones enable simultaneous observation of these distinct cell division modes (Figure 1)18. In the C. elegans germline, organized as a syncytium, germ cells are interconnected through a shared cytoplasmic core—the rachis18 (Figure 1). Germ cell proliferation occurs through mitosis in the distal gonad arm via incomplete and asymmetric divisions of primordial germ cells (PGC). During the late larva-4 (L4) stage, syncytial pachytene spermatocytes progressively detach from the rachis and enter meiosis in the proximal gonad arm19. This can be imaged directly in vivo in immobilized/anesthetized animals or in vitro in dissected primary spermatocytes20,21.
Biological phenomena in the germline and embryo are exceptionally rich and broadly relevant across diverse scientific research areas. Following meiotic maturation, germ-cell-derived oocytes enter the spermatheca to be fertilized by sperm, triggering embryogenesis22,23. Their outstanding developmental robustness makes C. elegans embryos an excellent model for exploring the molecular mechanisms of cell polarity, cell division, cell cycle, and cell movement24,25. Young adult worms can be dissected to release newly fertilized embryos, which are then selected for timelapse imaging of key developmental milestones, including but not limited to oocyte-sperm pronuclear migration and fusion, pseudocleavage, asymmetric cell division, gastrulation, organogenesis, etc.
Although optical access to full and partial structures in the germline and embryo is, in principle, always achievable, high-quality and publishable-level microscopy remains notoriously challenging for newcomers. “Standard” written protocols in the literature often condense complex procedures into sparse, ambiguous descriptions that fail to capture the nuanced "feel" of the technique. Examples include the exact amount of anesthetic, the gentle handling required to avoid damaging the gonad during dissection, and the precise focal-plane selection for microscopy. Consequently, novice investigators may routinely face months of frustrating trial and error, requiring repeated mentorship, practice sessions, and extensive troubleshooting before achieving consistently satisfactory images. This inefficient knowledge transfer delays research progress and introduces undesirable technical variability that can compromise data interpretation across laboratories.
For example, in the germline, the anatomical complexity of the gonad and obstruction from other tissues (e.g., intestine) make it difficult to observe cell morphology or division dynamics in vivo. Furthermore, the germline poses additional challenges with its delicate tubular structure and extreme sensitivity to mounting pressure. In vitro imaging is therefore favored not only for general germline and embryo observation, but also for detailed cell-resolved observation. For instance, the single proximal primary spermatocytes dissected from the gonad can complete two consecutive rounds of meiosis to become four haploid spermatids, and the absence of tissue structure shadows makes higher-quality images easier to capture. These observations can be extended to other tissues or the whole body26,27,28,29,30,31,32. Conveniently, each operation can be completed in 1 h, facilitating timelapse imaging.
Here, we present a practical, step-by-step timelapse imaging protocol across selected developmental stages from germ cell development to embryonic development, encompassing not only imaging procedures but also preparatory steps (e.g., worm dissection) to lower the technical barrier for researchers new to worm imaging33. Our protocol highlights real-time visual demonstration of microscopic imaging for both germline and embryo—from optimized mounting procedures that preserve viability through multi-hour recordings, to microscope parameter configuration that balances signal-to-noise ratio with phototoxicity/photobleaching minimization, and basic image acquisition.
Protocol
NOTE: Successful long-term maintenance of C. elegans populations is the foundation for subsequent experimental work and requires consistent production of high-quality nematode growth medium (NGM), reliable propagation of bacterial food sources, appropriate environmental conditions for strain growth and reproduction, and effective strategies to prevent culture loss from contamination.
1. Worm culture and maintenance
NOTE: We only provide some advice here; detailed procedures can be found in Wormbook34. Use NGM premixed powder to reduce the weighing and preparation steps.
- Culture all animals on NGM agar seeded with food E. coli OP50 at 20 °C for wild-type (WT) and 16 °C or 25 °C for temperature-sensitive mutants (ts mutants).
NOTE: Freshmen should verify culture temperature for CGC mutant strains upon receipt.
NOTE: WT animals grow faster in higher temperatures; ts mutants can produce embryos at 16 °C (permissive temperature) but not at 25 °C (restrictive temperature at which they show loss-of-function effects in a specific gene or protein)35,36,37,38. The strains and food can be bought from CGC [https://cgc.umn.edu] or obtained as gifts from nearby laboratories. - Transfer animals into new plates before starvation (with significantly fewer Escherichia coli (E. coli) OP50 observed under the microscope) to keep them healthy for further experiments (~2–3 days).
- Store animals in freezing buffer (S buffer supplemented with glycerol to a final concentration of 15%) in -80 °C overnight and transfer them to a freezing box or liquid nitrogen for long-term storage34.
NOTE: Label all cryovials with oil-based, waterproof permanent markers prior to freezing. Water-based inks are incompatible with ultra-low temperature storage.
2. Agarose pad preparation
- Weigh 3 g of agarose and transfer it to a 250 mL conical flask. Add 100 mL of M9 buffer, mix well, and heat it in a microwave oven for 2–3 min until the agarose is fully dissolved (hereafter referred to as agarose buffer).
NOTE: Cover the conical opening with pan paper to prevent buffer evaporation and minimize osmotic concentration errors. The total volume can be adjusted according to the experiment requirements. - Transfer the well-mixed agarose buffer into a 1.5 mL centrifuge tube, which can be stored at room temperature for up to 1 month. Melt the stored agarose in a heater block set to 90–100 °C (skip this step if using freshly prepared agarose).
- Cut off the tip of a 200 µL pipette tip to widen the opening and prevent solidification-induced clogging, and place a drop of the melted agarose buffer on the glass slide (size: 75 x 25 mm; thickness: 0.9–1.10 mm; type: soda lime glass).
- Immediately cover the drop with another slide. Apply additional agarose buffer around the edges of the coverslips (size: 22 x 22 mm; thickness: 0.25 mm) and gently press the agar into a thin, round circle that fully surrounds each coverslip, ensuring no air bubbles are trapped.
NOTE: This creates a sealed microchamber for animal immobilization and prevents dehydration. Multiple slides can be processed in parallel for high-throughput experiments. - Allow agar to cool for at least 3 min until fully solidified before use.
NOTE: Use the agarose pad for imaging as soon as it is solidified, so that the animal will not be under stress. The solid agar will absorb water from the center, eventually leading to the animal's death.
3. In vivo observation of spermatogenesis in hermaphrodite or male worms (Figure 1 and Supplemental Video S1)
- Prepare an agarose pad as described above in section 2.
- Quickly transfer 10–20 NMY-2::GFP-labeled animals20 (late L4 stage) into 5–10 µL of 0.5% tetramisole hydrochloride diluted in M9 buffer on a coverslip.
NOTE: To prevent animal movement and dehydration, avoid adding too much or too little buffer. Select worms that have crawled away from or outside the bacterial lawn boundary (the E. coli cluster with blurred and semi-transparent region can be observed under a microscope) to avoid the unintended transfer of E. coli along with the worm, which can interfere with imaging. - Incubate for 1 min until the animals are fully anesthetized.
- Gently remove the upper slide, leaving the agarose pad on the bottom slide.
- Invert the slide with the agarose pad. Gently touch and lower the pad to the worms in the buffer to avoid air bubble formation. Flip the slide with the coverslip up.
NOTE: Avoid rapid movement of the coverslip, which can damage the worm's body. - Using a 200 µL pipette tip, apply heated liquid petroleum jelly (preheated together with solid agar), quickly move the pipette tip along the boundary of the coverslip, and allow petroleum jelly to cool, securing the coverslip to the slide.
- Place the slide on the microscope stage for imaging germ cell development.
- For single images, increase the laser power and exposure time to optimize fluorescence signal (according to the strength of fluorescence expression in different strains), which can be increased as needed for better fluorescence visualization.
- For timelapse/Z-stacks, use lower excitation power and shorter exposure time to minimize phototoxicity/photobleaching.
NOTE: The goal is to obtain spatial and temporal imaging data with minimal adverse effects on worm growth.
4. In vivo observation of PGC divisions (Figure 1 and Supplemental Video S1)
- Prepare an agarose pad as described above in section 2.
- Transfer 10 NMY-2::GFP-labeled animals39,40 (late L1 to young adult stage) into 5–10 µL of 0.5% tetramisole hydrochloride diluted in M9 buffer on a coverslip.
- Incubate for 1 min until the animals are fully immobilized.
- Remove the upper slide, leaving the agarose pad on the bottom slide.
- Invert the slide with the agarose pad. Gently touch the pad with worms in the buffer to avoid air bubbles. Flip the slide with the coverslip up.
- Seal the boundary of the coverslip with petroleum jelly using a 200 µL pipette tip, as described in step 3.6.
- Transfer the slide to the microscope stage for imaging.
5. Dissection of the germline for in vitro observation of male spermatogenesis (Supplemental Figure S1 and Supplemental Video S2)
NOTE: The syringe size can be adjusted according to personal preference. Males possess a complete and single germline containing one gonad, while the hermaphrodites have two gonads (both produce sperm from late L4 to young adult stage, and produce oocytes at later stages)41.
- Prepare fresh in vitro culture buffer (Leibovitz’s L-15 medium containing 15% FBS).
NOTE: The buffer should be stored in a 4 °C refrigerator for no more than a week. The serum can be split into different tubes for long-term preservation at -20 °C. - Place approximately 10 N2 or fluorescently labeled (NMY-2::GFP; mCherry::Histone) male worms (late L4 stage) into a 1.5 mL centrifuge tube containing 500 µL of culture buffer.
- Centrifuge the tube at 1,000 × g for 2 min. Gently remove the upper 400 µL of buffer.
- Add 400 µL of culture buffer and repeat steps 5.2–5.3.
- Transfer the remaining buffer (containing animals) onto a coverslip. Add an appropriate volume of tetramisole hydrochloride (final concentration 0.1%) or levamisole (final concentration 0.1 mM) to immobilize nematodes through nicotinic acetylcholine receptor agonism41 and local anesthetic activity42. Gently swirl the coverslip until the worms stop moving.
NOTE: To reduce costs, the M9 buffer can be used for initial washes to remove the debris or E. coli. Add culture buffer only during the final wash or before slide preparation. Steps 5.2–5.3 can be omitted to speed up the process for special requirements or if the buffer is very clean. - Attach two 28 G needles to syringes, holding one in each hand. Place the coverslip under the dissecting microscope, position the needles at a 30–45° angle over a worm. Make an incision near the proximal gonad arm to release gonadal tissue. Repeat for all animals.
NOTE: This will release body debris. For beginners, more practice is recommended. The maximum complete dissection time in paralytic buffers could last for <5 min. Adjust timing based on experimental goals. - Swirl the coverslip and collect the debris. Gently aspirate the large debris with a pipette and leave as little of the buffer as possible while ensuring that the small primary spermatocytes remain on the coverslip.
NOTE: Avoid leaving too much buffer in the coverslip; excess causes movement during mounting. - Take a clean slide and gently cover the coverslip with dissected primary spermatocytes. Seal the boundary of the coverslip with heated liquid petroleum jelly as in step 3.6.
NOTE: Apply a small amount of liquid petroleum jelly to the four corners of the coverslip before sealing to prevent the mechanical disruption of spermatocytes. - Transfer to the microscope for imaging.
NOTE: Avoid using agarose pads. Liquid medium provides a more transparent background, offering superior optical clarity for distinguishing the primary spermatocytes.
6. Dissection of the worms and in vitro observation of fertilization and embryogenesis under fluorescence (Supplemental Figure S2, Supplemental Figure S3, Supplemental Video S3, and Supplemental Video S4) and brightfield (Figure 2 and Supplemental Video S5)
NOTE: Early-stage embryos were obtained by crossing two 28 G needles with the bevel openings facing in opposite directions near the spermatheca. The chamber was sealed to prevent the liquid from evaporating and transferred immediately to the microscope.
- To eliminate the influence of pressure from the coverslip and agarose pad exerted on embryos, machine a 10 mm central hole in a 35 mm Petri dish using a drill. Seal the underside with a 22 mm microscope cover glass to create a reusable chamber for inverted confocal microscopy.
- Add approximately 30 µL of M9 buffer into the chamber.
NOTE: This volume is sufficient for 4 h of timelapse imaging per round. The buffer volume allows continuous imaging from oocyte-sperm pronuclear migration and fusion to muscle twitching of the embryo before hatching. - Select hermaphrodites. Transfer approximately 20 young adult animals into the M9 buffer in the imaging chamber.
NOTE: Males produce only sperm, not embryos. - Use a syringe needle to make a transverse cut at the spermatheca twice to release more early-stage embryos. Use an eyelash picker to remove the animal body.
NOTE: Practically, the platinum picker is too hard to remove the body debris in liquid. We also recommend a false eyelash picker (with multiple ends) to remove debris like a fork, which functions better than a standard real eyelash picker. - Cover the Petri dish with its lid to prevent liquid evaporation.
7. Timelapse imaging under microscopy
- Place the slide/chamber onto the microscope (e.g., an inverted spinning-disk confocal microscope, equipped with a 60×/1.4 NA objective and an EMCCD camera) under the lowest magnification (10×) field, and search for animals, primary spermatocytes, or newly fertilized embryos at the desired stage.
- For non-fluorescent worms, determine the developmental stage of early embryos through the location of the cell nucleus, fusion status, and the morphology of the cleavage furrow (Figure 2 and Supplemental Video S5).
- For in vitro dissected primary spermatocytes, look for the cells preparing for division that are detached from the rachis and are roundly dispersed in the buffer (Supplemental Figure S1 and Supplemental Video S2).
- For fluorescent worms, identify stages based on protein distribution and cell morphology.
NOTE: Fluorescence was detected using a 488 nm excitation line with a 525–550 nm emission filter for GFP and a 561 nm excitation line with a 607–636 nm emission filter for RFP/mCherry.
- Locate these cells or embryos and switch to a higher magnification (63× or 100×).
NOTE: Because the principles of preparing and imaging cells and embryos are the same, the visualized experiment tutorial demonstrates the case of dissected embryos using both brightfield and fluorescence channels. - Start Z-stack (typically using ≤1 µm interval) video recording or picture snapshot using the microscope acquisition software, with a scanning interval as low as 1 s, depending on Z layer number and research requirements.
NOTE: For fluorescent strains susceptible to photobleaching/phototoxicity, lower the laser power and shorten the exposure time to reduce photobleaching/phototoxicity during long-term imaging. - Save all images in .tiff format for image output and keep the original imaging information.
8. Image analysis
NOTE: Individual .tiff images or timelapse stacks can be rotated, cropped, labeled, measured, and processed using microscope-specific software or general analysis software such as Fiji/ImageJ [https://imagej.net/software/fiji], an open-source platform for biological image analysis43.
- Open the acquired images in Fiji/ImageJ. Check the fluorescence signal intensity and distribution of individual fluorescent puncta or structures. Select Image | Adjust | Brightness/Contrast and Image | Hyperstacks | Stack to Hyperstack to separate the channels, the Z layers, and the time points in a single tiff image. Select Image | Color | Channels Tool to optimize color balance for exhibition.
- Use Image | Transform | Rotate to rotate each image so that the worm is oriented horizontally with the head facing left. Use Image | Crop to remove unnecessary blank regions if needed.
- Use Image | Stacks | Z Project to generate a Z-projection from representative frames with sufficient signal.
NOTE: For optimal visualization, high-contrast frames are recommended to be projected together. However, to compare relative differences within the same specific tissues or organelles across different groups, several frames containing complete information could be projected together, even if the signal is weak. - Use File | Save As | Tiff to save the projected images for subsequent analysis.
- Depending on the confocal microscope used, calibrate the image scale so that pixels are converted to micrometers (µm). After calibration, use Analyze | Tools | Scale Bar to add a scale bar.
NOTE: Image processing above is limited to visualization and figure preparation. When batch processing or automated measurements are required, use Fiji/ImageJ or other open-source tools, such as CellProfiler44 and Python-based analysis pipelines45.
Results
Visualizing C. elegans at the cellular level for phenotypic analysis traditionally requires substantial investment in optical equipment, yet modern consumer electronics and innovative adapter systems now enable satisfactory imaging capabilities at remarkably reduced cost. To image the gonad structure of hermaphrodites in vivo by confocal microscopy or other readily available instruments, we use a strain carrying two fluorescent labels20, with NMY-2::GFP marking the overall structure of the U-shaped gonad, the rachis and cortical region of primary spermatocytes, and mCherry::Histone showing the nucleus morphology and developmental stage (Figure 1 and Supplemental Video S1). These two proteins are widely used in different studies46,47,48. To capture most of the 3D structural information, we acquired the entire Z-stack at 1 µm intervals from the bottom to the top of the worm gonad. Based on the compact mass of the chromosome and weak accumulation of NMY-2 in the equatorial region, the most proximal primary spermatocytes are at the karyosome stage, indicating that these cells are beginning their first division (Figure 1 and Supplemental Video S1). Additionally, mitotic divisions of PGCs occur in the distal region of the gonad and can also be captured with this protocol.
For in vitro observation of spermatogenesis, we first prepare the culture buffer. Worms are dissected, and germline spermatocytes are released into the buffer. It is critical to rapidly locate the primary spermatocytes preparing for their first division, identified by nuclear morphology (beginning of nuclear envelope breakdown) or by whole-cell morphology. Fluorescent strains make it easier to identify the correct developmental stage. Images are captured at 30 s intervals to balance phototoxicity/photobleaching and capture efficiency. (Supplemental Figure S1 and Supplemental Video S2).
To obtain more information on early embryogenesis, we first locate newly fertilized embryos under brightfield channel, where the paternal and maternal nuclei are positioned at opposite ends of the embryo along its major axis and move toward each other for fusion. For embryo observation with standard slides, we used a strain expressing GFP::Histone49 and mCherry::PH50 to label the cell nucleus and cell membrane dynamics, respectively. These images are captured at different Z layers to show the complete cell division (Supplemental Figure S2 and Supplemental Video S3). Note that the ability to identify the embryos at the correct stage is essential. We selected early-stage embryos and employed continuous recording to capture complete developmental progression without physical perturbation. This approach allows >500 min of timelapse recording that encompasses the entire process from fertilization through muscle twitching (Figure 2 and Supplemental Video S5). In addition to wild-type, mutants are also available for comparative imaging studies. For example, HUM-2 is the homolog of human myosin V, which plays critical roles in the distribution of organelles, vesicles, and mRNA, and is important for animal physiology and cellular function51. As an illustrative example, the protocol was also used to capture furrow dynamics in the hum-2 (ok596) mutant for visual comparison (Supplemental Figure S3 and Supplemental Video S4). Finally, the .tiff images are processed and cropped in ImageJ/Fiji and aligned in image-editing software for direct visual comparison52.
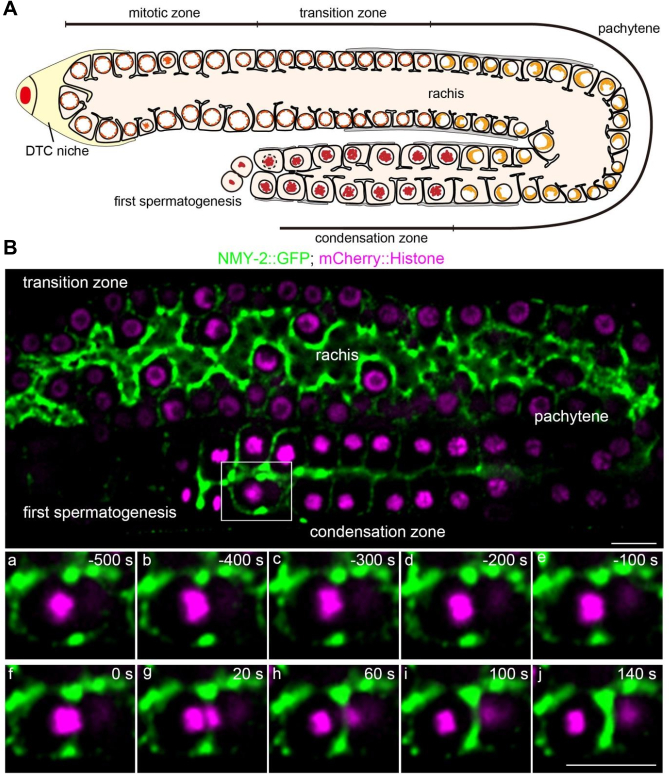
Figure 1: Schematic and fluorescence image of gonad zone distribution in late L4-stage worms. (A) Schematic of the gonad structure of a late L4-stage worm. DTC = distal tip cell. (B) Fluorescence image showing NMY-2::GFP labeling the rachis and cortical region of proximal spermatocytes, and mCherry::Histone labeling nuclear morphology at different developmental stages. Scale bar = 10 µm. Please click here to view a larger version of this figure.
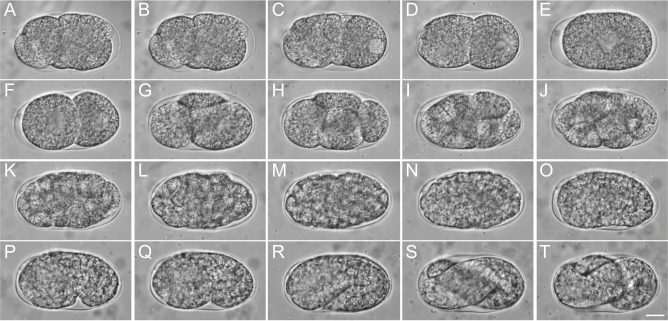
Figure 2: C. elegans embryonic development. (A-E) Fusion stage to one-cell stage, encompassing oocyte-sperm pronuclear migration and fusion, pseudocleavage, and establishment of one-cell stage. (F-J) Two-cell stage to multicellular stage. (K-O) Gastrulation stage. (P-T) Comma stage to muscle twitching. Scale bar = 10 µm. Please click here to view a larger version of this figure.
Supplemental Figure S1: Representative demonstration of imaging complete spermatogenesis. (A) Beginning of nucleus envelope breakdown. (B) Prometaphase of meiosis I. (C) Formation of contractile ring and initiation of constriction; (D) Completion of meiosis I; (E) Start of meiosis II. (F) Furrow constriction of two secondary spermatocytes. (G) Telophase of meiosis II. (H) Completion of meiosis II and formation of four spermatids and one centrally localized residual body. Scale bar = 10 µm. Please click here to download this file.
Supplemental Figure S2: Representative demonstration of imaging early embryogenesis, with GFP::Histone labeling the cell nucleus and mCherry::PH labeling cell membrane. (A) Pseudocleavage. (B) Regression of cleavage furrow back to normal state. (C) Metaphase of first cell division. (D) Anaphase of first cell division. (E) Two-cell stage. (F) Anaphase of AB cell division and prophase of P1 cell division. (G) Anaphase of P1 cell division. (H) Four-cell stage. Scale bar = 10 µm. Please click here to download this file.
Supplemental Figure S3: Representative comparison of cleavage furrow in early embryos of N2 and hum-2 (ok596) mutant. The zoom-in panel shows furrow dynamics over time for visual comparison. The numbers indicate time after anaphase onset, defined by chromosome segregation. Scale bar = 2 µm. Please click here to download this file.
Supplemental Video S1. Representative fluorescence timelapse imaging of late L4-stage gonad using NMY-2::GFP and mCherry::Histone; 30 s per frame. Please click here to download this file.
Supplemental Video S2. Representative brightfield timelapse imaging of complete spermatogenesis in him-5 (e1490); 30 s per frame. Please click here to download this file.
Supplemental Video S3. Representative fluorescence timelapse imaging of early embryogenesis using GFP::Histone and mCherry::PH; 30 s per frame. Please click here to download this file.
Supplemental Video S4. Representative fluorescence timelapse imaging of cleavage furrow in early embryos of N2 and hum-2 (ok596) mutant; 15 s per frame. Please click here to download this file.
Supplemental Video S5. Representative brightfield timelapse imaging of N2 C. elegans embryonic development from oocyte-sperm pronuclear fusion to mitotic divisions that give rise to the organism. Please click here to download this file.
Discussion
For preparing and imaging worms, we streamlined two workflows based on chambers and slides, respectively. The chamber-based approach has been used for high-resolution live imaging, allowing long-term observation of developmental processes with limited phototoxicity/photobleaching53. The slide-based approach was adapted from standard agarose pad-mounting techniques commonly used for short-term observation of neuronal activity and subcellular structures54. We applied both protocols (sections 3, 4, 5, and 6) for long-term observations across selected C. elegans early developmental stages. Regarding in vivo observation of gonad structure, PGC divisions, or spermatogenesis, we followed the main procedures of previously established methods and made certain modifications for quick, easy access for new researchers55. Regarding in vitro observation of spermatogenesis, we emphasize the rapid recognition of cells entering the transition from prophase to metaphase, when the nuclear envelope is breaking down56. Although agarose pads can buffer and partially stabilize embryos or worms for in vivo imaging, they reduce the contrast between primary spermatocytes and the slide. Agarose pads are therefore not recommended for in vitro observation of dissected spermatocytes; a liquid medium is preferred. Likewise, quick recognition of specific developmental stages of interest is emphasized for in vitro observation of embryogenesis.
Combining the methods above, selected developmental events from the germline to the embryo can be imaged. These methods can also be combined with temperature-control equipment, such as fast temperature-shift systems for live-cell imaging, making experiments more convenient for temperature-sensitive mutants57. Similarly, cooling-based immobilization can enable high-throughput, submicron-resolution imaging of C. elegans populations directly on cultivation plates, reducing the need for chemical anesthesia or individual worm manipulation while maintaining physiological viability58. In addition, artificial perturbations, such as RNA interference14 and laser ablation59,60,61,62,63,64,65, can be combined with microscopy to examine developmental responses and underlying biological or physical mechanisms. In the future, microscopy workflows may be further improved by optimizing hardware, software, and user-specific operation33,66. Although specific operational details need to be adjusted, selected principles of this protocol may be adaptable to other small, motile animal models, such as fruit flies and zebrafish larvae, particularly for in vivo observations requiring immobilization and in vitro observations requiring dissection67,68.
Image datasets acquired through protocols of this type can also support downstream computational or quantitative analysis when sufficient sample numbers and standardized acquisition settings are used69,70. For example, C. elegans embryogenesis has been used in studies of cell lineage tracing71,72 and cell morphology segmentation73,74,75, both of which rely on spatiotemporal imaging data. From a mechanistic perspective, imaging of nuclei, membranes, polarity-related proteins76,77,78, and cytoskeleton-related proteins79,80,81 can support analysis of cell division and morphogenesis. Quantitative systems biology can integrate these types of imaging data across molecular, cellular, and organismal scales82,83,84,85. In the present protocol, these broader applications should be viewed as potential extensions rather than outcomes directly demonstrated by the representative results.
Disclosures
The authors have no conflicts of interest to disclose.
Acknowledgements
We are grateful to Prof. Samuel H. Chung, Prof. Erin J. Cram, Prof. Javier Apfeld, and Dr. Noa William Franklin Grooms at Northeastern University, and Prof. Chuanfu Dong at Beijing Normal University for their technical support. This work was financially supported by the National Natural Science Foundation Youth Project (Grant 22407016) and National Natural Science Foundation Project (Grant 22477010) to Dr. Pei Zhang.
Materials
| Name | Company | Catalog Number | Comments |
|---|---|---|---|
| 28 Gauge U-100 Insulin Syringes | EasyTouch | B08589MG8D | Worm dissection |
| 35 mm Petri Dishes | Celltreat | 229638 | Imaging chamber |
| 60 mm Petri Dishes | Fisherbrand | AS4050 | Worm culture |
| Agarose | Bio-Rad | 1613100 | Agarose pad preparation |
| C. elegans RNAi Feeding Library (Ahringer) | Source BioScience Ltd. | N/A | RNAi experiment |
| C. elegans strain: GFP::histone; mCherry::PH | Caenorhabditis Genetics Center | YC0154 | Strain used in this study |
| C. elegans strain: GFP::HUM-2 | Sunybiotech | YC0381 | Strain used in this study |
| C. elegans strain: him-5 (e1490) | Caenorhabditis Genetics Center | CB4088 | Strain used in this study |
| C. elegans strain: N2, wild-type | Caenorhabditis Genetics Center | N2 (Bristol) | Strain used in this study |
| C. elegans strain: NMY-2::GFP; mCherry::histone | Caenorhabditis Genetics Center | YC0032 | Strain used in this study |
| C. elegans strain: PH::GFP; mCherry::histone | Caenorhabditis Genetics Center | YC0029 | Strain used in this study |
| Differential Interference Contrast (DIC) Microscope | Olympus | BX53 | Worm imaging |
| Dissecting Stereomicroscopes | Nikon | SMZ745 | Worm observation |
| E. coli OP50 | Caenorhabditis Genetics Center | OP50 | Bacterial food source |
| Fetal bovine serum (FBS) | N/A | N/A | Culture buffer |
| Freezing buffer (S buffer/glycerol) | N/A | N/A | Long-term storage |
| Hybridization cover glass | Invitrogen (Thermo Fisher Scientific) | H18200 | Agarose pad/chamber preparation |
| Isopropyl β-D-1-thiogalactopyranoside (IPTG) | Invitrogen (Thermo Fisher Scientific) | 15529019 | Worm culture |
| Leibovitz's L-15 medium | N/A | N/A | Culture buffer |
| Levamisole hydrochloride | N/A | N/A | Worm immobilization |
| M9 buffer | N/A | N/A | Worm culture and mounting |
| Microscope Cover Glass | Fisherbrand | 12541016 | Imaging slides |
| Mini digital incubator | Benchmark Scientific | BMS-H2200-HC-E | Worm culture |
| NGM premixed powder | N/A | N/A | Worm culture |
| Nikon Eclipse Ti2-E Inverted Microscope | Nikon | Ti2-E | Worm imaging |
| Plain Microscope Slides | Fisherbrand | 12550A3 | Imaging slides |
| Plain microscope slides | Corning | 2947-75X25 | Agarose pad preparation |
| Spinning disk confocal microscope | Olympus | SpinSR10 | Worm imaging |
| Spinning-disk confocal unit | Yokogawa | CSU-X1 | Time-lapse imaging |
| Tetramisole | Sigma-Aldrich | L9756 | Worm anesthesia |
| Vaseline | Sangon Biotech | A510146-0500 | Imaging slides |
References
- Corsi AK, Wightman B, Chalfie M. A transparent window into biology: a primer on Caenorhabditis elegans. Genetics. 2015;200(2):387-407.
- Ambros VR, et al. From nematode to Nobel: how community-shared resources fueled the rise of Caenorhabditis elegans as a research organism. Proc Natl Acad Sci U S A. 2025;122(48):e2522808122.
- Du Z, et al. De novo inference of systems-level mechanistic models of development from live-imaging-based phenotype analysis. Cell. 2014;156(1):359-72.
- Xiao L, et al. Defect-buffering cellular plasticity increases robustness of metazoan embryogenesis. Cell Syst. 2022;13(8):615-30.e9.
- Green RA, et al. Automated profiling of gene function during embryonic development. Cell. 2024;187(12):3141-60.e23.
- Yang M, Bai Y, Wang Z, Du Z. Intracellular buffering enables developmental robustness after genome doubling in C. elegans embryos. Cell Rep. 2026;45(3):117005.
- Laugsch M, Schierenberg E. Differences in maternal supply and early development of closely related nematode species. Int J Dev Biol. 2004;48(7):655-62.
- Guan G, Luo C, Tang HL, Tang C. Modulating cell proliferation by asymmetric division: a conserved pattern in the early embryogenesis of nematode species. MicroPubl Biol. 2024;10.17912/micropub.biology.001006.
- Large CRL, et al. Lineage-resolved analysis of embryonic gene expression evolution in C. elegans and C. briggsae. Science. 2025;388(6753):eadu8249.
- Zhang P, et al. Biosynthesis of modular signaling molecules requires functional diversification of carboxylesterases in Pristionchus pacificus. Commun Biol. 2025;8(1):1213.
- Brenner S. The genetics of Caenorhabditis elegans. Genetics. 1974;77(1):71-94.
- Sulston JE, Schierenberg E, White JG, Thomson JN. The embryonic cell lineage of the nematode Caenorhabditis elegans. Dev Biol. 1983;100(1):64-119.
- C. elegans Sequencing Consortium. Genome sequence of the nematode C. elegans: a platform for investigating biology. Science. 1998;282(5396):2012-8.
- Chung SH, et al. Femtosecond laser ablation reveals antagonistic sensory and neuroendocrine signaling that underlie C. elegans behavior and development. Cell Rep. 2013;4(2):316-26.
- Zhang H, Abraham N, Khan LA, Gobel V. RNAi-based biosynthetic pathway screens to identify in vivo functions of non-nucleic acid-based metabolites such as lipids. Nat Protoc. 2015;10(5):681-700.
- Huang X, et al. PIWI-interacting RNA expression regulates pathogenesis in a Caenorhabditis elegans model of Lewy body disease. Nat Commun. 2023;14(1):6137.
- Schnabel R, Hutter H, Moerman D, Schnabel H. Assessing normal embryogenesis in Caenorhabditis elegans using a 4D microscope: variability of development and regional specification. Dev Biol. 1997;184(2):234-65.
- Wang X, Hu B, Zhao Z, Tse YC. From primordial germ cells to spermatids in Caenorhabditis elegans. Semin Cell Dev Biol. 2022;127:110-20.
- L’Hernault SW. Spermatogenesis. In: Riddle DL, Blumenthal T, Meyer BJ, Priess JR, editors. C. elegans II. 2nd edition. Cold Spring Harbor Laboratory Press, Cold Spring Harbor, NY; 1997.
- Wang X, et al. Cortical recruitment of centralspindlin and RhoA effectors during meiosis I of Caenorhabditis elegans primary spermatocytes. J Cell Sci. 2021;134(3):jcs238543.
- Hu J, et al. Distinct roles of two myosins in C. elegans spermatid differentiation. PLoS Biol. 2019;17(4):e3000211.
- Kovacevic I, Orozco JM, Cram EJ. Filamin and phospholipase C-ε are required for calcium signaling in the Caenorhabditis elegans spermatheca. PLoS Genet. 2013;9(5):e1003510.
- Sadeghian F, Grooms NWF, Chung SH, Cram EJ. Tensions on the actin cytoskeleton and apical cell junctions in the C. elegans spermatheca are influenced by spermathecal anatomy, ovulation state and activation of myosin. Front Cell Dev Biol. 2024;12:1490803.
- Hoege C, Hyman AA. Principles of PAR polarity in Caenorhabditis elegans embryos. Nat Rev Mol Cell Biol. 2013;14(5):315-22.
- Simske JS, Hardin J. Getting into shape: epidermal morphogenesis in Caenorhabditis elegans embryos. Bioessays. 2001;23(1):12-23.
- Zhang H, Emmons SW. Regulation of the Caenorhabditis elegans posterior hox gene egl-5 by microRNA and the polycomb-like gene sop-2. Dev Dyn. 2009;238(3):595-603.
- Zhang N, et al. The C. elegans intestine as a model for intercellular lumen morphogenesis and in vivo polarized membrane biogenesis at the single-cell level: labeling by antibody staining, RNAi loss-of-function analysis and imaging. J Vis Exp. 2017;(128):e56100.
- Zhang N, et al. The C. elegans excretory canal as a model for intracellular lumen morphogenesis and in vivo polarized membrane biogenesis in a single cell: labeling by GFP-fusions, RNAi interaction screen and imaging. J Vis Exp. 2017;(128):e56101.
- Cui M, et al. A model of hereditary sensory and autonomic neuropathy type 1 reveals a role of glycosphingolipids in neuronal polarity. J Neurosci. 2019;39(29):5816-34.
- Li Z, et al. A collection of toolkit strains reveals distinct localization and dynamics of membrane-associated transcripts in epithelia. Cell Rep. 2021;35(5):109072.
- Cheng X, et al. Proteotoxic stress disrupts epithelial integrity by inducing MTOR sequestration and autophagy overactivation. Autophagy. 2022;19(1):241-55.
- Zhang P, et al. The centralspindlin complex regulates cytokinesis and morphogenesis in the C. elegans spermatheca. Development. 2023;150(2):dev200840.
- Wang YL, Grooms NWF, Civale SC, Chung SH. Confocal imaging capacity on a widefield microscope using a spatial light modulator. PLoS One. 2021;16(2):e0244034.
- Stiernagle T. Maintenance of C. elegans. WormBook. 2006;1-11.
- Hirsh D, Vanderslice R. Temperature-sensitive developmental mutants of Caenorhabditis elegans. Dev Biol. 1976;49(1):220-35.
- Davies T, et al. Using fast-acting temperature-sensitive mutants to study cell division in Caenorhabditis elegans. Methods Cell Biol. 2017;137:283-306.
- Ward S, Miwa J. Characterization of temperature-sensitive, fertilization-defective mutants of the nematode Caenorhabditis elegans. Genetics. 1978;88(2):285-303.
- Vanderslice R, Hirsh D. Temperature-sensitive zygote defective mutants of Caenorhabditis elegans. Dev Biol. 1976;49(1):236-49.
- Fujita M, Onami S. Cell-to-cell heterogeneity in cortical tension specifies curvature of contact surfaces in Caenorhabditis elegans embryos. PLoS One. 2012;7(1):e30224.
- Nishikawa M, Naganathan SR, Jülicher F, Grill SW. Controlling contractile instabilities in the actomyosin cortex. eLife. 2017;6:e19595.
- Kimble J, Hirsh D. The postembryonic cell lineages of the hermaphrodite and male gonads in Caenorhabditis elegans. Dev Biol. 1979;70(2):396-417.
- Onuaguluchi G, Igbo IN. Comparative local anaesthetic and antiarrhythmic actions of levamisole hydrochloride and lignocaine hydrochloride. Arch Int Pharmacodyn Ther. 1987;289(2):278-89.
- Schindelin J, et al. Fiji: an open-source platform for biological-image analysis. Nat Methods. 2012;9(7):676-82.
- Weisbart E, et al. CellProfiler plugins - an easy image analysis platform integration for containers and Python tools. J Microsc. 2024;296(3):227-34.
- Rueckl M, et al. SamuROI, a Python-based software tool for visualization and analysis of dynamic time series imaging at multiple spatial scales. Front Neuroinform. 2017;11:44.
- Kachur TM, Audhya A, Pilgrim DB. UNC-45 is required for NMY-2 contractile function in early embryonic polarity establishment and germline cellularization in C. elegans. Dev Biol. 2008;314(2):287-99.
- Schmutz C, Stevens J, Spang A. Functions of the novel RhoGAP proteins RGA-3 and RGA-4 in the germ line and in the early embryo of C. elegans. Development. 2007;134(19):3495-505.
- Chartier NT, et al. PAR-4/LKB1 mobilizes nonmuscle myosin through anillin to regulate C. elegans embryonic polarization and cytokinesis. Curr Biol. 2011;21(4):259-69.
- Knight AJ, Johnson NM, Behm CA. VHA-19 is essential in Caenorhabditis elegans oocytes for embryogenesis and is involved in trafficking in oocytes. PLoS One. 2012;7(7):e40317.
- Murata D, et al. GPI-anchor synthesis is indispensable for the germline development of the nematode Caenorhabditis elegans. Mol Biol Cell. 2012;23(6):982-95.
- Wong S, Weisman LS. Roles and regulation of myosin V interaction with cargo. Adv Biol Regul. 2021;79:100787.
- McLean D. Adobe Photoshop and Illustrator techniques. J Audiov Media Med. 2002;25(2):79-81.
- Gabel CV, et al. Neural circuits mediate electrosensory behavior in Caenorhabditis elegans. J Neurosci. 2007;27(28):7586-96.
- Chung SH, Sun L, Gabel CV. In vivo neuronal calcium imaging in C. elegans. J Vis Exp. 2013;(74):50357.
- McCarter J, Bartlett B, Dang T, Schedl T. On the control of oocyte meiotic maturation and ovulation in Caenorhabditis elegans. Dev Biol. 1999;205(1):111-28.
- L’Hernault SW. Spermatogenesis. WormBook. 2006;1-14.
- Pitayu-Nugroho L, et al. Kinetochore component function in C. elegans oocytes revealed by 4D tracking of holocentric chromosomes. Nat Commun. 2023;14(1):4032.
- Wang YL, et al. High-throughput submicron-resolution microscopy of Caenorhabditis elegans populations under strong immobilization by cooling cultivation plates. iScience. 2023;26(2):105999.
- Chung SH, et al. The role of the AFD neuron in C. elegans thermotaxis analyzed using femtosecond laser ablation. BMC Neurosci. 2006;7(1):30.
- Chung S, Maxwell I, Mazur E. Subcellular surgery and nanoneurosurgery [conference paper]. Presented at: Conference on Lasers and Electro-Optics; Baltimore, MD; 2007. p. 1-2.
- Chung SH, Mazur E. Femtosecond laser ablation of neurons in C. elegans for behavioral studies. Appl Phys A Mater Sci Process. 2009;96(2):335-41.
- Chung SH, Mazur E. Surgical applications of femtosecond lasers. J Biophotonics. 2009;2(10):557-72.
- Cai H, et al. Wedge prism approach for simultaneous multichannel microscopy. Sci Rep. 2019;9(1):17795.
- Chung SH, et al. Novel DLK-independent neuronal regeneration in Caenorhabditis elegans shares links with activity-dependent ectopic outgrowth. Proc Natl Acad Sci U S A. 2016;113(20):E2852-60.
- Grooms NWF, et al. Expression of thioredoxin-1 in the ASJ neuron corresponds with and enhances intrinsic regenerative capacity under lesion conditioning in C. elegans. FEBS Lett. 2023;597(14):1880-93.
- Wang YL, et al. Widefield targeted illumination microscopy enables optically-sectioned, motion-resilient imaging of neuronal fibers and their dynamics. Laser Photon Rev. 2025;19(24):e01980.
- Ghaemi R, Rezai P, Nejad FR, Selvaganapathy PR. Characterization of microfluidic clamps for immobilizing and imaging of Drosophila melanogaster larva’s central nervous system. Biomicrofluidics. 2017;11(3):034113.
- Bauer B, Mally A, Liedtke D. Zebrafish embryos and larvae as alternative animal models for toxicity testing. Int J Mol Sci. 2021;22(24):13417.
- Ho VWS, et al. Systems-level quantification of division timing reveals a common genetic architecture controlling asynchrony and fate asymmetry. Mol Syst Biol. 2015;11(6):MSB145857.
- Packer JS, et al. A lineage-resolved molecular atlas of C. elegans embryogenesis at single-cell resolution. Science. 2019;365(6459):eaax1971.
- Bao Z, et al. Automated cell lineage tracing in Caenorhabditis elegans. Proc Natl Acad Sci U S A. 2006;103(8):2707-12.
- Katzman B, Tang D, Santella A, Bao Z. AceTree: a major update and case study in the long term maintenance of open-source scientific software. BMC Bioinform. 2018;19(1):121.
- Cao J, et al. Establishment of a morphological atlas of the Caenorhabditis elegans embryo using deep-learning-based 4D segmentation. Nat Commun. 2020;11(1):6254.
- Guan G, et al. Cell lineage-resolved embryonic morphological map reveals signaling associated with cell fate and size asymmetry. Nat Commun. 2025;16(1):3700.
- Guan G, et al. EmbSAM: cell boundary localization and Segment Anything Model for fast images of developing embryos. Commun Biol. 2026;9(1):8.
- Goehring NW, et al. Polarization of PAR proteins by advective triggering of a pattern-forming system. Science. 2011;334(6059):1137-41.
- Zhang H, et al. Vesicular sorting controls the polarity of expanding membranes in the C. elegans intestine. Worm. 2013;2(1):e23702.
- Zhang H, et al. Clathrin and AP-1 regulate apical polarity and lumen formation during C. elegans tubulogenesis. Development. 2012;139(11):2071-83.
- Kajita A, Yamamura M, Kohara Y. Computer simulation of the cellular arrangement using physical model in early cleavage of the nematode Caenorhabditis elegans. Bioinformatics. 2003;19(6):704-16.
- Zhang H, et al. Apicobasal domain identities of expanding tubular membranes depend on glycosphingolipid biosynthesis. Nat Cell Biol. 2011;13(10):1189-201.
- Pimpale LG, Middelkoop TC, Mietke A, Grill SW. Cell lineage-dependent chiral actomyosin flows drive cellular rearrangements in early Caenorhabditis elegans development. eLife. 2020;9:e54930.
- Hench J, Henriksson J, Lüppert M, Bürglin TR. Spatio-temporal reference model of Caenorhabditis elegans embryogenesis with cell contact maps. Dev Biol. 2009;333(1):1-13.
- Richards JL, et al. A quantitative model of normal Caenorhabditis elegans embryogenesis and its disruption after stress. Dev Biol. 2013;374(1):12-23.
- Moore JL, Du Z, Bao Z. Systematic quantification of developmental phenotypes at single-cell resolution during embryogenesis. Development. 2013;140(15):3266-74.
- Wong MK, et al. Timing of tissue-specific cell division requires a differential onset of zygotic transcription during metazoan embryogenesis. J Biol Chem. 2016;291(24):12501-13.
Reprints and Permissions
This article has been published
Video Coming Soon