This protocol describes a standardized multicolor flow cytometry workflow for measurable residual disease assessment in acute leukemia, integrating controlled specimen processing, harmonized acquisition parameters, sequential gating strategies, and denominator-adjusted interpretation to improve analytical reproducibility in routine clinical laboratories.
A subscription to JoVE is required to view this content. Sign in or start your free trial.
Method Article
Standardized Multicolor Flow Cytometry Protocol for Measurable Residual Disease Assessment in Acute Leukemia
In This Article
Summary
Abstract
Measurable residual disease (MRD) is an important prognostic indicator in the management of acute leukemia. However, routine multicolor flow cytometric (MFC) assessment remains vulnerable to pre-analytical and analytical variability, including hemodilution, inconsistent acquisition depth, and subjective interpretation. This article presents a standardized operational workflow for routine MRD evaluation in B-cell acute lymphoblastic leukemia (B-ALL) and acute myeloid leukemia (AML). The protocol incorporates strict specimen acceptance criteria, with integrated hemodilution assessment, and uses a bulk red blood cell lysis method for bone marrow and peripheral blood specimens. Analytical standardization is achieved through disease-specific two-tube, eight-color antibody panels, harmonized acquisition targets requiring at least 500,000 CD45-positive events, and fixed sequential gating strategies. In addition, the workflow applies denominator-adjusted limits of detection (LOD) and quantification (LOQ) to support an objective three-tiered reporting system. Validation across 197 clinical specimens demonstrated strong repeatability, robust dilutional linearity, and high concordance with paired orthogonal molecular assays. Collectively, this protocol provides a practical framework for standardized MRD monitoring. for standardized MRD monitoring in routine clinical laboratories by integrating controlled pre-analytical handling and harmonized analytical parameters.
Introduction
Even after achieving morphological remission, patients with acute leukemia require ongoing monitoring for measurable residual disease (MRD) to assess relapse risk accurately. Conventional morphologic and cytopathologic examinations lack the sensitivity required to detect low-level residual leukemic populations. Consequently, MRD assessment has become an essential component of disease monitoring in both acute myeloid leukemia (AML) and B-cell acute lymphoblastic leukemia (B-ALL). Recent recommendations from the European LeukemiaNet emphasize that reliable MRD assessment in AML depends on technical standardization and interobserver reproducibility rather than simple assay availability1,2. In B-ALL, multicolor flow cytometry (MFC) remains particularly important for patients without stable molecular targets. Previous studies have demonstrated that standardized multicolor flow cytometric approaches using structured antibody panel designs can provide reproducible and sensitive residual disease detection3. Flow cytometry is widely used because of its broad applicability, rapid turnaround time, and cost-effectiveness. Assay performance remains highly dependent on standardized specimen preparation, acquisition parameters, and data interpretation4.
One of the major technical challenges in flow cytometric MRD assessment is rare-event detection, which is strongly influenced by acquisition depth and total event counts. Identical antibody panels may produce different analytical sensitivities if specimens are acquired with inconsistent denominator sizes5. Standardization, therefore, extends beyond antibody selection and requires harmonized specimen processing, bulk red blood cell lysis, instrument compensation, acquisition targets, and gating strategies. In bone marrow specimens, hemodilution also represents a significant pre-analytical variable because peripheral blood contamination may artificially reduce the apparent residual leukemic burden6,7. In addition, interpretation of low-frequency events requires clearly defined reporting thresholds based on specimen-specific acquisition depth. Recent studies have emphasized the importance of denominator-adjusted limits of detection (LOD) and quantification (LOQ) for improving the consistency of flow cytometric MRD interpretation8.
The overall goal of this protocol is to provide a standardized workflow for routine MFC-based MRD assessment in B-ALL and AML. The protocol integrates specimen acceptance criteria, hemodilution assessment, disease-specific antibody panel design, bulk-lysis sample preparation, harmonized acquisition targets, fixed sequential gating strategies, and denominator-adjusted reporting criteria into a single operational framework9,10. By combining standardized pre-analytical and analytical procedures, this method provides a practical and reproducible approach for routine clinical laboratory implementation of MRD monitoring. Figure 1 illustrates the overall standardized pre-analytical and analytical workflow implemented in this study. Table 1 summarizes the cohort and specimen characteristics of the patients with B-cell acute lymphoblastic leukemia (B-ALL) and acute myeloid leukemia (AML) enrolled during the validation period across predefined monitoring windows (End of Induction, Consolidation, and Pre-HSCT).
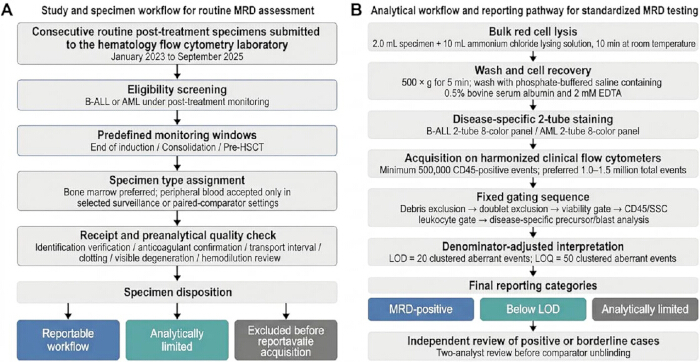
Figure 1: Standardized workflow for routine multicolor flow cytometric MRD assessment. (A) Pre-analytical workflow showing specimen screening and quality assessment across predefined monitoring intervals. (B) Analytical workflow from bulk red blood cell lysis and antibody staining through sequential gating, denominator-adjusted interpretation, and final MRD reporting. Please click here to view a larger version of this figure.
Table 1: Consolidated patient demographics, clinical specimen characteristics, and routine acquisition metrics. This single revised table summarizes the baseline clinical features of the enrolled cohort comprising B-cell acute lymphoblastic leukemia (B-ALL) and acute myeloid leukemia (AML) cases and combines patient-level demographics with specimen-level characteristics, treatment monitoring intervals, viability, hemodilution scores, acquisition depths, and denominator-adjusted measurable residual disease classifications. Please click here to download this Table.
Access restricted. Please log in or start a trial to view this content.
Protocol
All procedures involving human specimens were performed in accordance with institutional guidelines and approved by the Ethics Committee of The Second People’s Hospital of Neijiang (Approval No. PXTS887192). The study utilized de-identified residual clinical specimens obtained after routine diagnostic testing. Informed consent was waived because the study did not affect patient care, treatment allocation, or specimen collection procedures. The chemicals, reagents, and equipment used in the protocol are listed in the Table of Materials.
1. Specimen collection and pre-analytical assessment
- Collect bone marrow aspirates as the preferred specimen type for measurable residual disease (MRD) assessment. Use peripheral blood specimens only when bone marrow aspiration is clinically contraindicated or during selected surveillance and comparator analyses.
- Collect the bone marrow specimen during the first aspirate pull whenever possible. Avoid subsequent aspirate pulls to minimize peripheral blood contamination and underestimation of low-level residual disease.
- Transfer specimens into dipotassium ethylenediaminetetraacetic acid (K2-EDTA) or sodium-heparin anticoagulant tubes immediately after collection. Store and transport the specimens at room temperature (18–25 °C) and protect them from direct sunlight.
CAUTION: Do not refrigerate the specimens. - Process all specimens within 24 h of collection. For stability studies, retain aliquots for repeat analysis at 24 h and 48 h while maintaining room-temperature storage conditions.
- Verify the patient identifier, anticoagulant type, specimen integrity, and collection time upon specimen receipt. Reject specimens demonstrating extensive clotting, severe hemolysis, or marked cellular degeneration
- Assess bone marrow specimens for hemodilution before final interpretation. Calculate a semi-quantitative hemodilution score ranging from 0.00 to 1.00 to estimate peripheral blood contamination.
- Determine this value by dividing the proportion of mature lymphocytes by the sum of CD34-positive progenitors, immature granulocytes, and mature lymphocytes, where a higher quotient indicates greater dilutional effect.
NOTE: Compute the score using the following formula:

where a higher score indicates greater peripheral blood contamination. - Classify hemodilution scores as follows: <0.20, acceptable; 0.20–0.39, mildly hemodiluted; and ≥0.40, substantially hemodiluted.
NOTE: Do not assign definitive MRD-negative interpretations to markedly hemodiluted specimens unless adequate denominator size and preserved marrow precursor architecture are confirmed.
2. Disease-specific antibody panel preparation
- Prepare standardized disease-specific two-tube, eight-color antibody panels for B-ALL and AML analysis. Achieve panel standardization by strictly adhering to fixed backbone markers across all tubes for stable population gating.
- Utilize consistent fluorochrome conjugates for corresponding lineage antigens and strictly follow manufacturer-recommended titration volumes to minimize lot-to-lot fluorescence variability.
- Refer to Supplementary Table 1 for marker combinations, fluorochrome assignments, antibody clones, staining volumes, and acquisition parameters.
- For B-ALL assessment, use CD19, CD45, CD34, CD10, and CD20 as backbone markers in both tubes to define precursor populations and maturation patterns. Add CD38, CD58, and CD81 to Tube 1.
- Add CD66c, CD123, and either CD73 or CD304 to Tube 2 according to the diagnostic leukemia-associated immunophenotype established at baseline evaluation.
- For AML assessment, use CD45, CD34, CD117, CD13, CD33, and HLA-DR as backbone markers in both tubes to define blast and immature myeloid populations.
- Add CD7 and CD56 to Tube 1 to evaluate cross-lineage antigen expression. Add CD11b and CD15 to Tube 2 to evaluate myeloid maturation abnormalities.
3. Bulk-lysis preparation and staining
- Transfer 2.0 mL of well-mixed bone marrow or peripheral blood specimen into a 15 mL polypropylene tube. If specimen volume is limited, use a minimum input volume of 1.0 mL.
- Add 10 mL of prewarmed ammonium chloride lysis buffer to the specimen. Incubate the suspension for 10 min at room temperature to lyse red blood cells.
- Centrifuge the specimen at 500 × g for 5 min. Discard the supernatant carefully without disturbing the nucleated cell pellet.
- Resuspend the pellet in 2 mL of phosphate-buffered saline (PBS) containing 0.5% bovine serum albumin (BSA) and 2 mM ethylenediaminetetraacetic acid (EDTA). Repeat the wash step once if residual hemoglobin contamination remains visible.
- Determine nucleated cell concentration using an automated hematology analyzer or manual hemocytometer count with trypan blue exclusion. Consider a minimum nucleated cell concentration of 5 × 10⁶ cells/mL as optimal for standard acquisition.
NOTE: If the cellular yield falls below this threshold, concentrate the specimen by an additional centrifugation at 500 × g for 5 min, and carefully reduce the resuspension buffer volume to maximize cellular density. - Aliquot 5 × 10⁶ nucleated cells per tube for routine staining. Increase the input to a maximum of 1 × 10⁷ cells per tube for high-sensitivity analysis when specimen recovery permits6,7.
- Add the individually titrated antibody cocktail and the fixable viability dye specified in the Table of Materials to each tube according to the validated staining panel configuration. The routine validated panel uses 5 µL per fluorochrome-conjugated antibody unless manufacturer-recommended titration indicates a different antibody-specific volume.
- Ensure the final staining reaction volume is strictly maintained at 100 µL per test to preserve optimal antibody-to-antigen stoichiometry. Incubate the specimens for 15 min at room temperature in the dark.
- Wash the stained cells once using wash buffer and resuspend the final pellet in 500 µL of acquisition buffer.
- Prepare single-stained compensation controls using compensation beads on the same day as specimen acquisition.
4. Instrument setup and data acquisition
- Perform daily start-up quality control on the flow cytometer before acquiring patient specimens. Verify fluidics, laser alignment, detector performance, and fluorescence target values using calibration beads, following the manufacturer’s instructions.
- Prepare single-stained compensation controls using the same fluorochromes included in the antibody panels. Adjust the compensation matrix before patient acquisition and confirm that the backbone markers remain within the predefined fluorescence target ranges.
- Use the same acquisition template, detector settings, compensation strategy, and gating hierarchy for all specimens analyzed during the validation period.
NOTE: Ensure proper harmonization across instruments by establishing standardized target median fluorescence intensity values for all detectors using specialized calibration beads, and confirm that identical samples yield comparable fluorescence profiles across platforms before clinical data acquisition. - Acquire data at a low-to-moderate flow rate to reduce coincident events and preserve rare-event detection accuracy. Monitor the event rate continuously during acquisition.
- Acquire at least 500,000 CD45-positive nucleated events for each reportable MRD result. When specimen quality and event stability permit, extend acquisition to 1.0–1.5 million total events, especially when low-level residual disease is suspected.
- Pause or stop acquisition if fluidic instability, sample clogs, abrupt event-rate changes, or visible deterioration in scatter quality occur. Refilter or remix the specimen when appropriate, and reacquire the sample only after stable flow is restored.
5. Sequential gating and denominator-adjusted interpretation
- Analyze the flow cytometry data using validated flow cytometry analysis software. Use the same sequential gating strategy for all specimens to reduce inter-operator variability.
- Establish normal and regenerating maturation patterns by independently acquiring and analyzing a reference bank of at least 20 normal or regenerating bone marrow specimens to serve as baseline expression templates.
- Exclude debris using forward scatter and side scatter parameters. Isolate single cells by applying forward scatter-area versus forward scatter-height gating.
- Exclude non-viable cells using the viability dye gate listed in the Materials table. Eliminate these non-viable cells routinely because they exhibit non-specific antibody binding and can artificially elevate background noise or mimic rare aberrant populations.
NOTE: Require a minimum viability threshold of 75% for optimal downstream analysis, noting that specimens falling below this value warrant cautious interpretation regarding potential rare-event artifacts. Define the leukocyte denominator by gating on viable CD45-positive events with appropriate side scatter characteristics. - For B-ALL specimens, restrict analysis to the CD19-positive precursor compartment. Implement an alternative gating framework for patients receiving anti-CD19 targeted therapies.
- Shift the primary evaluation to CD22, CD24, or CD34-positive compartments to capture the leukemic population independent of CD19 expression. Evaluate CD34, CD10, and CD20 maturation patterns and identify aberrant populations using CD38, CD58, CD81, CD66c, CD123, and CD73 or CD304 expression patterns.
- For AML specimens, define the blast or precursor region using CD45, side scatter, CD34, and CD117 expression.
- Evaluate aberrant or asynchronous expression of myeloid and cross-lineage markers, including CD13, CD33, HLA-DR, CD7, CD56, CD11b, and CD15.
- Calculate the specimen-specific limit of detection (LOD) and limit of quantification (LOQ) using the total number of acquired viable CD45-positive events as the denominator:


- Classify the final MRD interpretation into one of three categories: MRD-positive, below LOD, or analytically limited.
- Assign the result as MRD-positive when a clear, contiguous cluster of aberrant events exceeds the specimen-specific LOD and demonstrates an internally consistent immunophenotype distinct from normal or regenerating hematopoietic populations.
NOTE: Do not classify scattered, non-clustered events as MRD-positive. Utilize an integrated analysis approach combining both the leukemia-associated immunophenotype (LAIP) tracked from the baseline diagnostic sample and different-from-normal (DfN) pattern recognition strategies. - Assign the result as below LOD when rare suspicious events are present but do not reach the specimen-specific reportable threshold.
- Assign the result as analytically limited when the denominator size is insufficient, hemodilution is substantial, specimen quality is poor, or pre-analytical or analytical limitations prevent a confident negative interpretation.
- Assign the result as MRD-positive when a clear, contiguous cluster of aberrant events exceeds the specimen-specific LOD and demonstrates an internally consistent immunophenotype distinct from normal or regenerating hematopoietic populations.
- Review all MRD-positive and borderline low-level cases independently by a second qualified analyst.
- Finalize the flow cytometry interpretation before reviewing paired molecular comparator data, including quantitative polymerase chain reaction or next-generation sequencing results.
6. Analytical validation methodology
- Assess analytical repeatability by preparing duplicate aliquots from the same post-lysis cell suspension. Acquire and analyze at least 30 paired specimens independently.
- Evaluate dilutional linearity by preparing serial dilutions across six levels within the expected low-burden range. Compare observed MRD values with expected MRD values across the dilution series.
- Assess inter-operator and inter-instrument reproducibility by analyzing reference specimens across multiple qualified operators and harmonized flow cytometers.
- Transform flow cytometric and paired molecular MRD percentages using log10 transformation before statistical comparison. Evaluate quantitative agreement using correlation analysis and Bland-Altman analysis.
Access restricted. Please log in or start a trial to view this content.
Results
Characteristics of the routine implementation dataset
During the study period, 197 consecutive specimens passed eligibility screening and pre-analytical quality assessment and entered the reportable workflow. The study cohort included 98 patients, 62 (63.3%) with B-cell acute lymphoblastic leukemia (B-ALL) and 36 (36.7%) with acute myeloid leukemia (AML). The cohort consisted of 64 males (65.3%) and 34 females (34.7%), with a median age of 32 years (interquartile range [IQR], ...
Access restricted. Please log in or start a trial to view this content.
Discussion
The primary objective of this study was to establish a standardized workflow for multicolor flow cytometric assessment of measurable residual disease (MRD) in acute leukemia. Reliable MRD evaluation depends not only on antibody panel selection, but also on consistent specimen handling, acquisition parameters, and data interpretation11. The results of this study demonstrate that harmonized specimen processing, controlled acquisition depth, and denominator-adjusted reporting criteria can improve ana...
Access restricted. Please log in or start a trial to view this content.
Disclosures
The authors have nothing to disclose.
Acknowledgements
The author thanks the Department of Clinical Laboratory at The Second People’s Hospital of Neijiang for providing laboratory facilities and technical support for this study. The author also acknowledges the laboratory staff and clinical personnel for their assistance with specimen processing and data collection. Finally, the author thanks the patients whose residual clinical specimens contributed to this work. This research received no specific funding from public, commercial, or not-for-profit funding agencies.
Access restricted. Please log in or start a trial to view this content.
Materials
| Name | Company | Catalog Number | Comments |
|---|---|---|---|
| Acquisition buffer | Laboratory-prepared | PBS containing 0.5% BSA and 2 mM EDTA; final resuspension volume 500 µL | Final resuspension before flow cytometric acquisition |
| AML Tube 1 anti-CD117-APC antibody | BD Biosciences (Franklin Lakes, NJ, USA) / Beckman Coulter (Brea, CA, USA) | Clone: 104D2; fluorochrome: APC; staining volume: 5 µL/test in the routine validated panel unless antibody-specific titration differs | Early myeloid/blast identification |
| AML Tube 1 anti-CD13-FITC antibody | BD Biosciences (Franklin Lakes, NJ, USA) / Beckman Coulter (Brea, CA, USA) | Clone: L138; fluorochrome: FITC; staining volume: 5 µL/test in the routine validated panel unless antibody-specific titration differs | Myeloid lineage anchor |
| AML Tube 1 anti-CD33-PE antibody | BD Biosciences (Franklin Lakes, NJ, USA) / Beckman Coulter (Brea, CA, USA) | Clone: P67.6; fluorochrome: PE; staining volume: 5 µL/test in the routine validated panel unless antibody-specific titration differs | Myeloid lineage anchor |
| AML Tube 1 anti-CD34-PerCP-Cy5.5 antibody | BD Biosciences (Franklin Lakes, NJ, USA) / Beckman Coulter (Brea, CA, USA) | Clone: 8G12; fluorochrome: PerCP-Cy5.5; staining volume: 5 µL/test in the routine validated panel unless antibody-specific titration differs | Immaturity marker |
| AML Tube 1 anti-CD45-APC-H7 antibody | BD Biosciences (Franklin Lakes, NJ, USA) / Beckman Coulter (Brea, CA, USA) | Clone: 2D1; fluorochrome: APC-H7; staining volume: 5 µL/test in the routine validated panel unless antibody-specific titration differs | Leukocyte backbone marker and denominator definition |
| AML Tube 1 anti-CD56-V500 antibody | BD Biosciences (Franklin Lakes, NJ, USA) / Beckman Coulter (Brea, CA, USA) | Clone: NCAM16.2; fluorochrome: V500; staining volume: 5 µL/test in the routine validated panel unless antibody-specific titration differs | Aberrant blast-associated phenotyping |
| AML Tube 1 anti-CD7-V450 antibody | BD Biosciences (Franklin Lakes, NJ, USA) / Beckman Coulter (Brea, CA, USA) | Clone: M-T701; fluorochrome: V450; staining volume: 5 µL/test in the routine validated panel unless antibody-specific titration differs | Cross-lineage aberrancy detection |
| AML Tube 1 anti-HLA-DR-PE-Cy7 antibody | BD Biosciences (Franklin Lakes, NJ, USA) / Beckman Coulter (Brea, CA, USA) | Clone: G46-6; fluorochrome: PE-Cy7; staining volume: 5 µL/test in the routine validated panel unless antibody-specific titration differs | Maturation and subtype discrimination |
| AML Tube 2 anti-CD117-APC antibody | BD Biosciences (Franklin Lakes, NJ, USA) / Beckman Coulter (Brea, CA, USA) | Clone: 104D2; fluorochrome: APC; staining volume: 5 µL/test in the routine validated panel unless antibody-specific titration differs | Early myeloid/blast identification |
| AML Tube 2 anti-CD11b-V450 antibody | BD Biosciences (Franklin Lakes, NJ, USA) / Beckman Coulter (Brea, CA, USA) | Clone: ICRF44; fluorochrome: V450; staining volume: 5 µL/test in the routine validated panel unless antibody-specific titration differs | Maturation-discordance assessment |
| AML Tube 2 anti-CD13-FITC antibody | BD Biosciences (Franklin Lakes, NJ, USA) / Beckman Coulter (Brea, CA, USA) | Clone: L138; fluorochrome: FITC; staining volume: 5 µL/test in the routine validated panel unless antibody-specific titration differs | Myeloid lineage anchor |
| AML Tube 2 anti-CD15-V500 antibody | BD Biosciences (Franklin Lakes, NJ, USA) / Beckman Coulter (Brea, CA, USA) | Clone: HI98; fluorochrome: V500; staining volume: 5 µL/test in the routine validated panel unless antibody-specific titration differs | Different-from-normal myeloid pattern assessment |
| AML Tube 2 anti-CD33-PE antibody | BD Biosciences (Franklin Lakes, NJ, USA) / Beckman Coulter (Brea, CA, USA) | Clone: P67.6; fluorochrome: PE; staining volume: 5 µL/test in the routine validated panel unless antibody-specific titration differs | Myeloid lineage anchor |
| AML Tube 2 anti-CD34-PerCP-Cy5.5 antibody | BD Biosciences (Franklin Lakes, NJ, USA) / Beckman Coulter (Brea, CA, USA) | Clone: 8G12; fluorochrome: PerCP-Cy5.5; staining volume: 5 µL/test in the routine validated panel unless antibody-specific titration differs | Immaturity marker |
| AML Tube 2 anti-CD45-APC-H7 antibody | BD Biosciences (Franklin Lakes, NJ, USA) / Beckman Coulter (Brea, CA, USA) | Clone: 2D1; fluorochrome: APC-H7; staining volume: 5 µL/test in the routine validated panel unless antibody-specific titration differs | Leukocyte backbone marker and denominator definition |
| AML Tube 2 anti-HLA-DR-PE-Cy7 antibody | BD Biosciences (Franklin Lakes, NJ, USA) / Beckman Coulter (Brea, CA, USA) | Clone: G46-6; fluorochrome: PE-Cy7; staining volume: 5 µL/test in the routine validated panel unless antibody-specific titration differs | Maturation and subtype discrimination |
| Ammonium chloride-based red blood cell lysis buffer | Laboratory-prepared / commercial supplier | Ammonium chloride-based lysis buffer; 10 mL/test; 10 min at room temperature | Bulk red blood cell lysis |
| Analysis software | Beckman Coulter (Brea, CA, USA) | Kaluza 2.1 | Data analysis and sequential gating |
| Automated hematology analyzer | Commercial supplier | Automated hematology analyzer used for nucleated cell concentration and viability assessment | Nucleated cell concentration and viability assessment |
| B-ALL Tube 1 anti-CD10-PE antibody | BD Biosciences (Franklin Lakes, NJ, USA) / Beckman Coulter (Brea, CA, USA) | Clone: HI10a; fluorochrome: PE; staining volume: 5 µL/test in the routine validated panel unless antibody-specific titration differs | Precursor B-cell definition |
| B-ALL Tube 1 anti-CD19-FITC antibody | BD Biosciences (Franklin Lakes, NJ, USA) / Beckman Coulter (Brea, CA, USA) | Clone: SJ25C1; fluorochrome: FITC; staining volume: 5 µL/test in the routine validated panel unless antibody-specific titration differs | B-lineage identification and entry into precursor compartment |
| B-ALL Tube 1 anti-CD20-APC antibody | BD Biosciences (Franklin Lakes, NJ, USA) / Beckman Coulter (Brea, CA, USA) | Clone: L27; fluorochrome: APC; staining volume: 5 µL/test in the routine validated panel unless antibody-specific titration differs | Maturation pattern assessment |
| B-ALL Tube 1 anti-CD34-PerCP-Cy5.5 antibody | BD Biosciences (Franklin Lakes, NJ, USA) / Beckman Coulter (Brea, CA, USA) | Clone: 8G12; fluorochrome: PerCP-Cy5.5; staining volume: 5 µL/test in the routine validated panel unless antibody-specific titration differs | Immaturity marker |
| B-ALL Tube 1 anti-CD38-PE-Cy7 antibody | BD Biosciences (Franklin Lakes, NJ, USA) / Beckman Coulter (Brea, CA, USA) | Clone: HIT2; fluorochrome: PE-Cy7; staining volume: 5 µL/test in the routine validated panel unless antibody-specific titration differs | Separation from regenerating normal precursors |
| B-ALL Tube 1 anti-CD45-APC-H7 antibody | BD Biosciences (Franklin Lakes, NJ, USA) / Beckman Coulter (Brea, CA, USA) | Clone: 2D1; fluorochrome: APC-H7; staining volume: 5 µL/test in the routine validated panel unless antibody-specific titration differs | Leukocyte backbone marker and denominator definition |
| B-ALL Tube 1 anti-CD58-V450 antibody | BD Biosciences (Franklin Lakes, NJ, USA) / Beckman Coulter (Brea, CA, USA) | Clone: TS2/9; fluorochrome: V450; staining volume: 5 µL/test in the routine validated panel unless antibody-specific titration differs | Aberrancy detection in residual leukemic precursors |
| B-ALL Tube 1 anti-CD81-V500 antibody | BD Biosciences (Franklin Lakes, NJ, USA) / Beckman Coulter (Brea, CA, USA) | Clone: JS-81; fluorochrome: V500; staining volume: 5 µL/test in the routine validated panel unless antibody-specific titration differs | Support for abnormal precursor recognition |
| B-ALL Tube 2 anti-CD10-PE antibody | BD Biosciences (Franklin Lakes, NJ, USA) / Beckman Coulter (Brea, CA, USA) | Clone: HI10a; fluorochrome: PE; staining volume: 5 µL/test in the routine validated panel unless antibody-specific titration differs | Precursor B-cell definition |
| B-ALL Tube 2 anti-CD123-V450 antibody | BD Biosciences (Franklin Lakes, NJ, USA) / Beckman Coulter (Brea, CA, USA) | Clone: 9F5; fluorochrome: V450; staining volume: 5 µL/test in the routine validated panel unless antibody-specific titration differs | Aberrant precursor phenotyping |
| B-ALL Tube 2 anti-CD19-FITC antibody | BD Biosciences (Franklin Lakes, NJ, USA) / Beckman Coulter (Brea, CA, USA) | Clone: SJ25C1; fluorochrome: FITC; staining volume: 5 µL/test in the routine validated panel unless antibody-specific titration differs | B-lineage identification and entry into precursor compartment |
| B-ALL Tube 2 anti-CD20-APC antibody | BD Biosciences (Franklin Lakes, NJ, USA) / Beckman Coulter (Brea, CA, USA) | Clone: L27; fluorochrome: APC; staining volume: 5 µL/test in the routine validated panel unless antibody-specific titration differs | Maturation pattern assessment |
| B-ALL Tube 2 anti-CD34-PerCP-Cy5.5 antibody | BD Biosciences (Franklin Lakes, NJ, USA) / Beckman Coulter (Brea, CA, USA) | Clone: 8G12; fluorochrome: PerCP-Cy5.5; staining volume: 5 µL/test in the routine validated panel unless antibody-specific titration differs | Immaturity marker |
| B-ALL Tube 2 anti-CD45-APC-H7 antibody | BD Biosciences (Franklin Lakes, NJ, USA) / Beckman Coulter (Brea, CA, USA) | Clone: 2D1; fluorochrome: APC-H7; staining volume: 5 µL/test in the routine validated panel unless antibody-specific titration differs | Leukocyte backbone marker and denominator definition |
| B-ALL Tube 2 anti-CD66c-PE-Cy7 antibody | BD Biosciences (Franklin Lakes, NJ, USA) / Beckman Coulter (Brea, CA, USA) | Clone: KOR-SA3544; fluorochrome: PE-Cy7; staining volume: 5 µL/test in the routine validated panel unless antibody-specific titration differs | Leukemia-associated aberrancy support |
| B-ALL Tube 2 anti-CD73/CD304*-V500 antibody | BD Biosciences (Franklin Lakes, NJ, USA) / Beckman Coulter (Brea, CA, USA) | Clone: AD2/AZ1; fluorochrome: V500; staining volume: 5 µL/test in the routine validated panel unless antibody-specific titration differs | Additional aberrancy confirmation according to diagnostic phenotype |
| Bone marrow / peripheral blood specimens | The Second People’s Hospital of Neijiang | Residual clinical specimens | MRD assessment |
| Compensation beads | Commercial supplier | Single-stained compensation beads used on the same day as specimen acquisition | Same-day compensation control preparation |
| Fixable viability dye | Commercial supplier | Fixable viability dye included in every staining tube | Exclusion of non-viable cells; viability gate referenced in Protocols 3.7 and 5.4 |
| Flow cytometer | BD Biosciences (Franklin Lakes, NJ, USA) / Beckman Coulter (Brea, CA, USA) | FACSCanto II / Navios EX | Multicolor flow cytometric acquisition |
| Manual hemocytometer | Commercial supplier | Manual hemocytometer count | Manual nucleated cell counting |
| PBS/BSA/EDTA wash buffer | Laboratory-prepared | Phosphate-buffered saline containing 0.5% bovine serum albumin and 2 mM EDTA | Cell washing and resuspension |
| Trypan blue solution | Commercial supplier | Trypan blue exclusion | Manual viability assessment by trypan blue exclusion |
| Validated antibody cocktails | BD Biosciences (Franklin Lakes, NJ, USA) / Beckman Coulter (Brea, CA, USA) | See antibody-specific rows below and Supplementary Table S1 | MRD immunophenotypic detection |
References
- Heuser M, et al. 2021 update on measurable residual disease in acute myeloid leukemia: A consensus document from the European LeukemiaNet MRD Working Party. Blood. 2021;138(26):2753–67.
- Cloos J, Heuser M, Freeman SD. 2025 update on MRD in acute myeloid leukemia: A consensus document from the European LeukemiaNet MRD Working Party. Blood. 2025;147(11):1147–64.
- Verbeek MWC, Lucio P, Szczepański T. Minimal residual disease assessment in B-cell precursor acute lymphoblastic leukemia by standardized next-generation flow cytometry. eJHaem. 2024;5(2):110–20.
- Virk H, Jain P, Sengar M. Flow cytometric MRD assessment in acute lymphoblastic leukemia: Practical advantages and interpretive considerations. Indian J Hematol Blood Transfus. 2023;39(3):350–62.
- Brando B. Rules in rare event acquisition: An overview. Cytometry B Clin Cytom. 2019;96(6):448–53.
- EuroFlow Consortium. Standardized EuroFlow Protocols [Internet]. EuroFlow; 2025. Available from: https://euroflow.org/protocols/ (accessed 2026 Jan 15).
- Tettero JM, Heidinga ME, Mocking TR. Impact of hemodilution on flow cytometry-based measurable residual disease assessment in acute myeloid leukemia. Leukemia. 2024;38(2):297–305.
- Buccisano F, et al. Prognostic and therapeutic implications of measurable residual disease in acute myeloid leukemia. Blood. 2012;119(2):332–41.
- Schuurhuis GJ, Heuser M, Freeman S. Minimal/measurable residual disease in AML: A consensus document from the European LeukemiaNet MRD Working Party. Blood. 2018;131(12):1275–91.
- Terwijn M, van Putten WLJ, Kelder A. High prognostic impact of flow cytometric minimal residual disease detection in acute myeloid leukemia: Data from the HOVON/SAKK AML 42A study. J Clin Oncol. 2013;31(31):3889–97.
- Smith AB, Jones CD. Computational models, and tools for future development in flow cytometry. Cancer Metastasis Rev. 2026;45(1):88–102.
- Jum’ah HA, Ali S, Hwang Y. Measurable residual disease analysis by flow cytometry: Assay validation and characterization of 385 consecutive cases of acute myeloid leukemia. Cancers. 2025;17(7):1155.
- Theunissen P, et al. Standardized EuroFlow flow cytometric method for B-cell precursor acute lymphoblastic leukemia (BCP-ALL) MRD assessment. Blood. 2017;129(3):347–57.
- Haaksma LH, Mocking TR, Kelder A. Flow cytometric and molecular measurable residual disease in acute myeloid leukemia. Leuk Lymphoma. 2025;66(1):45–55.
- Das N, Yadav P, Seth T. Analytical appraisal of hematogones in B-ALL MRD assessment using multidimensional dot-plots by multiparametric flow cytometry: A critical review and update. Indian J Hematol Blood Transfus. 2024;40(1):12–24.
- Korkina YS, Popov AM, Tserenov DG. False-positive flow cytometric measurable residual disease in B-cell precursor acute lymphoblastic leukemia. Cytometry B Clin Cytom. 2024;106(2):120–31.
- Mocking TR, et al. Computational measurable residual disease assessment in acute myeloid leukemia: a retrospective validation in the HOVON-SAKK-132 trial. Leukemia. 2025;39(10):2559–62.
Access restricted. Please log in or start a trial to view this content.