This protocol combines pan-cancer bioinformatics analysis with immunohistochemical validation in colon cancer to evaluate Transmembrane Emp24 Protein Transport Domain 3 expression, prognostic significance, immune associations, and related biological pathways using public multiomics databases and clinical tissue samples.
Research Article
Pan-cancer Bioinformatics Analysis Combined with Colon Cancer Experimental Validation: A Study on TMED3 as a Diagnostic and Prognostic Biomarker
* These authors contributed equally
In This Article
Summary
Abstract
Transmembrane Emp24 Protein Transport Domain 3 (TMED3), a member of the p24 protein family, has been implicated in tumor proliferation, invasion, and migration. This study aimed to evaluate the expression patterns, prognostic significance, immune associations, and potential biological functions of TMED3 across multiple cancer types using pan-cancer bioinformatics analysis combined with immunohistochemical (IHC) validation in colon cancer. Multiomics datasets from The Cancer Genome Atlas, Genotype-Tissue Expression, UALCAN, Human Protein Atlas, and cBioPortal databases were analyzed to investigate TMED3 expression and genetic alterations in pan-cancer. Immunohistochemistry was performed to evaluate TMED3 protein expression in colon cancer tissues. Kaplan–Meier survival analysis and Cox regression analysis were used to assess the prognostic value of TMED3. Spearman correlation analysis was conducted to evaluate the associations of TMED3 with tumor mutational burden, microsatellite instability (MSI), immune cell infiltration, and immune checkpoints. Gene Set Enrichment Analysis was performed to investigate potential biological pathways associated with TMED3 in colon cancer. TMED3 expression was elevated in most tumor types and was associated with unfavorable overall survival and disease-specific survival in adrenocortical carcinoma, colon adenocarcinoma, and uveal melanoma. The greatest frequency of TMED3 genetic alterations was identified in mesothelioma, with amplification representing the predominant alteration type. In addition, TMED3 expression showed significant correlations with tumor mutational burden and microsatellite instability in kidney renal clear cell carcinoma, stomach adenocarcinoma, and uterine corpus endometrial carcinoma. TMED3 expression was also associated with immune infiltration and immune checkpoint expression in several tumors. IHC analysis demonstrated increased TMED3 expression in colon cancer tissues compared with normal colon tissues and showed an association with T stage. Functional enrichment analysis identified pathways related to ribosome, antigen processing and presentation, oxidative phosphorylation, and pentose phosphate. These findings indicate that TMED3 may represent a promising biomarker for the diagnosis and prognostic evaluation of colon cancer as well as other tumor types.
Introduction
The Transmembrane Emp24 Domain (TMED) protein family is composed of four subfamilies (α, β, γ, and δ) that commonly exist as monomers, dimers, or oligomeric complexes in eukaryotic cells. Members of the TMED family are involved in intracellular vesicle trafficking and have been implicated in a variety of human diseases, including cancer, immune-related disorders, diabetes, neurodegenerative diseases, nonalcoholic fatty liver disease, dilated cardiomyopathy, mucin 1 kidney disease (MKD), and Sjögren syndrome (SS)1. Transmembrane emp24 domain-containing protein 3 (TMED3), a member of the p24 protein family, is a highly conserved single-pass type I transmembrane protein encoded on chromosome 15q25.1 in humans2,3. Accumulating evidence has demonstrated that TMED3 is aberrantly expressed in several malignancies and is involved in tumor initiation, proliferation, invasion, metastasis, and progression. Elevated TMED3 expression has been reported in osteosarcoma4, lung squamous cell carcinoma5, breast cancer6, endometrial carcinoma7, and colorectal cancer8. Experimental studies have shown that suppression of TMED3 expression inhibits tumor cell proliferation, metastatic ability, and anti-apoptotic activity, thereby restraining tumor progression. In glioma, TMED3 overexpression has been associated with higher tumor grade and poorer prognosis, and TMED3 has been reported to promote glioblastoma progression through regulation of ZBTB7A9. Although previous investigations have explored the biological role of TMED3 in specific tumor types, its expression patterns, prognostic significance, and molecular functions across pan-cancer have not yet been systematically characterized.
Recent advances in multiomics databases and bioinformatics analysis have enabled systematic evaluation of gene expression, prognosis, immune characteristics, and molecular alterations across different tumor types. Compared with single-cohort studies, integrated pan-cancer analysis using publicly available databases provides a broader approach for identifying potential biomarkers and therapeutic targets across cancers. In the present study, comprehensive bioinformatics analyses were conducted to explore the role of TMED3 across multiple cancer types using publicly available multiomics databases, including The Cancer Genome Atlas (TCGA), Genotype-Tissue Expression (GTEx), UALCAN, Human Protein Atlas, and cBioPortal. The study systematically evaluated TMED3 expression patterns, clinicopathological characteristics, prognostic significance, immune-related associations, and potential biological functions in pan-cancer. In addition, immunohistochemical (IHC) analysis was performed in colon cancer tissues to validate TMED3 protein expression and its association with clinicopathological features. Our pan-cancer analysis serves as a screening strategy to identify candidate biomarkers. We then performed experimental validation specifically in colorectal cancer (CRC). The results demonstrate that TMED3 is a promising prognostic biomarker in CRC, although its relevance to other cancer types requires further investigation.
Protocol
All procedures involving human tissues were performed in accordance with institutional biosafety and ethical guidelines and inside a certified biological safety cabinet. The study protocol was approved by the Research Ethics Committee of Tangshan Central Hospital (No. TZYL/K/2023-16), and written informed consent was obtained from all participants before sample collection.
Data collection
TMED3 expression profile data from different tumor and unpaired normal tissues were obtained from the TCGA and GTEx databases10,11 (TCGA: https://portal.gdc.cancer.gov/; GTEx: https://gtexportal.org/; accessed on July 1, 2025). Wilcoxon rank-sum tests were performed to analyze differential TMED3 expression between tumor and unpaired normal tissues. Transcript per million (TPM)-normalized RNA sequencing expression matrices downloaded from UCSC Xena were used for downstream analyses. Expression values were harmonized using log2(TPM + 1) transformation prior to statistical analysis. TMED3 expression data for 33 tumor types and matched normal tissues were subsequently downloaded from the TCGA database. Wilcoxon signed-rank tests were employed to evaluate differential TMED3 expression between tumors and matched normal tissues. Differential TMED3 protein expression between tumor and normal tissues was obtained from the UALCAN database12 (http://ualcan.path.uab.edu; accessed on July 1, 2025). The proteomics analysis module was accessed, and the “Pan-cancer View” option was selected for analysis. Protein expression analyses were performed using the CPTAC datasets available through the UALCAN “Pan-cancer View” module with default platform settings and without additional sample filtering.
Analysis of clinicopathological features
Clinicopathological information from 33 tumor types in the TCGA database was collected to investigate the relationship between TMED3 expression and pathological stage. Tumor stages were categorized into early-stage (stage I–II) and advanced-stage (stage III–IV) groups. Differences in TMED3 expression between stage groups were evaluated using Wilcoxon rank-sum tests across multiple cancer types.
Prognostic analysis
Survival time and survival status data from 33 tumor types were obtained for prognostic analysis. Normal cases and cases without clinical information were excluded. Missing values were handled according to the missingness of each variable. TMED3 expression was divided into high- and low-expression groups according to the median expression value. The survival package (Version 3.2-7) in R statistical analysis software (version 4.2.1) was used to perform Cox proportional hazards regression analysis. The results were visualized using the survminer and ggplot2 packages. Overall survival (OS) was defined as the interval from diagnosis to death from any cause, whereas disease-specific survival (DSS) was defined as the interval from diagnosis to death attributable to the specific cancer, with deaths unrelated to the malignancy treated as censored events. Kaplan–Meier survival analyses were subsequently performed to assess the relationships between TMED3 expression and both OS and DSS in colon adenocarcinoma (COAD).
Mutation analysis
The cBioPortal database (www.cbioportal.org; accessed on July 5, 2025) was used to analyze the frequency of TMED3 genetic alterations across 33 cancer types13. The cBioPortal website was accessed, and “TMED3” was entered into the quick search bar to analyze the mutation profile of TMED3 across multiple cancer types. Genetic alterations of TMED3 mainly included mutation, amplification, deep deletion, and multiple alterations. Default pan-cancer studies and query settings available in cBioPortal were used for mutation analysis without additional filtering.
Correlation analysis of DNA methylation
DNA methylation analysis was performed to evaluate the promoter methylation status of TMED3 in tumor and normal tissues using the UALCAN database (https://ualcan.path.uab.edu/; accessed on July 5, 2025). The DNA methylation status of the TMED3 promoter region was analyzed using Level 3 methylation data generated from the Illumina Infinium HumanMethylation450K platform in TCGA. Methylation levels were expressed as β values, calculated as β = methylated probe intensity / (methylated probe intensity + unmethylated probe intensity), with values ranging from 0 (unmethylated) to 1 (fully methylated). CpG probes located within 1500 bp upstream of the transcription start site (TSS), including the TSS200 and TSS1500 regions defined by UALCAN, were analyzed to evaluate promoter methylation status. UALCAN automatically extracted all available CpG probes within the promoter region of the target gene without additional filtering. Methylation β values from pan-cancer and normal tissues were obtained, and unpaired two-sample t tests were performed to compare differences between groups. A significance threshold of α = 0.05 was used, and P < 0.05 was considered statistically significant.
Analysis of the interrelation between TMED3, tumor mutational burden, and microsatellite instability
Tumor mutational burden (TMB) and microsatellite instability (MSI) were analyzed to investigate their associations with TMED3 expression across multiple cancer types. Uniformly processed pan-cancer datasets were downloaded from the UCSC Xena database (https://xenabrowser.net/; accessed on July 5, 2025), and TMED3 expression profiles were extracted for subsequent analyses. Level 4 Simple Nucleotide Variation data for TCGA samples generated using MuTect2 were obtained from the Genomic Data Commons (GDC) database (https://portal.gdc.cancer.gov/)14. TMED3 expression data were integrated with TMB datasets, and expression values were normalized using log2(x + 1) transformation before statistical analysis. MSI scores for individual tumor types were collected from previously published studies15 and subsequently merged with TMED3 expression data following the same normalization procedure. Associations between TMED3 expression and TMB/MSI were assessed using Spearman correlation analysis in pan-cancer datasets16,17.
Analysis of immune characteristics of TMED3
The ESTIMATE algorithm was applied to calculate stromal scores, immune scores, and ESTIMATE scores for multiple tumor types. Stromal and immune infiltration scores in pan-cancer datasets were generated using the estimate package (Version 1.0.13) in the statistical analysis software. Differences in stromal score, immune score, and ESTIMATE score between high- and low-TMED3-expression groups were evaluated using Wilcoxon rank-sum tests. In addition, immune checkpoint-related analyses were conducted to investigate the relationships between TMED3 expression and immune checkpoint molecules, including programmed cell death protein 1 (PD-1), programmed death-ligand 1 (PD-L1), and cytotoxic T-lymphocyte-associated protein 4 (CTLA4), across different cancer types. STAR-count expression data and corresponding clinical information for COAD were downloaded from the TCGA database. TPM-formatted expression matrices were extracted and normalized using log2(TPM + 1) transformation. Expression profiles of eight immune checkpoint-related genes were subsequently obtained from COAD samples, and correlations between TMED3 expression and immune checkpoint markers were analyzed using Spearman correlation analysis.
Drug sensitivity analysis
Drug sensitivity analysis was conducted using the GSCALite platform to investigate the relationship between TMED3 expression and anticancer drug responsiveness across various cancer types18. Level 3 RNA sequencing data and corresponding clinical information for COAD samples were obtained from the TCGA dataset. Predicted chemotherapy responses for each sample were generated using data from the Genomics of Drug Sensitivity in Cancer (GDSC) database (https://www.cancerrxgene.org/). Drug response prediction was carried out using the pRRophetic package in the statistical analysis software. Estimated half-maximal inhibitory concentration (IC50) values were calculated using ridge regression with default settings, including batch-effect correction through the combat algorithm and tissue-specific adjustment analyses. Replicated gene expression measurements were averaged prior to downstream analysis.
Expression and prognosis of TMED3 in colon cancer
TMED3 expression profiles and corresponding clinicopathological data for colon adenocarcinoma were obtained from the TCGA database. Differential TMED3 expression between colon cancer tissues and unmatched normal tissues was evaluated using Wilcoxon rank-sum tests, while associations between TMED3 expression and clinicopathological characteristics were analyzed using chi-square tests. Patients were stratified into high- and low-expression groups according to the median TMED3 expression level. Kaplan–Meier survival analysis was subsequently performed to compare prognostic differences between the two groups. Univariate and multivariate Cox proportional hazards regression analyses were conducted to assess the prognostic significance of TMED3 expression in colon cancer. In addition, time-dependent receiver operating characteristic (ROC) curve analysis was carried out to evaluate the predictive performance of TMED3 expression for 1-, 3-, and 5-year OS. ROC analyses were performed using the timeROC package in the statistical analysis software, and graphical visualization was generated using the ggplot2 package.
Immunohistochemistry analysis
A total of 60 colon cancer tissue samples and 20 non-cancer tissues were randomly selected from Tangshan Central Hospital. The study was approved by the local institutional review board (No. TZYL/K/2023-16), and written informed consent was obtained from all patients before surgery. All tissue samples were obtained from patients who underwent surgical resection without prior chemotherapy or immunotherapy. The cohort included 39 male and 21 female patients aged 20–87 years. According to Duke’s staging criteria, 33 patients were classified as stage I+II and 27 patients were classified as stage III+IV. The stage distribution of the cohort may introduce potential selection bias toward advanced disease stages; therefore, survival-related findings should be interpreted cautiously.
Paraffin-embedded tissue specimens were sectioned into 4 µm slices, followed by deparaffinization and rehydration. Endogenous peroxidase activity was quenched using 4% H2O2, and nonspecific binding was subsequently blocked with goat serum. Sections were then incubated overnight at 4°C with TMED3 primary antibody at a dilution of 1:100. On the following day, sheep anti-rabbit IgG polymer (PV-6000) was applied for 30 min at room temperature. Immunoreactivity was visualized using diaminobenzidine staining, and sections were mounted with neutral resin. Histological staining was examined under a high-magnification optical microscope. Immunostaining intensity was scored as 0 (negative), 1 (weak), 2 (moderate) and 3 (strong) whereas the proportion of positive tumor cells was graded as 1 (1%–25%), 2 (26%–50%), 3 (51%–75%), or 4 (76%–100%). Final immunohistochemical scores were calculated by multiplying staining intensity by the percentage score of positive tumor cells. TMED3 expression levels were classified as negative/low expression (score ≤ 6) or overexpression (score > 6)19.
Gene enrichment analysis of TMED3 in colon cancer
Gene enrichment analysis was performed to evaluate the potential biological functions and signaling pathways associated with TMED3 expression in colon cancer. Differentially expressed genes between high- and low-TMED3-expression groups were screened using the DESeq2 package in the statistical analysis software. Raw count data obtained from TCGA were normalized using the median ratio normalization method implemented in DESeq2. Low-expression genes with counts <10 in over 50% of samples were excluded prior to analysis. Differentially expressed genes were identified using thresholds of |log2 (FC)| ≥ 1 and adjusted P < 0.05 after Benjamini–Hochberg (BH) multiple-testing correction. All analytical parameters were fixed to ensure reproducibility of the analysis.
Subsequently, Gene Set Enrichment Analysis (GSEA) was performed using the clusterProfiler package in R based on the Kyoto Encyclopedia of Genes and Genomes (KEGG) gene sets (version 7.5.1) obtained from the Molecular Signatures Database (MSigDB). A pre-ranked gene list was generated according to the log2 fold-change values between high- and low-TMED3-expression groups. Enrichment analysis was conducted using 1000 phenotype permutations, and gene sets containing 15–500 genes were included in the analysis. Pathways with normalized enrichment score (NES) absolute values of >1, adjusted P < 0.05, and false discovery rate (FDR) < 0.25 were considered significantly enriched. The enrichment of the Parkinson disease pathway was retained because this pathway is closely associated with mitochondrial dysfunction and oxidative phosphorylation-related biological processes, which are also involved in tumor metabolic reprogramming and cancer progression.
Statistical analysis
All statistical analyses were conducted using the statistical analysis software. Differential expression between groups was assessed using two-sided Wilcoxon rank-sum tests for unpaired samples and Wilcoxon signed-rank tests for paired samples. Associations between TMED3 expression and clinicopathological variables were evaluated using chi-square tests. Survival analyses were performed using the survival package (version 3.3-1), and Kaplan–Meier survival curves were generated with the survminer package. Differences in survival outcomes between groups were compared using the log-rank test. Cox proportional hazards regression models were applied to identify prognostic factors associated with OS. Patients were categorized into high- and low-expression groups according to the median TMED3 expression level. Time-dependent ROC analyses were performed using the timeROC package, and figures were generated using the ggplot2 package. Unless otherwise stated, statistical significance was defined as a two-sided P value of < 0.05.
Spearman correlation analysis was performed to evaluate the correlations between TMED3 expression and immune characteristics, TMB, and MSI. Normalized quantitative expression data obtained from the corresponding public databases were used for all correlation analyses. For TCGA RNA sequencing data, TPM-formatted expression values were transformed using log2(TPM + 1) normalization prior to analysis where applicable. Samples with missing clinical or molecular data were excluded before statistical analysis. Spearman correlation analyses were conducted as two-tailed non-parametric tests. Raw P values were used for analyses involving limited comparisons, including Wilcoxon tests, Spearman correlation analyses, and survival analyses. For large-scale high-throughput bioinformatics analyses, including differential gene expression analysis, KEGG enrichment analysis, and GSEA, multiple-testing correction was performed using the BH FDR method. Adjusted FDR values of <0.05 were considered statistically significant.
Results
Expression analysis of TMED3 in pan-cancer
Analysis of TCGA and GTEx datasets demonstrated that TMED3 messenger ribonucleic acid (mRNA) expression was significantly elevated in most tumor tissues compared with corresponding normal tissues, including adrenocortical carcinoma (ACC), bladder urothelial carcinoma (BLCA), breast invasive carcinoma (BRCA), cervical squamous cell carcinoma and endocervical adenocarcinoma (CESC), cholangiocarcinoma (CHOL), colon adenocarcinoma (COAD), diffuse large B-cell lymphoma (DLBC), esophageal carcinoma (ESCA), glioblastoma multiforme (GBM), kidney renal clear cell carcinoma (KIRC), kidney renal papillary cell carcinoma (KIRP), brain lower grade glioma (LGG), liver hepatocellular carcinoma (LIHC), lung adenocarcinoma (LUAD), lung squamous cell carcinoma (LUSC), ovarian serous cystadenocarcinoma (OV), pancreatic adenocarcinoma (PAAD), pheochromocytoma and paraganglioma (PCPG), prostate adenocarcinoma (PRAD), rectum adenocarcinoma (READ), skin cutaneous melanoma (SKCM), stomach adenocarcinoma (STAD), testicular germ cell tumors (TGCT), thyroid carcinoma (THCA), thymoma (THYM), uterine corpus endometrial carcinoma (UCEC), and uterine carcinosarcoma (UCS), whereas reduced expression was observed in head and neck squamous cell carcinoma (HNSC) and acute myeloid leukemia (LAML) (Figure 1A). Matched adjacent normal tissues served as controls for paired expression analyses. Paired TCGA analysis further confirmed significantly increased TMED3 expression in BLCA, BRCA, CHOL, COAD, kidney chromophobe (KICH), KIRP, KIRC, LIHC, LUAD, LUSC, PRAD, STAD, and UCEC tissues compared with paired normal tissues (Figure 1B). In addition, protein expression analysis using the UALCAN/Clinical Proteomic Tumor Analysis Consortium (CPTAC) database demonstrated increased TMED3 protein levels in BRCA, COAD, GBM, KIRC, LIHC, LUAD, LUSC, OV, and UCEC tumor tissues, whereas reduced protein expression was observed in PAAD compared with normal tissues (Figure 1C). However, TMED3 protein expression was lower in PAAD than normal tissues. This discrepancy between mRNA and protein expression patterns may reflect post-transcriptional or post-translational regulatory mechanisms. These findings suggest that TMED3 is aberrantly upregulated in multiple cancers and may be associated with diagnostic and prognostic characteristics across multiple cancers.
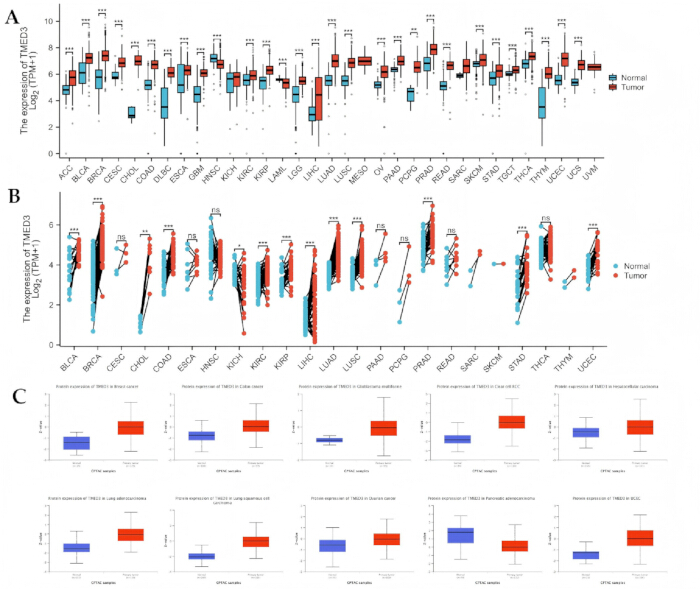
Figure 1. TMED3 expression profiles across human cancers. (A) Differential TMED3 mRNA expression between tumor and normal tissues across multiple cancer types based on TCGA and GTEx datasets. Expression levels are presented as log2(TPM + 1). (B) Paired analysis of TMED3 mRNA expression between tumor tissues and matched adjacent normal tissues from TCGA datasets. (C) Differential TMED3 protein expression between normal tissues and primary tumors in CPTAC/UALCAN datasets, including breast invasive carcinoma (BRCA), colon adenocarcinoma (COAD), glioblastoma multiforme (GBM), kidney renal clear cell carcinoma (KIRC), liver hepatocellular carcinoma (LIHC), lung adenocarcinoma (LUAD), lung squamous cell carcinoma (LUSC), ovarian serous cystadenocarcinoma (OV), pancreatic adenocarcinoma (PAAD), and uterine corpus endometrial carcinoma (UCEC). Data are presented as box plots. Statistical significance was analyzed using Wilcoxon rank-sum or Wilcoxon signed-rank tests, as appropriate. *P < 0.05, **P < 0.01, ***P < 0.001; ns, not significant. Please click here to view a larger version of this figure.
Clinicopathological feature analysis
Clinical stage analysis demonstrated that TMED3 expression was significantly higher in advanced-stage tumors (Stage III–IV) compared with early-stage tumors (Stage I–II) in ACC, KIRC, KIRP, and LUAD (Figure 2). In contrast, TMED3 expression was significantly reduced in advanced-stage UCEC tissues. These findings suggest that elevated TMED3 expression may be associated with tumor progression in several cancer types.
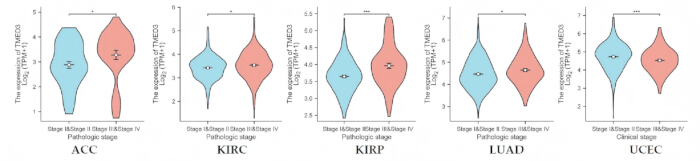
Figure 2. Association between TMED3 expression and pathological stage across multiple cancers. Violin plots showing TMED3 mRNA expression levels in early-stage tumors (Stage I–II) and advanced-stage tumors (Stage III–IV) in adrenocortical carcinoma (ACC), kidney renal clear cell carcinoma (KIRC), kidney renal papillary cell carcinoma (KIRP), lung adenocarcinoma (LUAD), and uterine corpus endometrial carcinoma (UCEC). Expression levels are presented as log2(TPM + 1). Statistical significance was evaluated using Wilcoxon rank-sum tests. *P < 0.05, ***P < 0.001. Please click here to view a larger version of this figure.
Prognostic analysis
Cox regression and survival analyses demonstrated that high TMED3 expression was associated with poorer OS in ACC, COAD, LUAD, and UVM (Figure 3A). DSS analysis further revealed that elevated TMED3 expression was significantly associated with unfavorable DSS in ACC, COAD, GBM, KIRP, and UVM (Figure 3B). Notably, ACC, COAD, and UVM consistently showed poor prognosis for both OS and DSS in patients with high TMED3 expression. Trend-level prognostic associations were also observed in selected tumor types, including LUAD, KIRC, and LGG. These findings suggest that TMED3 expression may have prognostic relevance in multiple malignancies.
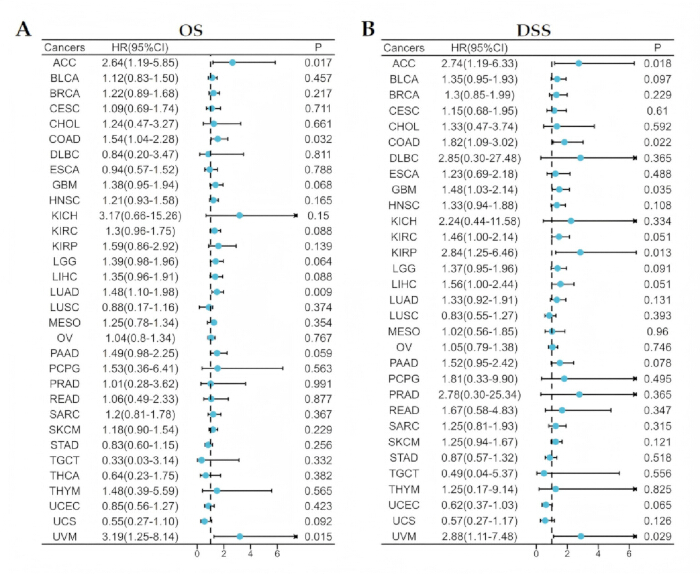
Figure 3. Prognostic significance of TMED3 expression in pan-cancer analysis. (A) Forest plot showing the association between TMED3 expression and overall survival (OS) across multiple cancer types. (B) Forest plot showing the association between TMED3 expression and disease-specific survival (DSS) across multiple cancer types. Hazard ratios (HRs) and 95% confidence intervals (95% CIs) were calculated using Cox proportional hazards regression analysis. HR > 1 indicates poor prognosis associated with high TMED3 expression. Please click here to view a larger version of this figure.
Mutation analysis
Genetic alteration analysis using the cBioPortal database demonstrated that TMED3 alterations across cancers mainly consisted of mutations, amplifications, deep deletions, and multiple alterations (Figure 4). The highest frequency of TMED3 alterations was observed in mesothelioma (MESO), primarily driven by gene amplification (2.3%). ESCA showed mixed alteration types, including mutation (0.55%), amplification (1.1%), and deep deletion (0.55%). In contrast, no detectable TMED3 genetic alterations were identified in LIHC, KICH, THCA, PCPG, CHOL, UVM, LAML, UCS, DLBC, KIRC, TGCT, and GBM datasets. These findings indicate that TMED3 genomic alterations occur in a tumor-specific manner and may contribute to cancer heterogeneity.
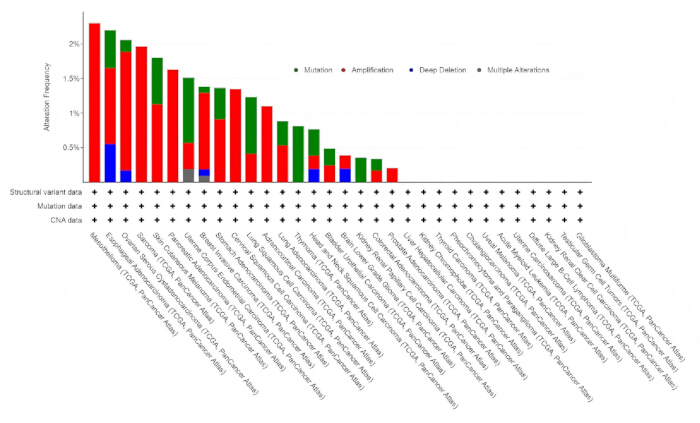
Figure 4. Genetic alteration landscape of TMED3 across cancers. Frequency and types of TMED3 genetic alterations across pan-cancer datasets obtained from the cBioPortal database. Alteration categories included mutation, amplification, deep deletion, and multiple alterations. The y-axis indicates alteration frequency (%) across cancer types. Please click here to view a larger version of this figure.
DNA methylation analysis
Analysis of the UALCAN database demonstrated that TMED3 promoter methylation levels were significantly increased in BRCA, COAD, ESCA, HNSC, KIRC, KIRP, LIHC, LUAD, PAAD, and PRAD tumor tissues compared with corresponding normal tissues (Figure 5). In contrast, reduced TMED3 promoter methylation levels were observed in BLCA, TGCT, and UCEC tissues relative to normal controls. These findings suggest that aberrant methylation of the TMED3 promoter may contribute to tumor-specific regulation of TMED3 expression.
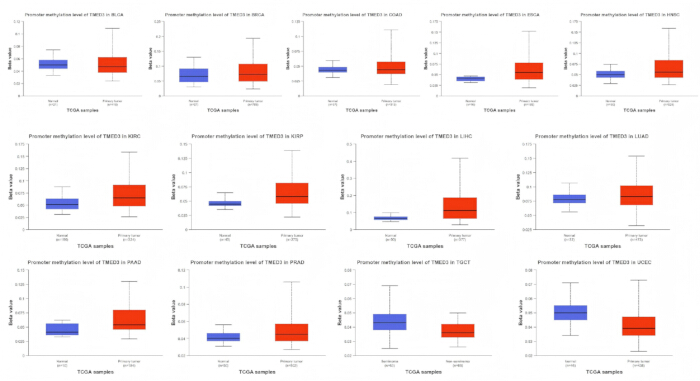
Figure 5. Promoter methylation levels of TMED3 across cancers. Comparison of TMED3 promoter methylation levels between tumor tissues and corresponding normal tissues in bladder urothelial carcinoma (BLCA), breast invasive carcinoma (BRCA), colon adenocarcinoma (COAD), esophageal carcinoma (ESCA), head and neck squamous cell carcinoma (HNSC), kidney renal clear cell carcinoma (KIRC), kidney renal papillary cell carcinoma (KIRP), liver hepatocellular carcinoma (LIHC), lung adenocarcinoma (LUAD), pancreatic adenocarcinoma (PAAD), prostate adenocarcinoma (PRAD), testicular germ cell tumors (TGCT), and uterine corpus endometrial carcinoma (UCEC) datasets obtained from UALCAN. Data are presented as β values in box plots. Please click here to view a larger version of this figure.
Analysis of TMED3, TMB, and MSI correlations
Spearman correlation analysis demonstrated that TMED3 expression was positively correlated with TMB in ACC, ESCA, KIRC, LGG, PAAD, STAD, THYM, and UCEC, whereas negative correlations were observed in CESC, LUAD, and TGCT (Figure 6A). In addition, TMED3 expression was positively associated with MSI in DLBC, KIRC, SKCM, STAD, and UCEC (Figure 6B). Notably, TMED3 expression showed positive correlations with both TMB and MSI in KIRC, STAD, and UCEC, which may indicate potential associations with tumor immunogenicity in these cancers.
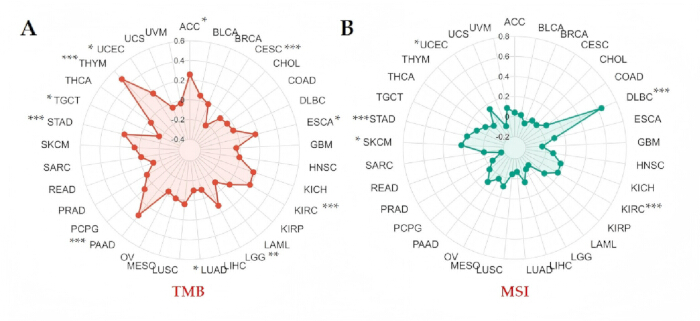
Figure 6. Correlation of TMED3 expression with tumor mutational burden and microsatellite instability in pan-cancer analysis. (A) Radar plot showing the correlation between TMED3 expression and tumor mutational burden (TMB) across cancers. (B) Radar plot showing the correlation between TMED3 expression and microsatellite instability (MSI) across cancers. Correlation coefficients were calculated using Spearman correlation analysis. *P < 0.05, **P < 0.01, ***P < 0.001. Please click here to view a larger version of this figure.
Immune characteristic analysis
ESTIMATE analysis demonstrated that TMED3 expression was negatively correlated with stromal score, immune score, and ESTIMATE score in BCLA, ESCA, LAML, LUAD, LUSC, PAAD, PRAD, SKCM, STAD, THCA, and UCEC (Figure 7A). In contrast, positive correlations between TMED3 expression and these immune-related scores were observed in LGG, LIHC, and PCPG. No significant correlations were identified in ACC, CHOL, DLBC, GBM, KICH, KIRC, KIRP, OV, and UCS. These findings suggest that TMED3 may influence the tumor microenvironment and immune cell infiltration in a cancer type-dependent manner. Immune checkpoint correlation analysis further demonstrated that TMED3 expression was negatively associated with the immune checkpoint-related genes CD274 (PD-L1), PDCD1 (PD-1), and CTLA4 in BLCA, BRCA, CESC, ESCA, HNSC, LUAD, LUSC, PRAD, SKCM, and THCA (Figure 7B). Positive correlations between TMED3 expression and immune checkpoint genes were identified in LIHC and UVM, whereas no significant associations were observed in GBM, KICH, LAML, MESO, OV, PCPG, READ, and TGCT. These results indicate that TMED3 may be associated with tumor immune regulation and immune checkpoint signaling in selected cancers.
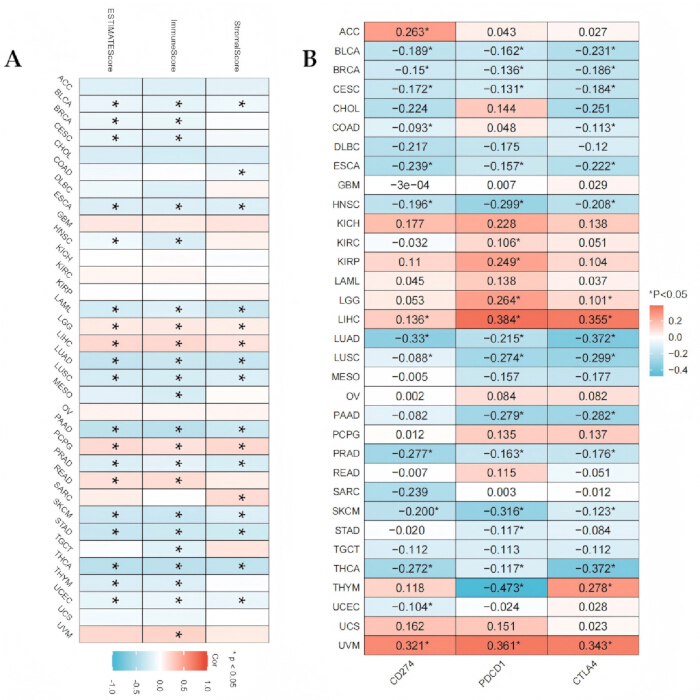
Figure 7. Associations between TMED3 expression and tumor immune characteristics. (A) Heatmap showing correlations between TMED3 expression and stromal score, immune score, and ESTIMATE score across cancers calculated using the ESTIMATE algorithm. (B) Heatmap showing correlations between TMED3 expression and immune checkpoint-related genes, including CD274 (PD-L1), PDCD1 (PD-1), and CTLA4. Correlation coefficients were determined using Spearman correlation analysis. Color scale indicates correlation strength. *P < 0.05. Please click here to view a larger version of this figure.
Drug sensitivity analysis
Drug sensitivity analysis using the GSCALite platform based on GDSC datasets demonstrated that TMED3 expression was negatively correlated with the half-maximal inhibitory concentration (IC50) values of 17-AAG, lapatinib, PD-0325901, RDEA119, and trametinib (Figure 8). These findings suggest that tumors with elevated TMED3 expression may exhibit increased sensitivity to these anticancer agents, suggesting potential associations between TMED3 expression and therapeutic sensitivity.
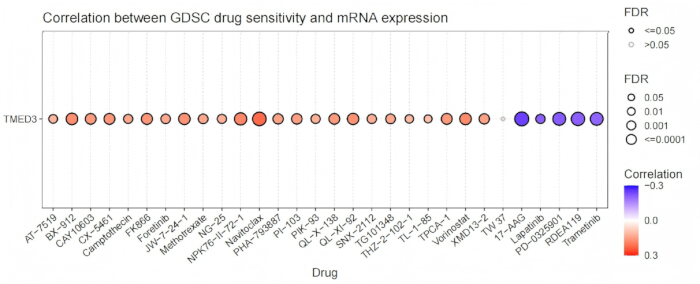
Figure 8. Correlation between TMED3 expression and anticancer drug sensitivity. Bubble plot showing correlations between TMED3 mRNA expression and sensitivity to anticancer drugs obtained from Genomics of Drug Sensitivity in Cancer (GDSC) datasets through the GSCALite platform. Bubble size represents statistical significance based on false discovery rate (FDR), and color indicates correlation coefficient values. Negative correlations indicate increased drug sensitivity associated with high TMED3 expression. Please click here to view a larger version of this figure.
Expression and prognosis of TMED3 in colon cancer
TMED3 expression analysis demonstrated significantly increased TMED3 mRNA levels in colon cancer tissues compared with normal colon tissues in TCGA datasets (Figure 9A). Paired analysis using matched adjacent normal tissues as controls further confirmed elevated TMED3 expression in colon cancer tissues (Figure 9B). Consistent with the transcriptomic findings, protein expression analysis using UALCAN/CPTAC datasets and immunohistochemical staining demonstrated increased TMED3 protein expression in colon cancer tissues compared with normal colon tissues (Figure 9C–9E). ROC curve analysis showed an area under the curve (AUC) value of 0.869, indicating favorable diagnostic performance of TMED3 for distinguishing colon cancer tissues from normal tissues (Figure 9F). Clinicopathological analysis further demonstrated that TMED3 expression was significantly associated with T stage, whereas no significant associations were observed with age, gender, N stage, or TNM stage (Table 1). These findings support the potential diagnostic significance of TMED3 in colon cancer.
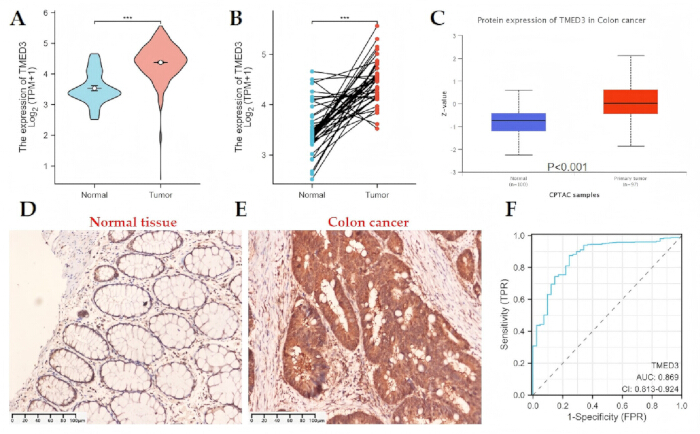
Figure 9. Expression, diagnostic value, and immunohistochemical validation of TMED3 in colon cancer. (A) Differential TMED3 mRNA expression between colon cancer tissues and normal colon tissues from TCGA datasets. (B) Paired analysis of TMED3 mRNA expression in colon cancer tissues and matched adjacent normal tissues. (C) TMED3 protein expression in colon cancer and normal tissues obtained from CPTAC/UALCAN datasets. (D) Representative immunohistochemical staining of TMED3 in normal colon tissue. (E) Representative immunohistochemical staining of TMED3 in colon cancer tissue showing increased TMED3 expression. (F) Receiver operating characteristic (ROC) curve evaluating the diagnostic value of TMED3 in colon cancer. Scale bars = 100 µm. The area under the curve (AUC) was 0.869 with a 95% confidence interval (CI) of 0.813–0.924. Statistical significance was analyzed using Wilcoxon rank-sum or Wilcoxon signed-rank tests, as appropriate. ***P < 0.001. Please click here to view a larger version of this figure.
| Type | TMED3 | P value | χ2 | ||
| Low expression | High expression | ||||
| Age | |||||
| ≤ 55 | 25 | 15 | 10 | 0.13 | 2.34 |
| > 55 | 35 | 14 | 21 | ||
| Gender | |||||
| Female | 21 | 10 | 11 | 0.94 | 0.007 |
| Male | 39 | 19 | 20 | ||
| T stage | |||||
| T1+T2 | 23 | 15 | 8 | 0.04 | 4.26 |
| T3+T4 | 37 | 14 | 23 | ||
| N Stage | |||||
| N0 | 30 | 12 | 18 | 0.2 | 1.67 |
| N1+N2 | 30 | 17 | 13 | ||
| TNM Stage | |||||
| I+II | 33 | 13 | 20 | 0.13 | 2.35 |
| III+IV | 27 | 16 | 11 | ||
Table 1: Association between TMED3 expression and clinicopathological characteristics in colon cancer. Clinicopathological characteristics of patients with colon cancer were compared between low- and high-TMED3-expression groups. Associations between TMED3 expression and clinicopathological variables, including age, sex, T stage, N stage, and TNM stage, were analyzed using chi-square (χ2) tests. Data are presented as the number of patients in each subgroup. Statistical significance was defined as P < 0.05.
KM survival analysis demonstrated that patients with high TMED3 expression exhibited significantly poorer OS (P = 0.031) and DSS (P = 0.020) compared with patients with low TMED3 expression (Figure 10A and 10B). Time-dependent ROC analysis demonstrated that the predictive performance of TMED3 expression for OS yielded AUC values of 0.620, 0.564, and 0.575 at 1, 3, and 5 years, respectively (Figure 10C). Furthermore, univariate and multivariate Cox regression analyses identified T stage, M stage, pathologic stage, and TMED3 expression as prognostic factors associated with overall survival in colon cancer (Table 2). These results suggest that elevated TMED3 expression is associated with poor prognosis in colon cancer, although the time-dependent ROC analysis demonstrated only modest predictive performance.
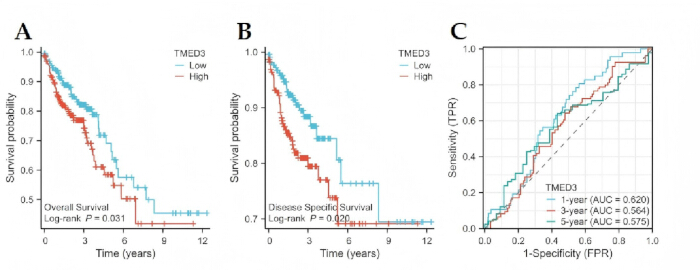
Figure 10. Prognostic significance of TMED3 expression in colon cancer. (A) Kaplan–Meier (KM) overall survival (OS) curves comparing patients with high and low TMED3 expression in colon cancer. (B) Kaplan–Meier disease-specific survival (DSS) curves comparing patients with high and low TMED3 expression. (C) Time-dependent receiver operating characteristic (ROC) curves evaluating the predictive performance of TMED3 expression for 1-, 3-, and 5-year OS. Survival differences were analyzed using the log-rank test. Please click here to view a larger version of this figure.
| Characteristics | Univariate analysis | Multivariate analysis | ||
| Hazard ratio (95% CI) | P value | Hazard ratio (95% CI) | P value | |
| Gender | 1.101(0.746–1.625) | 0.627 | ||
| T stage | 3.072(1.423–6.631) | 0.004 | 3.817(1.174–12.407) | 0.026 |
| N stage | 2.592(1.743–3.855) | <0.001 | 0.587(0.223–1.584) | 0.28 |
| M stage | 4.193(2.683–6.554) | <0.001 | 2.272(1.314–3.930) | 0.003 |
| Pathologic stage | 2.947(1.942–4.471) | <0.001 | 3.115(1.032–9.401) | 0.044 |
| TMED3 | 1.537(1.037–2.277) | 0.032 | 1.599(1.039–2.462) | 0.033 |
Table 2: Univariate and multivariate Cox proportional hazards regression analyses of prognostic factors associated with overall survival in colon cancer. Univariate and multivariate Cox proportional hazards regression analyses were performed to evaluate the prognostic significance of clinicopathological characteristics and TMED3 expression in patients with colon cancer. Hazard ratios (HRs) are presented with 95% confidence intervals (95% CIs). Variables included sex, T stage, N stage, M stage, pathological stage, and TMED3 expression. Statistical significance was defined as P < 0.05.
Drug sensitivity analysis demonstrated that patients in the high TMED3 expression group exhibited lower estimated IC50 values for 5-fluorouracil, lapatinib, and trametinib compared with the low TMED3 expression group (Figure 11). These findings suggest that colon cancer patients with elevated TMED3 expression may show increased sensitivity to these chemotherapeutic and targeted therapeutic agents, suggesting potential associations between TMED3 expression and therapeutic response.
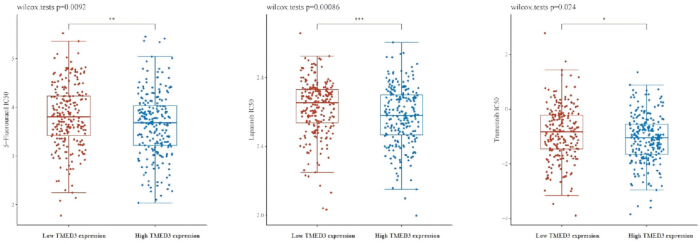
Figure 11. Correlation between TMED3 expression and chemotherapeutic drug sensitivity in colon cancer. Box plots showing estimated half-maximal inhibitory concentration (IC50) values for 5-fluorouracil, lapatinib, and trametinib between low TMED3 expression (G1) and high TMED3 expression (G2) groups. Lower IC50 values indicate greater drug sensitivity. Statistical significance was analyzed using Wilcoxon rank-sum tests. *P < 0.05, **P < 0.01, ***P < 0.001. Please click here to view a larger version of this figure.
Gene enrichment analysis
GSEA using KEGG datasets from the MSigDB database demonstrated that TMED3-related genes in colon cancer were significantly enriched in pathways associated with ribosome, Antigen Processing and Presentation, oxidative phosphorylation, and Pentose Phosphate Pathway (Figure 12). These findings suggest that TMED3 may participate in tumor progression through above pathways in colon cancer.
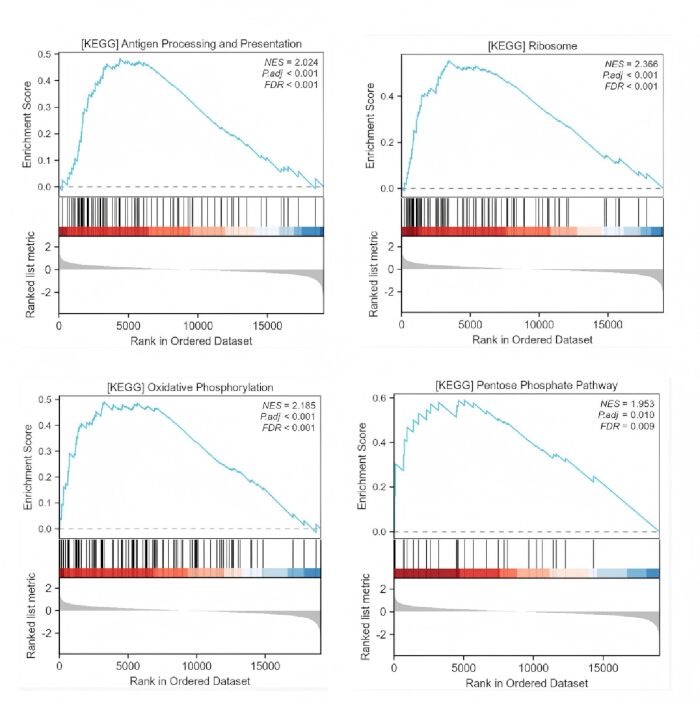
Figure 12. Gene set enrichment analysis (GSEA) of TMED3-related genes in colon cancer. GSEA plots showing enrichment of TMED3-related genes in pathways associated with antigen processing and presentation, ribosome, oxidative phosphorylation, and pentose phosphate pathway in colon cancer. Normalized enrichment score (NES), nominal P value, and false discovery rate (FDR) values are indicated in each panel. Please click here to view a larger version of this figure.
This study demonstrated that TMED3 was aberrantly expressed across multiple cancers and was associated with tumor progression, prognosis, immune characteristics, TMB, MSI, and drug sensitivity. In colon cancer, TMED3 overexpression was associated with unfavorable survival outcomes and increased diagnostic value. Functional enrichment analysis further suggested that TMED3 may participate in cancer-related metabolic and signaling pathways. Collectively, these findings support further investigation of TMED3 as a potential diagnostic and prognostic biomarker in pan-cancer, particularly in colon cancer.
Data Availability:
The datasets analyzed in this study were obtained from publicly available databases, including The Cancer Genome Atlas (TCGA; https://portal.gdc.cancer.gov/projects/; accessed July 1, 2025), UALCAN (http://ualcan.path.uab.edu/; accessed July 1, 2025), cBioPortal (https://www.cbioportal.org/; accessed July 5, 2025), and the Genomics of Drug Sensitivity in Cancer (GDSC) platform through GSCA (https://guolab.wchscu.cn/GSCA/#/drug; accessed July 5, 2025). All processed data generated during this study are included within the article.
Discussion
TMED proteins are highly conserved proteins containing the emp24 domain that exist as monomers or dimers within eukaryotic cells20. Members of the TMED family are type I transmembrane proteins that participate in vesicle-mediated protein trafficking and intracellular transport20. The p24 protein family comprises 10 TMED members, including TMED3. Increasing evidence has shown that TMED3 is abnormally expressed in several malignancies, such as endometrial carcinoma, osteosarcoma, clear cell carcinoma, hepatocellular carcinoma, prostate cancer, and breast cancer4,6,21,22,23. Elevated TMED3 expression has also been linked to unfavorable prognosis in multiple tumor types3,5,17,18,19. In lung squamous cell carcinoma, TMED3 was shown to facilitate tumor progression through regulation of ezrin, while TMED3 silencing suppressed cell proliferation, colony formation, migration, and apoptosis-related protein dysregulation5. Collectively, these studies indicate that TMED3 is closely involved in cancer development and progression; however, its biological functions and molecular mechanisms in pan-cancer remain to be fully elucidated.
In the present study, multiple public databases were integrated to comprehensively evaluate the expression patterns, prognostic significance, immune characteristics, and potential biological functions of TMED3 across cancers. TMED3 expression was markedly increased in 26 tumor types, and these findings were further confirmed using paired tumor and adjacent normal tissue analyses in several cancers. Consistently, CPTAC data revealed elevated TMED3 protein expression in BRCA, COAD, GBM, KIRC, LIHC, LUAD, LUSC, OV, and UCEC. Interestingly, although TMED3 mRNA expression was elevated in PAAD tissues, reduced protein expression was observed in the UALCAN database, suggesting that post-transcriptional regulation, protein degradation, or post-translational modifications may contribute to this discrepancy. Previous studies demonstrated that TMED3 overexpression in breast cancer cells promotes the accumulation of β-catenin and Axin-2 in both the cytoplasm and nucleus of MCF-7 cells and enhances the expression of Wnt/β-catenin downstream targets, including c-myc, MMP7, and TCF4, thereby facilitating tumor cell proliferation, migration, and invasion24. Similarly, TMED3 has been reported to be upregulated in non-small cell lung cancer, and silencing of TMED3 suppresses tumor cell proliferation and invasive ability25. In the current study, clinicopathological analyses showed that TMED3 expression was elevated in advanced-stage ACC, KIRC, KIRP, and LUAD, whereas lower expression was observed in advanced-stage UCEC, indicating possible tumor-specific biological roles of TMED3 during cancer progression. Survival analyses further demonstrated significant associations between high TMED3 expression and unfavorable OS and DSS in ACC, COAD, and UVM, supporting the potential prognostic value of TMED3 in multiple malignancies. In addition, promoter methylation analysis revealed increased TMED3 methylation levels in BRCA, COAD, ESCA, HNSC, KIRC, KIRP, LIHC, LUAD, PAAD, and PRAD, while decreased methylation levels were identified in BLCA, TGCT, and UCEC. These findings indicate that aberrant promoter methylation may contribute to the dysregulation of TMED3 expression in a tumor-dependent manner and may participate in cancer development.
MSI represents a distinct molecular subtype of cancer that is frequently associated with improved responsiveness to immunotherapy because these tumors commonly display elevated mutational burden and increased PD-L1 expression26,27. Tumors with high TMB can generate numerous neoantigens derived from somatic mutations, thereby enhancing T-cell-mediated antitumor immune activity and potentially increasing sensitivity to immune checkpoint blockade28,29. In the present study, TMED3 expression showed positive correlations with both TMB and MSI in KIRC, STAD, and UCEC, indicating that TMED3 may be linked to tumor immunogenicity and immunotherapeutic responsiveness in these cancer types. Increasing evidence has demonstrated that the tumor microenvironment, particularly immune and stromal components, plays a critical role in cancer progression, therapeutic response, recurrence, and patient prognosis. The ESTIMATE algorithm calculates stromal, immune, and ESTIMATE scores according to immune-related gene expression patterns, and previous investigations have reported significant relationships between these scores and clinical outcomes in prostate cancer, glioblastoma, and colon cancer30,31,32. Our analyses demonstrated that TMED3 expression was variably associated with stromal score, immune score, and ESTIMATE score across different tumor types, suggesting that TMED3 may contribute to tumor progression through modulation of the tumor microenvironment. Moreover, TMED3 expression was correlated with multiple immune checkpoint-related genes, including CD274 (PD-L1), PDCD1 (PD-1), and CTLA4, although the direction and magnitude of these associations differed among tumor types. Significant positive correlations between TMED3 and immune checkpoint markers were identified in ACC, KIRP, LGG, LIHC, THYM, and UVM, suggesting that tumors with elevated TMED3 expression in these cancers may exhibit enhanced sensitivity to immunotherapy. Drug sensitivity analyses additionally revealed associations between TMED3 expression and responsiveness to 17-AAG, lapatinib, PD-0325901, RDEA119, and trametinib, indicating a potential relationship between TMED3 expression and therapeutic efficacy.
Colon cancer was selected for immunohistochemical validation, and the results confirmed that TMED3 expression was markedly elevated in colon cancer tissues compared with normal colon tissues, consistent with previous findings7. Clinicopathological analyses further revealed a significant association between TMED3 expression and T stage in colon cancer. In addition, TMED3 demonstrated potential diagnostic value, while increased TMED3 expression was associated with poorer patient prognosis. However, time-dependent ROC analyses showed that the AUC values for predicting 1-, 3-, and 5-year OS were only marginally above 0.5, indicating limited predictive accuracy despite statistical significance. These findings suggest that TMED3 currently has greater value as an exploratory prognostic biomarker rather than as a robust predictor for routine clinical application. Univariate and multivariate Cox regression analyses further identified T stage, M stage, pathological stage, and TMED3 expression as independent prognostic factors associated with OS in colon cancer. Drug sensitivity analyses indicated that patients with elevated TMED3 expression may be more responsive to commonly used therapeutic agents, including 5-fluorouracil, lapatinib, and trametinib. Moreover, functional enrichment analyses revealed that TMED3-related genes in colon cancer were primarily enriched in pathways associated with ribosome, antigen processing and presentation, oxidative phosphorylation, and the pentose phosphate pathway.
This study systematically evaluated the expression profiles, prognostic value, and immune-related characteristics of TMED3 across multiple cancer types. Nevertheless, several limitations should be considered. Most findings were derived from bioinformatics and multiomics analyses based on public datasets, and experimental validation was limited to immunohistochemical analysis in colon cancer tissues. Furthermore, functional experiments were not performed to investigate the precise molecular mechanisms underlying the role of TMED3 in tumor progression. Therefore, additional in vitro and in vivo studies are required to further clarify the biological functions and potential therapeutic significance of TMED3 in different malignancies.
Disclosures
Conflict of Interests:
The authors declare no competing interests.
Acknowledgements
This work was supported by the Medical Science Research Project of Hebei Province (No. 20231832). The authors sincerely acknowledge the contributions of the TCGA, GTEx, UALCAN, and cBioPortal databases.
Materials
| Name | Company | Catalog Number | Comments |
|---|---|---|---|
| 0.5% Ammonia Solution | Tianjin Fuyu Fine Chemical Co., Ltd | CAS:1336-21-6 | N/A |
| 1% Acid Alcohol | Ningbo Chiwell Biotechnology Co., Ltd | CWGQ-HE-1001 | N/A |
| 10% Neutral Buffered Formalin | Wuhan Huntz Biotechnology Co., Ltd | H-H8060 | N/A |
| 100% Ethanol | Tianjin Fuyu Fine Chemical Co., Ltd | CAS:64-17-5 | N/A |
| 70% Ethanol | Tianjin Fuyu Fine Chemical Co., Ltd | CAS:64-17-5 | N/A |
| 80% Ethanol | Tianjin Fuyu Fine Chemical Co., Ltd | CAS:64-17-5 | N/A |
| 95% Ethanol | Shandong Lirun Medical Technology Co., Ltd | CAS:64-17-5 | N/A |
| Alcian Blue Stain | Baso Diagnostics Inc., Zhuhai | BA4121 | N/A |
| cBioPortal | Memorial Sloan Kettering Cancer Center | N/A | SCR_014555 |
| Citrate-Based Antigen Retrieval Buffer | Leica Biosystems Newcastle Ltd | AR9640-CN | N/A |
| clusterProfiler package | Bioconductor | N/A | SCR_016884 |
| DESeq2 package | Bioconductor | N/A | SCR_015687 |
| Diaminobenzidine Tetrahydrochloride Hydrate | Leica Biosystems Newcastle Ltd | DS9800-CN | N/A |
| ESTIMATE package | R package | Version 1.0.13 | N/A |
| GSCALite platform | GSCALite | N/A | N/A |
| GTEx database | GTEx Consortium | N/A | SCR_013042 |
| Hematoxylin | Ningbo Chiwell Biotechnology Co., Ltd | CWGQ-HE-1001 | N/A |
| Hydrogen Peroxide | OriGene Technologies, Inc | PV-6000D | N/A |
| Kaplan–Meier Survival Analysis | survival R package | Version 3.2-7 | SCR_021137 |
| KEGG Gene Sets | MSigDB | Version 7.5.1 | SCR_016863 |
| Light Microscope | Zeiss Technology (Suzhou) Co., Ltd | N/A | N/A |
| Paraffin Embedding Medium | PATHO-Reagent Department of YL Company | CAS:8002-74-2 | N/A |
| Polymer-Based Detection System | Leica Biosystems Newcastle Ltd | PV-6000 | N/A |
| R statistical analysis software | R Foundation for Statistical Computing | Version 4.2.1 | SCR_001905 |
| Secondary Rabbit Anti-Mouse IgG | Leica Biosystems Newcastle Ltd | DS9800-CN | N/A |
| TCGA database | National Cancer Institute | N/A | SCR_003193 |
| TMED3 Primary Antibody | CUSABIO Technology, Houston, USA | CSB-PA897107LA01HU | N/A |
| Tris-Buffered Saline (TBS) | Leica Biosystems Newcastle Ltd | AR9590-CN | N/A |
| UALCAN database | UALCAN | N/A | SCR_015827 |
| Wilcoxon Statistical Analysis | stats R package | N/A | SCR_003005 |
| Xylene | Tianjin Fuyu Fine Chemical Co., Ltd | CAS:1330-20-7 | N/A |