This study combines behavioral and imaging techniques for multimodal, longitudinal assessment of mice with osteoarthritis following electroacupuncture, including cartilage staining and Osteoarthritis Research Society International (OARSI) scoring.
Method Article
Multimodal Assessment of Electroacupuncture Treatment for Knee Osteoarthritis in Mice
* These authors contributed equally
In This Article
Summary
Abstract
Osteoarthritis is a chronic degenerative joint disease that commonly affects the knee and causes pain, swelling, stiffness, and functional limitation. Synovial inflammation and changes in periarticular muscles contribute to disease initiation and progression. Clinical evidence suggests that electroacupuncture may alleviate local inflammation and modulate cartilage metabolism. In this study, knee osteoarthritis was induced in mice by surgical destabilization of the medial meniscus. Outcomes were assessed using a multimodal protocol comprising the rotarod test, ultrasound, infrared thermography, magnetic resonance imaging, and histological staining. Joint cavity volume and skin temperature were monitored longitudinally, and endpoint magnetic resonance imaging and Safranin O-Fast Green staining were used to assess periarticular muscle signal changes and cartilage pathology. Electroacupuncture was associated with improved motor performance, reduced joint swelling, higher local skin temperature, less pronounced periarticular muscle signal changes on magnetic resonance images, and lower cartilage degeneration scores. These findings support the use of this multimodal protocol to assess electroacupuncture-associated outcomes in a preclinical mouse model.
Introduction
Knee osteoarthritis (KOA) is the most prevalent osteoarticular disease worldwide, affecting an estimated 250 million people1. Its pathological hallmarks include progressive cartilage degeneration and synovial proliferation, and clinically it presents with pain, swelling, and functional impairment2,3.
Osteoarthritis (OA) was long regarded as a noninflammatory joint disorder, but is now recognized to have an inflammatory component, with synovitis detectable in most patients. Pro-inflammatory cytokines such as interleukin (IL)-1β and IL-18, together with reactive oxygen species and biomechanical stress, are thought to contribute to the pathological process4. Inflammation is frequently accompanied by increased local blood flow, which manifests clinically as redness, warmth, and swelling5. Beyond accelerating cartilage degradation and functional decline, inflammation may be particularly active during the early stages of disease. Thus, monitoring inflammatory status over time could inform treatment strategies that target the underlying mechanism and allow for stage-adapted management6,7. Previous studies using ultrasound (US) scanning in mouse knees identified a triangular region between the tibial and femoral condyles. Histological analysis confirmed that this area contains soft tissues, including the synovium, meniscus, and fat pad, as well as synovial fluid-filled spaces. This ultrasound-detected region is defined as the interarticular volume, encompassing the aforementioned soft tissue areas8.
Furthermore, temperature is a key physical parameter that directly reflects the progression of joint inflammation. Elevated local temperature is one of the four cardinal signs of inflammation, and thermographic imaging enables precise detection and quantification of these thermal alterations9. A recent systematic review underscored the correlation between skin surface temperature and both inflammatory and degenerative joint diseases10, further substantiating the utility of infrared thermography (IRT) in arthritis research and clinical management11. Moreover, IRT provides an indirect measure associated with tissue perfusion and metabolic activity and may be useful for monitoring therapeutic responses.
In this study, we combined the rotarod test, US, IRT, and magnetic resonance imaging (MRI) to evaluate the effects of electroacupuncture (EA) in a mouse model of OA. This multimodal approach enabled simultaneous assessment of motor performance, joint morphology, thermal changes, and soft tissue inflammation, readouts that are not available from histology alone. Importantly, the panel provides complementary information across multiple biological levels with minimal additional cost or labor. As such, it is particularly well suited for preclinical studies that require repeated, noninvasive monitoring over time, especially when the intervention under investigation is expected to produce only modest effects or when the temporal profile of the response is uncertain. To the best of our knowledge, this is the first study to employ this particular combination of techniques, encompassing joint cavity volume, muscle inflammation, and local temperature, to track the therapeutic response to electroacupuncture in OA. The protocol we describe is practical and reproducible, and we believe it may serve as a useful reference for future longitudinal, real-time efficacy assessments in similar experimental settings.
Protocol
All experimental procedures were reviewed and approved by the Wuchuang Biotechnology (Shanghai) Co., Ltd. Laboratory Animal Ethics Committee (Ethics Approval Number: WTPZ20260209001). All animals used in this study were 8‑week‑old C57BL/6 mice weighing approximately 20 g, purchased from a commercial supplier (see the Table of Materials). The experiment included 24 mice. After acclimating for 1 week, the animals were allocated at random, with six mice assigned to each of four experimental conditions. These conditions comprised sham surgery, destabilization of the medial meniscus (DMM), sham acupuncture (SA), and electroacupuncture (EA). The number of animals used was determined without a prospective sample-size calculation; instead, the group size was selected by reference to previous electroacupuncture studies using comparable osteoarthritis models and endpoints and in accordance with the 3Rs principle.
1. Preoperative care and modeling
NOTE: An experienced surgical technician performed all modeling procedures. Return animals to their cages only after they regain consciousness on a heated pad.
- Acclimate mice to the experimental environment for at least 7 days before the experiment begins.
- Sterilize all surgical instruments prior to surgery. Thoroughly disinfect the surgical area.
- Turn on the gas anesthesia equipment. Place the mouse in the induction chamber and induce general anesthesia with 2–3% isoflurane for 5 min.
- After anesthesia induction is complete, transfer the mouse to the operating table. Maintain anesthesia by continuously delivering 1–1.5% isoflurane via an anesthesia mask until the surgical procedure is complete.
- Position the mouse in a supine position with the knee joint facing upward. Ensure the position is stable and the surgical site is fully exposed. Use DMM to create a model on the right hind limb12. For the Sham group, make an incision at the same location and then suture it closed.
- DMM surgical process
- Make a 1 cm longitudinal medial parapatellar incision to expose the knee joint.
- Through the medial parapatellar incision created in step 1.5.1.1, make a longitudinal opening in the joint capsule. Use forceps to separate the capsule sufficiently from the surrounding tissue. Then, support the distal hind paw in the left hand without applying excessive pressure and use the forceps to move the patella and patellar ligament laterally, thereby exposing the knee joint. Handle the paw carefully throughout this procedure to prevent injury.
NOTE: Adequate release of the joint capsule allows the patella to be displaced with minimal force. - Drip sterile saline onto the articular cartilage surface during the operation to prevent desiccation.
- Locate the medial meniscus in the space between the medial femoral condyle and medial tibial plateau. From its lateral aspect, trace the medial meniscotibial ligament to its attachment at the tibial intercondylar eminence. Stabilize the hind paw gently by hand and transect the ligament with a No. 10 surgical blade, taking care not to contact the cartilage underlying the medial meniscus.NOTE: Ensure that the articular cartilage and other ligaments are not injured. In many cases, the overlying fat pad needs to be retracted but not removed to identify the ligament.
- Approximate the edges of the knee joint capsule and secure them using 6-0 absorbable suture material.
- Close the skin with 6-0 silk suture12.
- DMM surgical process
- For postoperative care, instill one drop of 0.25% bupivacaine into the surgical site for local analgesia, and maintain the mice with ad libitum access to food and water.
NOTE: During anesthesia, maintain the oxygen flow rate within the range of 0.5–1 NL/min. Successful anesthesia was confirmed by the loss of the righting reflex, the absence of withdrawal responses to toe pinch, and stable, regular respiration. Throughout surgery, use sterile phosphate-buffered saline (PBS) as the irrigation solution to maintain cartilage hydration. The specific sizes and specifications of the absorbable suture for joint capsule closure and the silk suture for skin closure are detailed in the Table of Materials.
2. Electroacupuncture treatment
NOTE: Interventions in the SA and EA groups began 1 week after model establishment (Figure 1A). Both groups received treatment every other day, three times per week, for 15 min per session over 4 weeks. The Sham and DMM groups underwent the same anesthesia and immobilization procedures on the same schedule, without needling or electrical stimulation. All operators underwent training before the experiment to ensure consistency in acupoint selection, insertion angle, and depth.
- Place the mice in the induction chamber and remove them after anesthesia induction with isoflurane.
- Maintain mice in the supine position under continuous inhalation anesthesia with isoflurane (1.5–2.0% in 100% O₂) throughout the entire electroacupuncture session to ensure a quiet and stable state.
- Accurately locate the acupoints on the mice. Insert two disposable sterile needles (0.16 mm × 25 mm) into the ST36 (Zusanli) and SP10 (Xuehai) acupoints on the lower limbs to a skin depth of 5 mm13 (Figure 1B).
NOTE: ST36 is located 1 mm lateral to the anterior tubercle of the tibia, 3 mm below the head of the fibula, and directly below the knee joint. SP10 is located on the medial thigh, 3 mm above the superomedial margin of the patella at the medial prominence of the quadriceps muscle when the knee is flexed.- In the SA group, insert needles superficially, to a depth of approximately 1 mm, into adjacent non-acupoint areas rather than ST36 or SP10, and connect them to the EA device without current delivery14.
NOTE: Thus, the SA group differs from the EA group in needle placement, insertion depth, and the absence of electrical stimulation but is matched for all other procedural parameters. Compared with the DMM group, the SA group receives superficial non-acupoint needling and device connection without current, whereas the DMM group receives only anesthesia and immobilization.
- In the SA group, insert needles superficially, to a depth of approximately 1 mm, into adjacent non-acupoint areas rather than ST36 or SP10, and connect them to the EA device without current delivery14.
- Connect the needle to the electronic acupuncture device and apply stimulation at 2/100 Hz and 2 mA to produce gentle muscle tremors. Begin EA stimulation for 15 min, 3 times a week, starting 7 days after modeling, and continue for 4 weeks.
- After treatment, place the mouse on a heating pad and return it to its cage once it has regained consciousness.
3. Dynamic assessment of EA efficacy
NOTE: All assessments (rotarod test, US, IRT, MRI, and OARSI scoring) were performed by investigators blinded to group allocation, with group identities concealed until all data analyses were completed. Image acquisition and data analysis were handled by separate individuals, and histological evaluation was independently performed by two pathologists blinded to treatment groups. None of the assessors participated in animal assignment or electroacupuncture intervention.
- Rotarod fatigue test
- Pretrain mice to familiarize them with the experimental apparatus before formal testing.
- During the formal test, place each mouse individually on the rotarod, which accelerates at a rate of 4 revolutions per minute until the mouse falls off.
- Promptly record the duration each mouse remains on the rod. Allow a 30 min interval between trials for each mouse, and calculate the average value from three repeated trials.
NOTE: Use the rotarod test to assess motor coordination before establishment of the OA model and after completion of EA treatment. To minimize postoperative pain, reduce rotarod data collection during the first week after surgery.
- Small-animal US examination
NOTE: The step-by-step procedure for ultrasound imaging and joint cavity delineation is shown in Figure 2.- Before formal data acquisition, place the mouse in an anesthesia chamber until it loses motor function, and then use depilatory cream to remove hair from the right knee joint. When removing a mouse's fur, be as gentle as possible; gently wipe it with warm water to minimize irritation to the mouse.
NOTE: Maintain blinding during analysis by displaying only animal codes and time points until all volume measurements are completed and group information is revealed for statistical analysis. - Turn on the ultrasound system, install the small-animal ultrasound transducer, and set up the appropriate mouse examination protocol. Simultaneously, place the mouse in a cage for continuous anesthesia.
- Once anesthesia is complete, transfer the mouse to the control platform and administer isoflurane inhalation anesthesia via a nasal mask. Position the mouse with its head facing away from the operator and its tail facing the operator.
- Flex the knee joint, secure the mouse, and apply US coupling agent to the skin over the patellar ligament.
- Adjust the probe and position it so that it is parallel to the knee joint.
- Set the scan distance to 4 mm and the step size to 0.04 mm. Locate the joint cavity on the image based on its anatomical position. Do not move the animal during the probe scan.
- Acquire images. Identify the joint cavity: a triangular region with distinct boundaries between the femur, tibia, and the overlying skin and muscles.
- Name and save the scan results, then export them to the analysis computer while maintaining the original folder structure.
- Analyze the knee joint cavity volume using software. Enter the Study module, and click the Import function.
- Browse and select the data folder, check the data files to be imported, and double-click to open them.
- In display mode, select Image Processing | Load to 3D | Cross-sectional View | Volume Measurement | Start in sequence.
- Use the mouse wheel or slice slider to scroll through the slices from proximal to distal, locating the slice where the joint cavity first appears (typically appearing as a triangular region with clear boundaries between the femur, tibia, and the overlying skin and muscle tissue).
- Begin tracing on the slice where the joint cavity first appears. Left-click to start drawing the contour.
- Trace along the edge of the joint cavity point by point to draw a closed contour until the joint cavity disappears completely.
- Click Finish; the system will generate a 3D segmented volume and output the volume measurement results.
- Select the desired file type to export the image as a TIFF-format image region file (.tif).
- Before formal data acquisition, place the mouse in an anesthesia chamber until it loses motor function, and then use depilatory cream to remove hair from the right knee joint. When removing a mouse's fur, be as gentle as possible; gently wipe it with warm water to minimize irritation to the mouse.
- Small-animal infrared thermography
NOTE: Measurements were taken 1 day before surgery, 7 days after surgery, and at the end of treatment in mice with OA. Perform IRT 6 h after treatment in a temperature‑controlled room (22–24 °C), with mice acclimatized for 30 min before imaging.- Place the animal supine with hindlimbs extended and secure all limbs to the bench with tape to ensure consistent knee exposure. Place the mouse in an induction chamber and continuously administer isoflurane until fully anesthetized.
- Secure the anesthetized mouse in a supine position on the operating table and maintain a constant ambient temperature.
- Gently grasp the mouse's hind limb to extend the right knee joint, and then use an infrared thermal imager to capture images and measure temperatures in the area.
- Use the default skin emissivity (0.98). Acquire images 3 min after deep anesthesia. Define the knee region of interest (ROI) as the medial joint line at the femoral‑tibial articulation, and the ankle ROI as the dorsal surface of the tibiotalar joint. Manually delineate all ROIs by a single trained operator based on these landmarks.
- Analyze the images using the device’s accompanying software to read temperature data from the knee joint and surrounding skin, and set measurement control points at the ankle and knee joints where temperature gradients decrease.
- Small-animal MRI
NOTE: After EA treatment, small-animal MRI was used to assess local inflammation in the knee joints of mice in each group.- Place the mouse in an anesthesia box for anesthesia. Once motor function is lost, apply hair removal cream to both knee joints.
- After 1 min, wipe off the hair removal cream with gauze moistened with warm water to complete hair removal on both knee joints.
NOTE: Ensure that as much of the mouse’s fur as possible is removed, and perform the collection under anesthesia. - Set up the appropriate protocol using a mouse-sized gantry.
- Ensure that the positioning device uses a three-plane fast gradient echo sequence (TR/TE = 50/3 ms, field of view (FOV) = 30 × 30 mm, slice thickness 1 mm) to center the knee joint in the image; use a T2-weighted fast spin echo (T2WI) sequence to scan the mouse knee joint.
- Use the following scan parameters: repetition time (TR) of 2,500 ms, echo time (TE) of 8 ms, field of view (FOV) of 20 × 20 mm, matrix of 256 × 256, slice thickness of 0.5 mm, no inter-slice spacing, and 10 consecutive slices covering the region from the femoral condyle to the tibial plateau; expect the duration of a single scan to be approximately 8 min and 20 s.
- Examine the obtained T2-weighted images to observe morphological changes in the knee cartilage, synovium, joint cavity, and surrounding soft tissues, and evaluate joint effusion, synovial thickening, and local inflammation.
- Place the mouse on the gantry, induce inhalation anesthesia with isoflurane via a mask, and secure the limbs with medical tape to ensure consistent upward positioning of the knees.
- Slide the gantry into the MRI scanner for imaging.
- On the three-plane localizer, confirm that the knee joint space is parallel to the coronal plane, the slab center aligns with the joint space, and bowel loops or air cavities are excluded from the FOV to avoid susceptibility artifacts; if positioning is off, re-localize and rescan.
- Export the acquired multi-echo T2-weighted images in DICOM or NIfTI format for qualitative assessment.
- Assess the MR images by visually examining the signal intensity and distribution of hyperintense areas within the knee joint and periarticular soft tissues, and compare the inflammatory signals among groups based on these exported images.
4. Pathological and morphological observations
- Fixation and sectioning of mouse knees
- Fix both knee samples from mice in 10% paraformaldehyde for 48 h. Subsequently, immerse the samples in phosphate-buffered saline (PBS) for 30 min and rinse.
- After blotting excess moisture, promptly transfer samples to freshly prepared decalcification solution (pH 7.2–7.4) and replace the solution every 3 days;
- Continue decalcification for 2 weeks, rinse the samples under running water, and then immerse them in 75% ethanol for 2 h.
- Perform automated gradient dehydration in a tissue processor for 18 h.
- After dehydration, immerse the sample in preheated paraffin wax for 2 h in a paraffin embedding machine, then proceed with embedding;
- During sagittal embedding of the knee joint, position the medial joint surface downward so that this surface is sectioned first.
- Mount the tissue block on the microtome and perform continuous sectioning at 4 µm. After reaching the mid-meniscus separation, collect 21 consecutive sections.
- Spread sections on a section spreader. Use forceps to separate specimens on the surface of water and retrieve them with coverslips, collecting two specimens per coverslip;
- Place slides flat in a slide dryer for over 1 h to ensure complete moisture evaporation. Place the slides in a specimen box and dewax them in an oven at 60 °C for 8 h. Set aside for later use.
NOTE: All paraformaldehyde fixative, decalcification solution, and ethanol washes must be collected as hazardous waste and disposed of in accordance with institutional guidelines.
- Safranin O-Fast Green staining
- Place unstained sections on a staining rack and heat them in an oven for 5 min. During this time, prepare the staining solution in a fume hood.
- Allow sections to return to room temperature, then routinely dewax to water.
- Transfer sections to wet box and stain with fresh Weigert's solution (Part A + Part B) for 5 min.
- Rinse with water for 3 x 1 s.
- Differentiate with 1% hydrochloric acid in ethanol for 15 s, then rinse with distilled water for 10 min.
- Stain with Fast Green solution for 4 min and 55 s.
- Quickly wash the sections with 1% acetic acid solution for 10-15 s to remove residual Fast Green, and then air-dry.
- Immerse in Safranin O stain for 4 min 35 s.
- Rapidly dehydrate the sections with 95% ethanol for 3-5 s, followed by rinses with absolute ethanol for 2 x 1 min.
- Clear with xylene, mount with neutral resin, and place in a fume hood for 4 h to evaporate xylene.
- Preview and scan the section with a whole-slide scanner.
NOTE: Xylene, acid-alcohol, acetic acid, paraformaldehyde, and the staining solutions used in this study, including Weigert's solution, Fast Green, and Safranin O, are hazardous materials. All manipulations should be performed in a fume hood while wearing appropriate personal protective equipment, including nitrile gloves, a lab coat, and safety goggles. Hazardous waste, including used reagents and washes, must be segregated, with xylene waste kept separate from aqueous waste, collected in designated containers, and disposed of in accordance with institutional regulations.
5. Statistical analysis
- Report continuous data as mean ± standard deviation (SD) unless otherwise indicated; OARSI scores are reported as median (P25, P75).
- For outcomes reported as mean ± SD, perform multiple-group comparisons using one-way analysis of variance (ANOVA) followed by Tukey post hoc tests.The OARSI scores were analyzed using the Kruskal-Wallis test, followed by post hoc tests using the one-sided Mann-Whitney test for pairwise comparisons between the two groups15.
- Consider P values < 0.05 statistically significant ("ns" indicates no significant difference).
Results
The rotarod test showed longer fall latency in the EA group than in the DMM group (P < 0.05), whereas the SA group did not differ significantly from the DMM group (Figure 1C and Table 1). Before modeling, longitudinal ultrasound scans of the knee joint (scan distance, 4 mm; step size, 0.04 mm) showed no significant differences in joint cavity volume among the groups (Figure 3A,B and Table 2). One week after modeling, three-dimensional reconstruction showed significantly greater joint cavity volume in the DMM, SA, and EA groups than in the Sham group (P < 0.05), with no significant differences among the DMM, SA, and EA groups (P > 0.05) (Figure 3A,C). After 4 weeks of EA treatment, joint cavity volume was significantly lower in the EA group than in the DMM group (P < 0.05) (Figure 3A,D), consistent with reduced joint cavity swelling.
IRT is a technique used to collect focal-plane temperature information within a field of view and to display surface temperature distributions in pseudocolor format16. There were no significant differences in skin surface temperature among the groups before modeling or 1 week after modeling (Figure 4A-C and Table 3). However, following EA treatment, skin surface temperature in the DMM group was significantly lower than in the Sham group. In contrast, skin surface temperature in the EA group was significantly higher than that in the DMM group (Figure 4A,D), showing that EA was associated with higher local skin surface temperature than DMM, whereas SA was not.
MRI images showed no visible periarticular muscle signal abnormality in the Sham group, more pronounced signal changes in the DMM group, less pronounced changes in the EA group, and similar changes in the SA and DMM groups (Figure 5A). After EA treatment, the right knee joints were harvested, embedded in paraffin, and sectioned sagittally at 4 µm. Sections were stained with Safranin O-Fast Green and graded using the OARSI histopathological system. Compared with the Sham group, the DMM group showed greater articular cartilage wear and a higher OARSI score. The EA group showed less cartilage degeneration and a lower OARSI score than the DMM group (P < 0.05), whereas the SA group did not differ significantly from the DMM group (Figure 5B,C and Table 4).
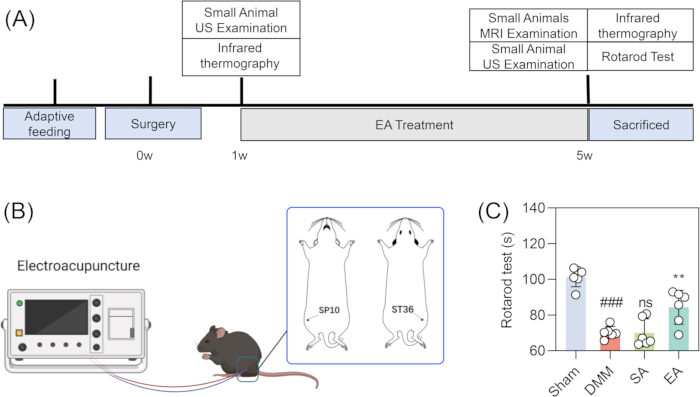
Figure 1: Experimental timeline, acupuncture-point diagram, and rotarod test in mice with OA. (A) Experimental timeline. (B) Diagram of acupuncture points. (C) Rotarod test. n = 6 per group. Each mouse completed three trials. Data are presented as mean ± SD. ### Sham vs DMM, P < 0.001; ns, SA vs DMM, P > 0.05; ** EA vs DMM, P < 0.01. Please click here to view a larger version of this figure.
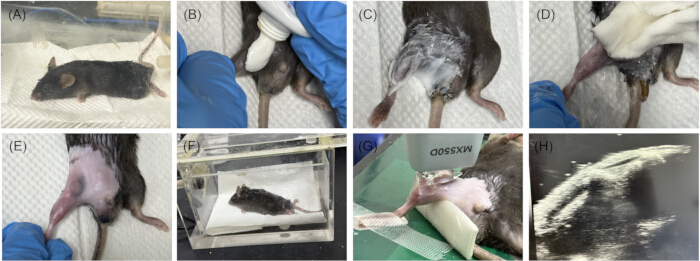
Figure 2: Step-by-step ultrasound examination. (A) Place the mouse in an induction chamber for anesthesia. (B) Apply depilatory cream to the hind limb. (C) After applying the cream evenly, wait 1 min. (D) Wipe off excess depilatory cream and hair with gauze. (E) Inspect the depilated hind limb. (F) Before image acquisition, return the mouse to the induction chamber for anesthesia. (G) Apply ultrasound coupling agent to the hind limb and rotate the probe until it is parallel to the longitudinal axis of the hind limb. (H) Acquire ultrasound images. Please click here to view a larger version of this figure.
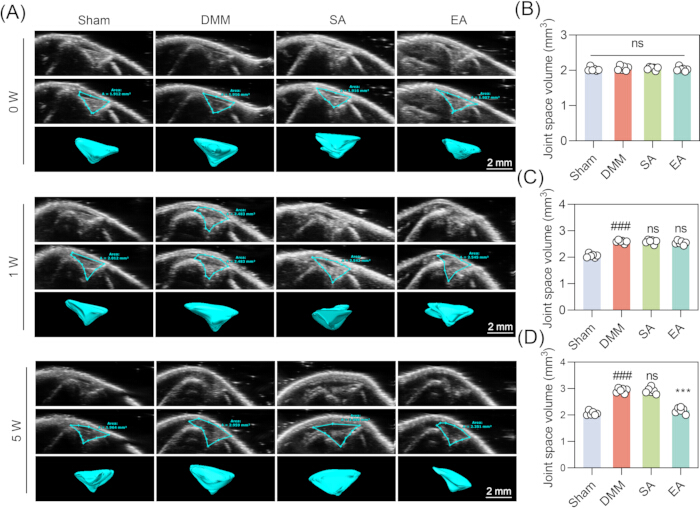
Figure 3: Representative images and quantitative results from small-animal ultrasound examinations in mice with OA. (A) Three-dimensional ultrasound reconstructions of the knee joint before surgery, 1 week after surgery, and after EA treatment (scan distance, 4 mm; step size, 0.04 mm). Scale bars = 2 mm. (B) Preoperative joint cavity volume (n = 6 per group). (C) Joint cavity volume 1 week after surgery (n = 6 per group). (D) Joint cavity volume after EA intervention (n = 6 per group). ### Sham vs DMM, P < 0.001; ns, SA vs DMM, P > 0.05; *** EA vs DMM, P < 0.001. Please click here to view a larger version of this figure.
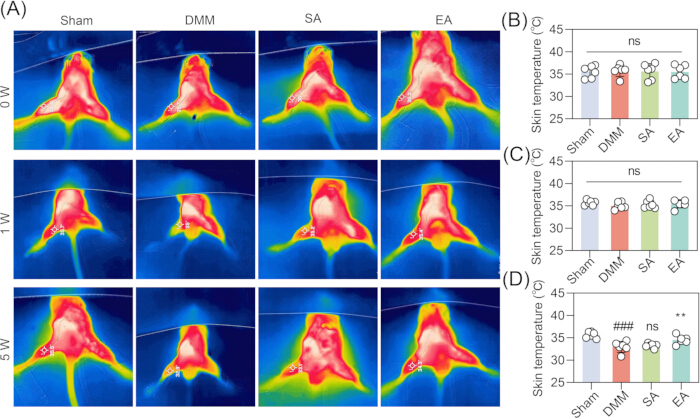
Figure 4: Representative infrared thermograms and quantitative skin-temperature results in mice with OA. (A) Lower-limb thermograms before surgery, 1 week after surgery, and after EA treatment. Each thermogram was displayed using the infrared-camera software's automatic temperature range; therefore, the colors are not directly comparable across panels. Quantitative comparisons should be based on the scatter plots in panels B–D.(B–D) Quantitative skin temperature analysis of the region of interest (ROI) at the knee joint, defined as the medial joint line at the femorotibial joint.(B) Lower-limb skin temperature before surgery (n = 6 per group). (C) Lower-limb skin temperature 1 week after surgery (n = 6 per group). (D) Lower-limb skin temperature after EA intervention (n = 6 per group). Data are presented as mean ± SD. ### Sham vs DMM, P < 0.001; ns, SA vs DMM, P > 0.05; ** EA vs DMM, P < 0.01. Please click here to view a larger version of this figure.
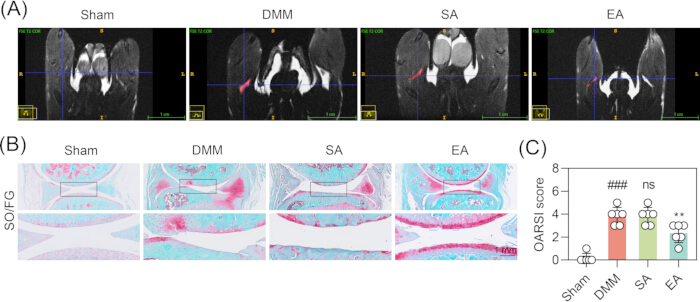
Figure 5: Representative MRI images of periarticular muscle signal changes, knee-joint histological sections, and quantitative results in mice with OA. (A) Representative MRI images from each group. (B) Representative Safranin O-Fast Green-stained knee sections. Scale bars = 1 mm. (C) OARSI cartilage-pathology scores (n = 6 per group). OARSI scores are presented as median (P25, P75). ### Sham vs DMM, P < 0.001; ns, SA vs DMM, P > 0.05; ** EA vs DMM, P < 0.01. Please click here to view a larger version of this figure.
| Group | N | Week 5 |
| Sham | 6 | 101.300 ± 5.416 |
| DMM | 6 | 70.280 ± 3.363### |
| SA | 6 | 70.060 ± 7.796 |
| EA | 6 | 84.390 ± 9.504** |
| Note: ### Sham vs DMM, P < 0.001; ** EA vs DMM, P < 0.01. | ||
Table 1: Rotarod test (mean ± SD; n = 6 per group). ### Sham vs DMM, P < 0.001; ** EA vs DMM, P < 0.01.
| Group | N | Week 0 | Week 1 | Week 5 |
| Sham | 6 | 2.029 ± 0.055 | 2.056 ± 0.071 | 2.061 ± 0.079 |
| DMM | 6 | 2.058 ± 0.068 | 2.591 ± 0.056### | 2.926 ± 0.088### |
| SA | 6 | 2.056 ± 0.045 | 2.592 ± 0.076 | 2.915 ± 0.112 |
| EA | 6 | 2.032 ± 0.059 | 2.548 ± 0.074 | 2.177 ± 0.110*** |
| Note: ### Sham vs DMM, P < 0.001; *** EA vs DMM, P < 0.001. | ||||
Table 2: Joint cavity volume (mean ± SD; n = 6 per group). ### Sham vs DMM, P < 0.001; *** EA vs DMM, P < 0.001.
| Group | N | Week 0 | Week 1 | Week 5 |
| Sham | 6 | 35.517 ± 1.366 | 35.717 ± 0.546 | 35.650 ± 0.701 |
| DMM | 6 | 35.783 ± 1.292 | 35.033 ± 0.781 | 32.967 ± 1.223### |
| SA | 6 | 35.583 ± 1.780 | 35.283 ± 0.861 | 33.267 ± 0.501 |
| EA | 6 | 35.500 ± 1.510 | 35.417 ± 0.882 | 34.533 ± 0.929** |
| Note: ### Sham vs DMM, P < 0.001; ** EA vs DMM, P < 0.01. | ||||
Table 3: Skin temperature (mean ± SD; n = 6 per group). ### Sham vs DMM, P < 0.001; ** EA vs DMM, P < 0.01.
| Group | N | Week 5 | Median |
| Sham | 6 | 0.000 (0.000, 0.250) | 0 |
| DMM | 6 | 4.000 (3.000, 4.250)### | 4 |
| SA | 6 | 4.000 (3.000, 4.250) | 4 |
| EA | 6 | 2.500 (1.750, 3.000)** | 2.5 |
| Note: ### Sham vs DMM, P < 0.001; ** EA vs DMM, P < 0.01. | |||
Table 4: OARSI score [median (P25, P75); n = 6 per group]. ### Sham vs DMM, P < 0.001; ** EA vs DMM, P < 0.01.
Discussion
Knee osteoarthritis (KOA) is a progressive degenerative disease, and current therapeutic interventions offer limited efficacy in halting its underlying progression17. Impaired muscle function and reduced physical performance are clinically significant predictors of symptom severity. Consequently, actively managing modifiable risk factors is essential for delaying KOA progression18. Using a multimodal evaluation system, this study demonstrated that EA was associated with improved motor performance, reduced joint cavity volume, higher local skin surface temperature, less pronounced periarticular muscle MRI signal changes, and lower OARSI scores in mice with OA.
The IRT findings further support this integrated view. At 1 week post-surgery, skin temperatures did not differ among groups, including the Sham group, which likely reflects a uniform response to surgical trauma, characterized by transient vasoconstriction and superficial edema that temporarily reduced heat emission from the skin surface. In contrast, the significant thermal divergence observed after treatment suggests that the anti-inflammatory and microcirculatory actions of EA are cumulative rather than immediate, becoming apparent only after repeated sessions. These outcome measures may be interrelated. Joint cavity swelling generally reflects the extent of synovial inflammation and effusion, whereas local microcirculatory status is closely tied to changes in vascular permeability during inflammation19. In our experiments, the reduction in joint volume following EA administration coincided with an elevation in local temperature. Although IRT does not directly measure blood flow, the coincident changes suggest that enhanced local blood flow might facilitate the clearance of inflammatory mediators, thereby reducing inflammatory infiltration within the synovium and surrounding muscles. The subsequent improvement in motor function may stem from the combined benefits of decreased swelling and mitigated inflammation. Overall, the observed changes across these parameters appear to be interconnected responses rather than isolated events. This pattern suggests that EA may modulate multiple pathological processes in an integrated manner rather than acting via a singular mechanism20.
Compared to conventional endpoint histological assessments, the multimodal dynamic monitoring system employed in this study offers distinct practical advantages. Small-animal ultrasound enables longitudinal, noninvasive tracking of joint effusion without radiation exposure, circumventing the inter-animal variability inherent in endpoint tissue sampling21. Small animal MRI complements US by providing detailed visualization of signal changes in periarticular muscles. This allows for a qualitative assessment of muscle inflammation that US alone might not fully capture. Paired with IRT for real-time measurement of local skin temperature, this approach provides an indirect indicator of the resolution of inflammation. The availability of these imaging modalities makes repeated measurements throughout the treatment course feasible. Beyond complying with the 3R principles, this longitudinal design allows repeated observations within each animal, which minimizes the influence of interindividual variability. To the best of our knowledge, no previous animal study evaluating acupuncture for OA has integrated US, MRI, thermography, behavioral testing, and histopathology within a single experimental framework. This multilevel approach yields complementary data across functional, morphological, and histological domains, providing a more comprehensive assessment than any single endpoint can offer.
Several limitations should be acknowledged. First, this work relies on observational data from animal experiments and lacks mechanistic evidence from in vitro studies. It remains unknown whether EA engages the NOD-like receptor family pyrin domain 3 (NLRP3)/caspase-1/IL-1β pathway. IL-1β and IL-18 are key mediators of synovial and muscle inflammation, and their maturation requires NLRP3 inflammasome activation22. We also cannot determine whether the observed circulatory improvements correlate with changes in the expression of vascular endothelial growth factor (VEGF) or endothelial nitric oxide synthase (eNOS)23. Second, we applied a single EA parameter (2/100 Hz) set to two acupoints (ST36 and SP10). Whether different settings or alternative acupoint combinations might yield superior results requires further investigation24. Third, a single operator acquired all imaging data. While this approach ensured technical consistency, interobserver reliability was not assessed, potentially limiting the generalizability of the imaging findings. Fourth, we omitted a control group subjected solely to restraint, making it challenging to entirely separate the effects of anesthesia, immobilization, and handling from the therapeutic effects of EA. Fifth, the SA procedure was designed as a minimal control to reduce effects specific to acupoints, deep tissues, and electrical stimulation. However, the difference in needling depth between the true and sham interventions prevents us from isolating the contribution of depth alone. Consequently, our findings should be interpreted as a comparison between the full EA protocol and a minimal sham procedure rather than a strict evaluation of electrical stimulation in isolation. Sixth, camera distance, imaging angle, and absolute ROI area were not formally documented, which constitutes a technical limitation. A final limitation is the use of separate ANOVAs per time point, which neglects repeated measures correlations and time by group interaction and thus reduces sensitivity to dynamic changes.
In summary, EA was associated with anti-inflammatory and functional outcomes in a mouse model of DMM-induced KOA. Despite limitations such as variable resolution across modalities, operator dependence of US and IRT, high MRI costs, and potential stress from repeated measurements, the protocol remains a feasible platform for longitudinal multimodal assessment. The integrated system provides a framework for preclinical evaluation. Future work should optimize electrical parameters and leverage organoid, organ‑on‑chip, and AI platforms to elucidate mechanisms and guide individualized therapy25,26. Improved sham controls, standardized protocols, and longer follow‑up are also required to enhance clinical translation.
Disclosures
The authors have no conflicts of interest to declare.
Acknowledgements
This research was supported by the Science and Technology Innovation Action Plan in Shanghai (23YF1447900 to JMC) and the National Natural Science Foundation of China (U23A20508 to LQY, 82575196 to HSC, and U24A6013 to HX).
Materials
| Name | Company | Catalog Number | Comments |
|---|---|---|---|
| 1% acetic acid solution | Solarbio | Cat# G1371 | Differentiation/wash solution for staining |
| 1% hydrochloric acid in ethanol | Solarbio | Cat# G1371 | Acid-alcohol differentiation solution |
| 7T Small Animal MRI | Shanghai Chenguang | 7T MRI NOVAL | Small-animal magnetic resonance imaging system |
| Acupuncture needles (0.16 mm × 25 mm) | Wuxi Jiajian Medical Instrument, Wuxi, China | lot no. 491226 | Sterile acupuncture needles |
| Adhesive microscope slides | Jiangsu Shitai | MH0662 | Microscope slides for tissue sections |
| Anhydrous ethanol | Shanghai Titan Technology Co., Ltd. | 64-17-5 | Ethanol for dehydration |
| C57BL/6 mice | Shanghai Silaike Laboratory Animal Co., Ltd. | https://www.slaccas.com/ | Experimental animals |
| Coverslips | Jiangsu Shitai | Not provided | Tissue-section collection and mounting |
| Decalcification solution | Serivebio | G1105-500ml | Bone and joint decalcification reagent, pH 7.2-7.4 |
| Electrical therapy device | Suzhou Medical Supplies Factory Co., Ltd. | SD-Z | Electroacupuncture stimulator |
| Ethylenediaminetetraacetic acid | Shanghai Titan Technology Co., Ltd. | 60-00-4 | Chelating reagent |
| Fiji (ImageJ) | National Institutes of Health (NIH) | ImageJ bundled with 64-bit Java 8. | Image-analysis software |
| Gauze | Weizhe Medical | Type A1: Standard Gauze Pads (Sterile) | Hair-removal and cleaning material |
| Hair removal cream | VEET | Not provided | Depilatory cream |
| Infrared image-analysis software | FLIR | Version not provided | Software supplied with the infrared thermal imager |
| Infrared thermal imager | FLIR | 435-0007-03 (Early Batch) | Infrared thermography system |
| Inhalation anesthesia system for small animals | Matrx | 07149 | Small-animal gas anesthesia system |
| Isoflurane (inhalation anesthetic) | RWD | 217140901 | Inhalation anesthetic |
| Naisikang Medical Waterproof Elastic Tape (3.81 cm × 4.57 m) | Naisikang™ | 732 | Limb-positioning material for MRI |
| Modified Safranin O and Fast Green Stain Kit (for bone) | Solarbio | Cat# G1371 | Cartilage and bone staining kit |
| Needle holder | RWD | F21001-12 | Intraoperative Clamping and Suturing |
| Neutral resin mounting medium | biosharp | 23338664 | Histological mounting medium |
| Oxygen | Not provided | Not provided | Carrier gas for inhalation anesthesia |
| Paraffin embedding machine | LEICA | EG1150C | Paraffin embedding system |
| Paraffin microtome | LEICA | RM2235 | Rotary microtome |
| Paraffin wax | epredia | 151534 | Embedding medium |
| Paraformaldehyde | Sinopharm Reagents Co., Ltd. | 80096618 | Tissue fixative |
| PBS | Servicebio | G0002 | Phosphate-buffered saline |
| Rotarod apparatus | Panlab | LE8205 | Rotarod fatigue-testing system |
| Small-animal ultrasound imaging platform | Fuji | Vevo 3100 | Small-animal ultrasound system |
| Sodium hydroxide | Shanghai Titan Technology Co., Ltd. | G19852H | Laboratory reagent |
| Stereomicroscope | Olympus | SZ61 | Dissection microscope |
| Suture Needles with Thread (6-0 absorbable suture and 6-0 silk suture) | Ningbo Medical Suture Co., Ltd. | Cosmetic Needles 1/2 4X12 40 | Postoperative Suturing |
| Surgical blades(10#) | Hangzhou Nuoyang Biotechnology Co., Ltd. | 20090120 | Incision of the medial meniscus ligament |
| Tissue dehydrator | LEICA | TP1020 | Automated tissue processor |
| Tissue dryer | LEICA | HI1220 | Slide dryer |
| Tissue embedding blocks | Jiangsu Shitai | REF31050102W | Embedding consumables |
| Tissue spreader | LEICA | HI1210 | Section-spreading system |
| Ultrasound analysis software (Vevo Lab 3.1.0) | Optic | Version 3.1.0 | Three-dimensional ultrasound analysis software |
| Ultrasound coupling agent | Hu Qingyu Tang | YY0299-2008 | Ultrasound coupling gel |
| Whole-slide scanner | Olympus | VS200 | Digital slide-scanning system |
| Xylene | Sinopharm Reagents Co., Ltd. | 10023418 | Clearing reagent |
References
- Lee BJ et al. Association between metabolic syndrome and knee osteoarthritis: a cross-sectional nationwide survey study. J Rehabil Med. 2019;51(6):464-70.
- Glyn-Jones S et al. Osteoarthritis. Lancet. 2015;386(9991):376-87.
- Hunter DJ, Bierma-Zeinstra S. Osteoarthritis. Lancet. 2019;393(10182):1745-59.
- Rahmati M, Mobasheri A, Mozafari M. Inflammatory mediators in osteoarthritis: a critical review of the state-of-the-art, current prospects, and future challenges. Bone. 2016;85:81-90.
- Fokam D, Lehmann C. Clinical assessment of arthritic knee pain by infrared thermography. J Basic Clin Physiol Pharmacol. 2019;30(3):20170218.
- Ren G et al. Serum and synovial fluid cytokine profiling in hip osteoarthritis: distinct from knee osteoarthritis and correlated with pain. BMC Musculoskelet Disord. 2018;19(1):39.
- Siqueira MB et al. Comparison of synovial fluid cytokine levels between traumatic knee injury and end-stage osteoarthritis. J Knee Surg. 2017;30(2):128-33.
- Xu H et al. Utilization of longitudinal ultrasound to quantify joint soft-tissue changes in a mouse model of posttraumatic osteoarthritis. Bone Res. 2017;5:17012.
- Tattersall GJ. Infrared thermography: a non-invasive window into thermal physiology. Comp Biochem Physiol A Mol Integr Physiol. 2016;202:78-98.
- Schiavon G et al. Infrared thermography for the evaluation of inflammatory and degenerative joint diseases: a systematic review. Cartilage. 2021;13(2_suppl):1790S-801S.
- De Marziani L et al. Infrared thermography in symptomatic knee osteoarthritis: joint temperature differs based on patient and pain characteristics. J Clin Med. 2023;12(6):2319.
- Zhao Y, Liu B, Liu CJ. Establishment of a surgically-induced model in mice to investigate the protective role of progranulin in osteoarthritis. J Vis Exp. 2014;(84):e50924.
- Jiang Y et al. Electroacupuncture ameliorates cerebrovascular impairment in Alzheimer’s disease mice via melatonin signaling. CNS Neurosci Ther. 2023;29(3):917-31.
- Wang Z et al. Effect of electroacupuncture on the kisspeptin system in a pubertal rat model of polycystic ovary syndrome. Acupunct Med. 2021;39(5):491-500.
- Brochard S, et al. A single intraarticular injection of a tranexamic acid-modified hyaluronic acid (HA/TXA) alleviates pain and reduces OA development in a murine model of monosodium iodoacetate-induced osteoarthritis. Front Pharmacol. 2024;15:1456495.
- Mi B et al. A preliminary study on the diagnostic value of infrared thermography in children with idiopathic thrombocytopenic purpura. Sheng Wu Yi Xue Gong Cheng Xue Za Zhi. 2020;37(4):652-60.
- Bannuru RR et al. OARSI guidelines for the non-surgical management of knee, hip, and polyarticular osteoarthritis. Osteoarthritis Cartilage. 2019;27(11):1578-89.
- Oliveira MC, Vullings J, van de Loo FAJ. Osteoporosis and osteoarthritis are two sides of the same coin paid for obesity. Nutrition. 2020;70:110486.
- Ramezanpour S et al. Impact of sustained synovitis on knee joint structural degeneration: 4-year MRI data from the Osteoarthritis Initiative. J Magn Reson Imaging. 2023;57(1):153-64.
- Zhao M et al. Electroacupuncture alleviates osteoarthritis and is associated with activation of the Nrf2/HO-1 pathway and reduced ferroptosis-related changes. Front Mol Biosci. 2026;13:1764620.
- Blackshear CP et al. Three-dimensional ultrasound versus computerized tomography in fat graft volumetric analysis. Ann Plast Surg. 2018;80(3):293-6.
- Karmakar V et al. Targeting the NLRP3 inflammasome as a novel therapeutic target for osteoarthritis. Inflammopharmacology. 2025;33(2):461-84.
- Wilson TG et al. Circulating miR-126-3p is a mechanistic biomarker for knee osteoarthritis. Nat Commun. 2025;16(1):2021.
- Wang J et al. Effects of electroacupuncture on knee osteoarthritis in rats through suppressing p38 MAPK/ERK/CREB pathway. J Inflamm Res. 2026;19:581985.
- Cao JC, et al. Electrostrategies in orthopaedic research. Biomater Transl. 2025;6(3):294-313.
- Wei Y, et al. Organoids in aging research: Bridging cutting-edge biotechnology with the wisdom of traditional Chinese medicine.Organoid Res. 2026;2(1):025460035.