This protocol provides a standardized and reproducible workflow for evaluating the proliferative capacity and osteogenic and odontogenic differentiation of human dental stem cells cultured on nanomaterial scaffolds, using standardized assays (ALP activity, RANKL immunofluorescence [osteogenic], and DMP-1 immunofluorescence [odontogenic]) and normalization strategies to ensure inter-study comparability.
Method Article
A Standardized In Vitro Protocol for Evaluating Human Dental Pulp Stem Cell Differentiation and Proliferation on Nanomaterial Scaffolds
In This Article
Summary
Abstract
Reliable assessment of osteogenic and odontogenic differentiation, as well as stem cell proliferation, is fundamental to evaluating the biological performance of scaffold-based regenerative strategies. However, variability in experimental protocols, assay selection, and data interpretation often limits reproducibility and inter-study comparison. The protocol described in this article presents a standardized, reproducible workflow for the in vitro evaluation of osteogenic and odontogenic differentiation, as well as proliferative capacity, of stem cells cultured on biomaterial scaffolds. Osteogenic commitment is evaluated by alkaline phosphatase (ALP) enzymatic activity and Receptor Activator of Nuclear Factor κB Ligand (RANKL) immunofluorescence, while odontogenic commitment is assessed by DMP-1 (dentin matrix protein-1) immunofluorescence; both protein endpoints are quantified using standardized H-score methodology. Critical experimental parameters, including cell seeding density, induction timelines, assay conditions, normalization strategies (including protein-normalized ALP activity, cell-normalized 3-(4,5-dimethylthiazol-2-yl)-2,5-diphenyltetrazolium bromide (MTT) viability, and immunofluorescence H-score), and data analysis approaches, are detailed, along with troubleshooting guidance to minimize technical variability. The methodology has been applied as a standardized framework across multiple scaffold-based experimental studies, demonstrating robustness and reproducibility. By providing a comprehensive, validated framework, this article aims to facilitate standardized assessment of stem cell–scaffold interactions and improve comparability across preclinical regenerative studies.
Introduction
Regenerative endodontics represents a paradigm shift in dentistry, focusing on the restoration of dental pulp vitality through the use of stem cells, growth factors, and scaffold1,2. Maintaining pulp vitality is essential for sensory function and immune response and is particularly vital in managing immature teeth with necrotic pulps to allow for continued root development2.
Human dental pulp stem cells (DPSCs) and stem cells from the apical papilla (SCAPs) are primary candidates for these procedures due to their high proliferative potential, self-renewal, immunosuppressive properties, and ability to differentiate into odontoblast-like cells under suitable microenvironmental conditions, making them highly viable candidates for future applications in regenerative medicine and cell-based therapeutic interventions3,4,5.
While conventionally formulated materials like calcium silicate-based cements have been explored, emerging evidence suggests that nanoparticulate modification can substantially influence biomaterial–cell interactions6. Nanostructured biomaterials may provide a more biomimetic microenvironment, potentially enhancing stem cell adhesion and lineage-specific differentiation7. However, the biological behavior of novel materials, such as NeoMTA2 in nanoparticulate form, remains inadequately understood compared to established materials, such as nanohydroxyapatite8. This protocol addresses the need for a standardized methodological framework to accurately and reproducibly evaluate these interactions.
This standardized framework is particularly suited to studies evaluating novel biomaterials or nanomaterial scaffolds under identical biological conditions, where inter-study comparability is paramount. It offers advantages over single-assay approaches by integrating viability screening (MTT), early osteogenic commitment (ALP activity), and protein-level differentiation (immunofluorescence H-score) within a single workflow. Researchers using conventional alizarin red staining or single-timepoint assays may benefit from adopting this multi-parametric framework to reduce observer bias and improve quantitative resolution. However, this protocol is not intended for three-dimensional organoid cultures, co-culture systems, or animal-derived stem cell models without appropriate adaptation. Investigators requiring gene expression profiling (e.g., RT-qPCR for RUNX2, OCN, or DSPP) should supplement this workflow with molecular assays, as the current protocol focuses exclusively on protein and enzymatic endpoints.
To comprehensively capture the bifunctional differentiation capacity of dental stem cells, this protocol employs two complementary immunofluorescence markers that reflect distinct biological endpoints. RANKL (receptor activator of nuclear factor kappa-B ligand) is used as a marker of osteogenic lineage commitment: its expression on osteoblast-like cells reflects calcium-ion-driven mineralization signaling and bone-forming cell activation, consistent with its use in several studies evaluating SCAPs4,8,9, DMP-1 (dentin matrix protein-1) is used in parallel as a specific marker of odontogenic/dentinogenic differentiation: its upregulation in odontoblast-like cells reflects the induction of dentin matrix formation and pulp-specific hard tissue repair, and is particularly relevant when the target cell population is DPSCs10. By quantifying both RANKL and DMP-1 within the same experimental framework using H-score methodology, this protocol allows investigators to distinguish osteogenic from odontogenic commitment; two overlapping yet mechanistically distinct outcomes of stem cell–scaffold interactions without requiring separate experimental designs.
Protocol
This protocol was approved by the Faculty of Dentistry, Ain Shams University, Ethical Committee with approval number FDASU-Rec IM112105. All procedures involving human tissues were performed in compliance with the Declaration of Helsinki. Written informed consents were obtained from all participants prior to tooth extraction and stem cell harvesting.
1. Preparation and characterization of nanomaterials
- Synthesize nanomaterials according to specific requirements10,11. For Nano-NeoMTA2, mill the powder using a planetary ball mill (see Table of Materials) for 10 h at 350 rpm with 3 min on/off intervals. Use a ball-to-powder weight ratio of 10:1 with zirconia milling balls (5 mm diameter) in a zirconia grinding jar. Verify final particle size by transmission electron microscope (TEM) (target: <200 nm) before proceeding.
CAUTION: NeoMTA2 powder may cause respiratory irritation if inhaled. Perform all dry-milling steps in a certified fume hood wearing an N95 respirator, safety goggles, and nitrile gloves. - Prepare nanohydroxyapatite using a wet chemical precipitation method8,11,12: 10Ca(NO₃)₂ + 6(NH₄)₃PO₄ + 8NH₄OH → Ca₁₀(PO₄)₆(OH)₂ + 20NH₄NO₃ + 6H₂O. Prepare 1 L of 0.5 M calcium nitrate solution and 0.6 L of 0.3 M ammonium phosphate solution, both in deionized water. Drop calcium nitrate solution into ammonium phosphate solution at approximately 2–3 mL/min under continuous stirring at 400 rpm and heat to 70 °C, maintaining pH 10–12 by dropwise addition of ammonium hydroxide8.
CAUTION: Ammonium hydroxide is corrosive and releases toxic ammonia vapors. Handle only in a chemical fume hood. Wear acid-resistant gloves, splash goggles, and a lab coat. Flush skin contact immediately with water for ≥15 min. - Treat the resultant apatite precipitate hydrothermally in an autoclave at 140 °C and 0.3 MPa for 2–3 h10. Freeze-dry the purified precipitate at -50 °C under a vacuum of ≤0.05 mbar for 48 h8.
- Prepare bioactive glass 45S5 nanoparticles using the sol-gel method as follows.
- Prepare the precursor solution by mixing 40 mL of tetraethyl orthosilicate (TEOS) with 10 mL of 2 M nitric acid (HNO₃) as the acid catalyst in a polypropylene beaker under continuous stirring at 300 rpm at room temperature.
- After 30 min, add calcium nitrate tetrahydrate (Ca(NO₃)₂·4H₂O) and sodium nitrate (NaNO₃) to achieve the target molar composition: 45 mol% SiO₂, 24.5 mol% CaO, 24.5 mol% Na₂O, and 6 mol% P₂O₅. Add triethyl phosphate (TEP) as the phosphorus precursor.
- Stir at room temperature for 24 h. Age the gel at 60 °C for 24 h in a sealed container. Dry at 120 °C for 24 h. Calcine in a muffle furnace at 650 °C for 3 h (ramp rate: 2 °C/min). Grind and confirm phase composition by TEM and X-ray diffraction (XRD)4,9.
CAUTION: TEOS and ethanol are flammable. HNO₃ is corrosive. Conduct all procedures in a fume hood away from ignition sources.
- Characterize all prepared nanoparticles using high-resolution TEM and XRD to confirm particle size and crystallinity8. Record mean particle size, polydispersity index (PDI), and zeta potential using dynamic light scattering (DLS) to confirm colloidal stability. Accept batches with mean particle size <200 nm and zeta potential <−15 mV or >+15 mV.
2. Stem cell harvesting and culture
- Harvest DPSCs or SCAPs from freshly extracted impacted mandibular third molars after obtaining written informed consent10. Process extracted teeth within 2 h of extraction and transport in sterile phosphate-buffered saline (PBS) at 4 °C.
NOTE: Donor eligibility criteria include systemically healthy adults aged 18–35 years, non-smokers, with no history of antibiotic use within the preceding 3 months, no periodontal disease, and no radiographic evidence of periapical pathology. - Isolate cells using the enzyme digestion method9. Mince the dental tissue into 1–2 mm pieces and digest with a collagenase type I solution at a concentration of 3 mg/mL in serum-free Dulbecco's Modified Eagle Medium (DMEM) for 1 h at 37 °C with continuous agitation at 60 rpm on a rocking platform8. Neutralize with complete culture medium and filter through a 70 µm cell strainer.
CAUTION: Collagenase type I may contain endotoxins. Use only endotoxin-tested, tissue-culture-grade collagenase. Wear gloves and avoid inhalation. - Seed the single-cell suspension in 75 cm2 flasks at an initial density of 1 × 10⁴ cells/cm2 with complete culture medium consisting of DMEM, 10% fetal bovine serum (FBS), and 1% penicillin/streptomycin (Table of Materials)8.
- Incubate the flasks at 37 °C in an atmosphere of 5% CO₂8. Monitor for growth and contamination daily using an inverted phase-contrast microscope10. Replace culture medium every 48–72 h. Discard any flask showing signs of contamination (turbidity, color change, irregular cell morphology).
- Harvest the cells after the third passage, reaching approximately 70–80% confluency8. For passaging, aspirate the medium, rinse with PBS, and detach cells using 0.25% trypsin-EDTA at 37 °C for 3–5 min. Neutralize with complete culture medium, centrifuge at 300 x g for 5 min, and reseed at 1 × 10⁴ cells/cm2. Use only cells between passage 3 and passage 6 to maintain phenotypic stability.
3. Stem cell characterization
- Assess the immunophenotype of isolated cells using flow cytometry8,10. Characterize cells at passage three. Include an unstained negative control and single-stained compensation controls for each fluorochrome used.
- Adjust the cell count to 106/mL in PBS. Centrifuge at 800 x g for 10 min and wash the pellet twice with PBS8,10.
- Stain the cells with anti-human antibodies for mesenchymal markers (CD44, CD43) and hematopoietic markers (CD45) at manufacturer-recommended dilutions (typically 1:100 in PBS containing 1% bovine serum albumin (BSA) (Table of Materials)8,10. Incubate at 4 °C for 45 min in the dark. Wash twice with PBS and resuspend in 300 µL PBS for acquisition.
- Analyze cells using flow cytometry analysis software (Table of Materials) to assess the immunophenotype (expression of CD44 and CD73, with CD45 as a hematopoietic exclusion marker). Apply sequential gating: (a) scatter gating (FSC-A vs. SSC-A); (b) doublet exclusion (FSC-H vs. FSC-A); (c) fluorochrome-specific gates set against unstained controls. Report the percentage of positive cells for each marker together with the gating strategy.
4. Determination of safe material concentration (half-maximal effective concentration, EC₅₀)
- Determine the EC₅₀ using statistical analysis software (GraphPad Prism 9). Fit the dose–response data to a non-linear regression sigmoidal curve (four-parameter logistic model: Y = Bottom + (Top − Bottom) / (1 + 10^((LogEC₅₀ − X) × HillSlope))). Report the EC₅₀ value in µg/mL with 95% confidence interval8.
- Prepare serial dilutions of the nanomaterials (50, 25, 12.5, 6.25, 3.12, and 1.56 µg/mL) in 1 mL PBS. Vortex the stock suspension for 30 s, then sonicate (probe sonicator, 40 W, 30 s on/10 s off for 3 cycles at 4 °C) to ensure a homogeneous suspension. UV-sterilize in a biosafety cabinet under UV light for 30 min.
- Culture stem cells at a density of 1 × 10⁴ cells/well in 96-well plates for 72 h with the various concentrations and count viable cells using Trypan blue to calculate the EC₅₀ using the four-parameter logistic model described in step 4.1.
- Perform experiments in triplicate (n = 3 independent wells per concentration) with at least three biological replicates. Report EC₅₀ values as mean ± SD and calculate the coefficient of variation (CV%) across replicates (acceptable CV <15%).
5. Evaluation of osteogenic and odontogenic differentiation
NOTE: This section assesses two complementary differentiation pathways using parallel immunofluorescence assays from the same cell preparation. RANKL (step 5.5) serves as the osteogenic marker; DMP-1 (step 5.6) serves as the odontogenic marker. Both are quantified by the same H-score methodology (step 5.8). Run both assays on separate coverslips prepared simultaneously.
- Seed stem cells in six-well plates at a density of 4.5 × 10⁵ cells/well. Allow cells to adhere for 24 h in complete culture medium before initiating differentiation.
- Assign samples into four groups: negative control (DMEM alone), positive control (osteogenic/odontogenic differentiation medium), and experimental groups (nanomaterials at EC₅₀-derived safe concentrations).
- Prepare osteogenic differentiation medium by supplementing DMEM with 10% FBS, 1% penicillin/streptomycin, 10 mM β-glycerophosphate, 50 µg/mL ascorbic acid (L-ascorbate-2-phosphate), and 100 nM dexamethasone. Replace medium every 48 h. Incubate for 72 h at 37 °C and 5% CO₂.
- Measurement of ALP activity
- Seed cells in 24-well culture plates at 1 × 10⁴ cells/well and incubate at 37 °C in a humidified atmosphere with 5% CO₂ for 72 h.
- Aspirate the culture medium, rinse wells with PBS, and lyse cells by adding 200 µL of lysis buffer per well (0.1% Triton X-100 in PBS) and incubating at 4 °C for 10 min with gentle rocking.
- Collect the lysate and centrifuge at 500 x g for 5 min at 4 °C; use the supernatant for all downstream ALP measurements. Transfer 50 µL of each test sample and 100 µL of p-nitrophenol standards into a 96-well microtiter plate. Add AMP substrate buffer (Table of Materials) to initiate the catalytic reaction.
- Following a secondary incubation of 30 min at 37 °C, stop the reaction by adding 50 µL of 0.5 M NaOH per well. Measure the absorbance immediately at 405 nm using an absorbance microplate reader (Table of Materials).
- Generate a standard curve of absorbance versus p-nitrophenol concentration and calculate the ALP activity in U/L.
- Determine the total protein content of the same cell lysate using a Bradford or BCA protein assay. Normalize ALP activity to total protein content and report the final results as U/mg protein.
- Osteogenic marker (RANKL)
- Assess RANKL protein expression using immunofluorescence. First, prepare isotype and secondary-only controls: (a) replace the primary antibody with an isotype-matched rabbit IgG at the same concentration, and (b) omit the primary antibody entirely in separate wells.
- Fix cells with freshly prepared 4% formaldehyde in PBS for 15 min at room temperature. Wash three times with PBS (5 min each).
- Permeabilize with 0.1% Triton X-100 in PBS for 10 min, then block with 5% normal goat serum in PBS for 1 h at room temperature to reduce non-specific binding. Without washing, directly add Rabbit Anti-RANKL primary antibody at a dilution of 1:200 in blocking buffer (Table of Materials) and incubate overnight at 4 °C.
- Wash three times with PBS, then incubate with Goat Anti-Rabbit IgG fluorophore-conjugated secondary antibody at 1:500 dilution in blocking buffer (Table of Materials) for 1 h at room temperature in the dark8. After secondary antibody incubation, wash three times with PBS (5 min each) and proceed directly to step 5.7 for mounting.
CAUTION: Formaldehyde (4% solution) is a toxic fixative and probable carcinogen. Prepare and use only in a certified chemical fume hood. Wear nitrile gloves, splash goggles, and a lab coat. Dispose of waste per institutional guidelines.
NOTE. Cell identity is instead confirmed by phase contrast microscopy and morphological criteria prior to immunofluorescence scoring (see step 5.10).
- Odontogenic marker (DMP-1)
NOTE: Assess DMP-1 (dentin matrix protein-1) protein expression using immunofluorescence in parallel with step 5.5 to evaluate odontogenic commitment.- Using a separate set of coverslips from the same cell preparation, repeat all fixation, permeabilization, and blocking steps as described in step 5.5, including isotype and secondary-only controls.
- Without washing after blocking, directly add an anti-DMP-1 primary antibody (see Table of Materials) at 1:200 dilution in blocking buffer and incubate overnight at 4 °C. Wash three times with PBS, then incubate with the appropriate fluorophore-conjugated secondary antibody (use a spectrally distinct fluorochrome from that used for RANKL; see Table of Materials) at 1:500 dilution in blocking buffer for 1 h at room temperature in the dark.
- Acquire fluorescence images at 10x magnification to evaluate DMP-1 expression as an indicator of odontoblast-like differentiation10. After secondary antibody incubation, wash three times with PBS (5 min each) and proceed directly to step 5.7 for mounting.
- Mount the slides with antifade mounting medium (see Table of Materials) and allow to set overnight at room temperature. Mount RANKL and DMP-1-stained slides separately and label clearly (e.g., "RANKL Group 1" and "DMP-1 Group 1") before imaging.
- Examine slides immediately via fluorescence microscopy or store at 4 °C protected from light. Quantify protein expression by evaluating staining intensity using a standardized four-tier scoring system: 0 (no staining), 1+ (weak), 2+ (moderate), and 3+ (strong).
- Acquire images using identical microscope settings (exposure time, laser power, and gain) across all experimental groups. Apply identical settings independently for each marker (RANKL and DMP-1) to ensure intra-marker consistency across groups.
- Score a minimum of five randomly selected high-power fields (x20 objective) per well. Have two independent blinded observers perform the scoring and report the Cohen's kappa coefficient (acceptable kappa ≥ 0.7).
- Calculate the H-score using the formula: H-score = Σ(i × Pi), where i = staining intensity (1, 2, or 3) and Pi = percentage of cells (0–100%) at each intensity level.
NOTE: H-score ranges from 0 to 30010. - Normalize H-score data to the total cell count per field, determined by manual counting of all visible cells in each field under phase contrast microscopy before immunofluorescence imaging, to account for differences in cell density between wells.
- Calculate and report H-scores separately for RANKL (osteogenic endpoint) and DMP-1 (odontogenic endpoint) to enable direct comparison between the two differentiation pathways.
6. Evaluation of proliferation and viability
- Perform cell counting using a hemocytometer and Trypan blue staining to distinguish viable from non-viable cells. Calculate the total number of viable cells per mL of culture. Count at least 100 cells per sample for statistical reliability.
- Conduct the MTT assay to measure mitochondrial metabolic activity8,10.
- Add MTT solution at a final concentration of 0.5 mg/mL (Table of Materials) to the cells and incubate for 4 h at 37 °C. Remove the solution, add a solubilizing agent (e.g., SDS-HCl; see Table of Materials), and measure the optical density at 570 nm using a spectrophotometer (Reference wavelength: 630–650 nm).
- Calculate cell viability as: Viability (%) = (Absorbance of treated cells / Absorbance of untreated control cells) × 100. Values >100% indicate proliferative stimulation relative to the negative control. Include a blank well for background correction.
- Normalize results to cell number using a parallel Trypan blue count. Perform all assays in triplicate (n = 3 wells/group, ≥3 biological replicates).
CAUTION: SDS-HCl solubilization buffer is corrosive. Handle with appropriate PPE. Dispose of formazan-containing waste in accordance with institutional regulations.
Results
All results presented herein are adapted from companion studies4,8,9,10 conducted by the same research group under a unified institutional ethics approval (FDASU-Rec IM112105).
Nanomaterial characterization and stem cell isolation
The standardized workflow initially yields quantifiable confirmation of scaffold properties and stem cell phenotypes. Following synthesis, the prepared nanomaterials are validated using high-resolution TEM and XRD to confirm particle size and crystallinity (Figure 1A,B). Concurrently, DPSCs or SCAPs isolated via enzyme digestion show robust attachment and proliferation in complete culture medium. Flow cytometry analysis validates the immunophenotype of the harvested cells at passage 3, yielding high expression of mesenchymal markers (CD44, CD43) and confirming their non-hematopoietic origin by the absence of CD45 (Figure 1C).
Establishment of safe material concentration and proliferation
By culturing stem cells across serial dilutions of the nanomaterials (50–1.56 µg/mL) for 72 h, four-parameter logistic regression of viable cell counts yields a reliable EC₅₀ value (non-linear sigmoidal dose–response model, as described in step 4.1). MTT viability values exceeding 100% indicate proliferative stimulation relative to the untreated control, as values are normalized to the negative control group (untreated cells set as 100%). A value of ~196% for Nano-NeoMTA2, for example, reflects bioactive stimulation of mitochondrial activity rather than >100% absolute cell survival9.
In several studies applying this standardized protocol, EC₅₀ values of 7.9 µg/mL (Nano-NeoMTA2, SCAPs)8 and 9.92 µg/mL (Nano-NeoMTA2, DPSCs)10 were established using the four-parameter logistic model (step 4.1), confirming safe working concentrations for use in the differentiation assays described in this protocol. These values are incorporated into Table 1 as representative validation metrics.
Quantification of osteogenic and odontogenic differentiation (dual-marker assessment)
The dual immunofluorescence approach yields two distinct, complementary outcome measures from the same cell preparation. For osteogenic assessment, RANKL H-scores distinguished all four groups with statistical significance: cells cultured with Nano-NeoMTA2 showed substantially higher RANKL expression than the negative control, consistent with upregulated osteoblast-like activation (Figure 2A, Table 1)8,9. For odontogenic assessment, DMP-1 H-scores revealed robust odontoblast-like differentiation in DPSCs cultured with Nano-NeoMTA2, with H-scores significantly higher than those in the nanohydroxyapatite and negative control groups, confirming preferential dentinogenic commitment (Figure 3A, Table 1)10. Cell identity was confirmed by phase contrast microscopy and characteristic morphological criteria (spindle-shaped or polygonal morphology) prior to scoring.
ALP activity was spectrophotometrically distinguished among all groups at 405 nm, serving as an early enzymatic marker of both osteogenic and odontogenic commitment (Table 1). Spectrophotometric MTT analysis confirmed that all nanomaterials at EC₅₀-derived safe concentrations maintained high cell viability relative to the negative control, consistent with the representative values presented (Table 1).
Suboptimal and unsuccessful experimental outcomes
Suboptimal outcomes are summarized in Table 2. Low cell viability in the MTT assay typically indicates that the nanomaterial concentration exceeds the EC₅₀ threshold or that UV-sterilization was insufficient. Inconsistent ALP absorbance (CV > 20%) generally indicates uneven seeding density or incomplete homogenization of the lysis buffer. Weak or absent immunofluorescence signal for either RANKL or DMP-1 most commonly results from antibody inactivation, insufficient permeabilization, or over-fixation; fresh 4% formaldehyde and single-use antibody aliquots resolve this. Cross-reactivity between RANKL and DMP-1 channels should be excluded by reviewing secondary-only control images before scoring.
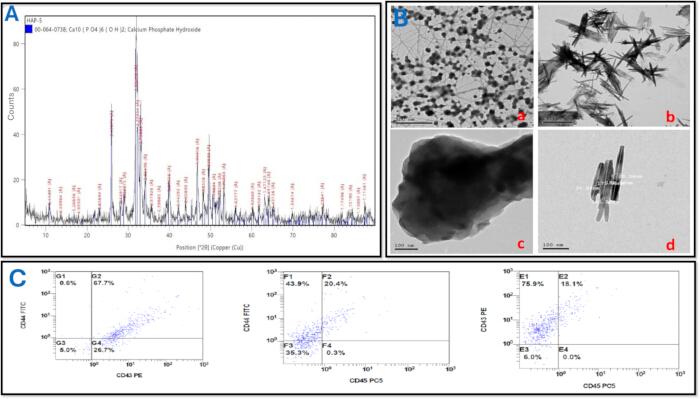
Figure 1: Standardized characterization of nanomaterials and validation of stem cell phenotype. (A) XRD spectra confirming the crystalline phase and structural integrity of the nanoparticles. (B) Representative TEM images demonstrating the nanoscale particle size, morphology, and homogeneous dispersion of the synthesized biomaterials; comparing NeoMTA2 and hydroxyapatite. Low-magnification views are shown for (a) NeoMTA2 and (b) hydroxyapatite, while high-magnification views are detailed in (c) NeoMTA2 and (d) hydroxyapatite. Scale bars are shown in the lower-Left corner. (C) Flow cytometric gating protocol for stem cells characterization. Representative multiparametric dot plots show cells stained for CD44, CD73 (labeled CD43 PE in the original plots), and CD45. The CD44+ and CD73+ subpopulations were gated corresponding to CD45 expression. Panel A and C are adapted from Zaki et al.8 (CC BY-NC-SA) and Panel B adapted from Habib et al.10 (CC BY-NC). Please click here to view a larger version of this figure.
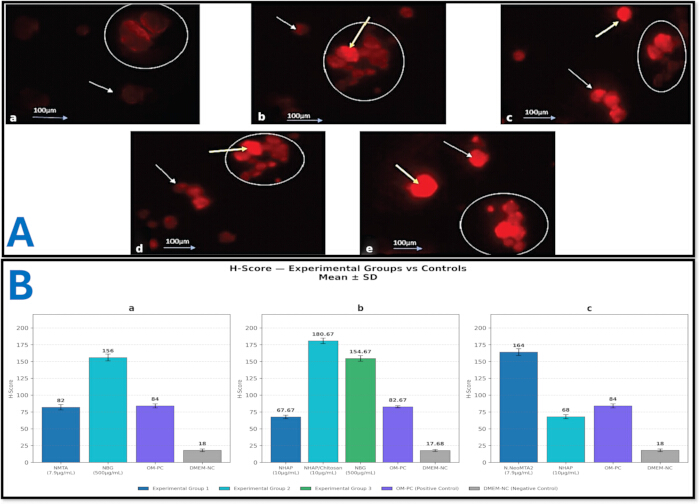
Figure 2: Quantitative and semi-quantitative assessment of osteogenic differentiation via RANKL immunofluorescence. (A) Representative high-resolution immunofluorescence micrographs capturing the expression of critical osteogenic protein markers RANKL within the 2D scaffold microenvironment (a) Negative control cells form small colonies with faint, membranous RANKL expression, whereas (b) positive control cells show an increased number of osteoblast-like colonies with dense, homogenous expression. Stem cells treated with (c) NHAP, (d) NHAP/chitosan, and (e) bioactive glass nanoparticles display advanced differentiation, characterized by large, merged osteoblast-like colonies with intense, homogenous RANKL localization in both the membrane and nucleus; adapted from: Elshahat et al.4. (B) Bar charts representing H-score quantification of RANKL expression across the different studies. Application of the H-score methodology for normalizing immunofluorescence data. By mathematically integrating the visual staining intensity (graded 0–3) with the percentage of positively stained cells, the H-score translates qualitative microscopy into a robust, semi-quantitative metric, significantly reducing subjective observer bias. (a) Comparison of Nano-NeoMTA2 (7.9 µg/mL) and bioactive glass nanoparticles (NBG; 500 µg/mL) against osteogenic medium positive control (OM-PC) and DMEM negative control (DMEM-NC). NBG elicited the highest expression profile (p < 0.001). Adapted from Abdelaziz et al. 9 (CC BY-NC-ND 4.0). (b) Evaluation of nanohydroxyapatite (NHAP; 10µg/mL), NHAP/Chitosan composite (10 µg/mL), and NBG (500 µg/mL) relative to controls, with NHAP/Chitosan displaying peak H-scores. Adapted from Elshahat et al.4 (CC BY 4.0). (c) Assessment of Nano- NeoMTA2 (7.9 µg/mL) versus NHAP (10 µg/mL) and controls, demonstrating significantly elevated RANKL expression in the Nano-NeoMT adapted from: Zaki et al.8. Please click here to view a larger version of this figure.
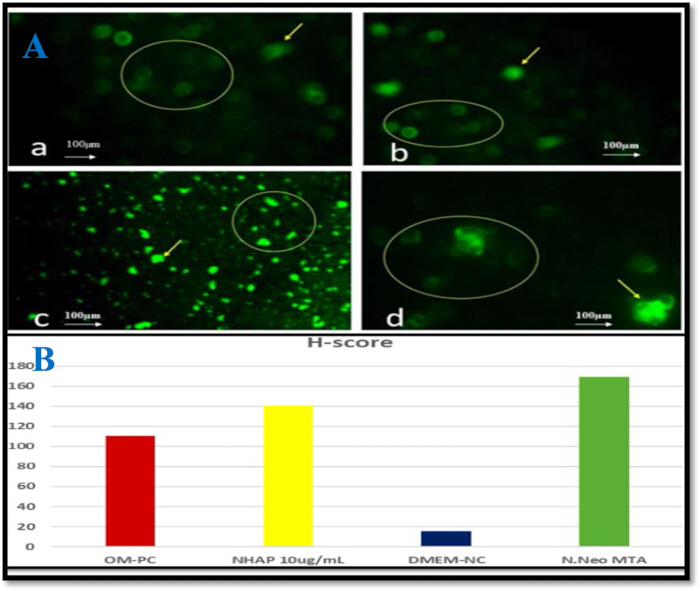
Figure 3: Representative Immunofluorescence Images and H-Score Analysis. (A) Immunofluorescence microscopy evaluation of Dentin Matrix Protein (DMP-1) expression across experimental groups; Green fluorescence indicates positive staining for polyclonal anti- DMP-1 antibodies. (a) Negative Control: Human dental pulp stem cells (hDPSCs) in undifferentiated medium (UM) display minor cell aggregates with faint, uniform DMP-1 expression (+). (b) Positive Control: hDPSCs in odontogenic medium (OM) demonstrate an expansion of colonies marked by dense, homogeneous DMP-1 signals (++). (c) Nanohydroxyapatite (10 μg/mL) and (d) Nano-NeoMTA2 (9.92 μg/mL): Differentiated hDPSCs form large, merged colonies of odontoblast-like cells exhibiting robust, homogeneous DMP-1 expression localized to the membranes and nuclei. Magnification: ×10. Yellow circles indicate odontoblast-like colonies; yellow arrows denote intense DMP-1 expression. (B) Bar chart representing H-score quantification of Dentin Matrix Protein expression across the study groups. A highly significant difference was observed between the evaluation groups, with the highest H-score observed in the Nano-NeoMTA2 cohort (169.33 ± 4.04), followed by nanohydroxyapatite (140.33 ± 2.52) and the negative control (15.33 ± 1.53). Panels A and B adapted from Habib et al.10 (CC BY-NC). Please click here to view a larger version of this figure.
| Assay / Parameter | Nanomaterial / Cell Type | Representative Value (Mean ± SD) | Normalization | Source |
| Cell Viability (MTT Assay) | ||||
| MTT Viability | Nano-NeoMTA2 (7.9 µg/mL) / SCAPs | ~196% (OD = 1.56 ± 0.24) | Normalized to untreated control (DMEM-NC = 100%) | Abdelaziz et al.⁹ |
| MTT Viability | Chitosan-nHA (10 µg/mL) / SCAPs | ~99.97% | Normalized to untreated control (DMEM-NC = 100%) | Elshahat et al.⁴ |
| MTT Viability — Positive Control | OM-PC / SCAPs | 113.46% (OD = 0.93 ± 0.03) | Normalized to untreated control (DMEM-NC = 100%) | Abdelaziz et al.⁹ |
| MTT Viability — Negative Control | DMEM-NC / SCAPs | 100% (OD = 0.82 ± 0.02) — Reference baseline | DMEM-NC defined as 100% reference for all groups | Abdelaziz et al.⁹ |
| Alkaline Phosphatase (ALP) Activity | ||||
| ALP Activity | Bioactive Glass Nanoparticles (500 µg/mL) / SCAPs | 69.86 ± 0.98 U/L | Normalized to total protein content (U/mg protein, Bradford/BCA assay) | Abdelaziz et al.⁹ |
| ALP Activity — Positive Control | OM-PC / SCAPs | 77.68 ± 1.28 U/L | Normalized to total protein content (U/mg protein, Bradford/BCA assay) | Abdelaziz et al.⁹ |
| ALP Activity — Negative Control | DMEM-NC / SCAPs | 55.81 ± 1.6 U/L | Normalized to total protein content (U/mg protein, Bradford/BCA assay) | Abdelaziz et al.⁹ |
| Safe Material Concentration (EC₅₀) | ||||
| EC₅₀ (SCAPs) | Nano-NeoMTA2 / SCAPs | 7.9 µg/mL | Four-parameter logistic model (non-linear sigmoidal dose–response, GraphPad Prism 9) | Zaki et al.⁸ |
| EC₅₀ (DPSCs) | Nano-NeoMTA2 / DPSCs | 9.92 µg/mL | Four-parameter logistic model (non-linear sigmoidal dose–response, GraphPad Prism 9) | Habib et al.10 |
| H-Score — RANKL Protein Expression (Osteogenic Marker) | ||||
| H-Score (RANKL) Osteogenic marker | Nano-NeoMTA2 (7.9 µg/mL) / SCAPs | 164 ± 4 (scale 0–300) | Total visible cell count per field (phase contrast microscopy) | Zaki et al.⁸ |
| H-Score (RANKL) Osteogenic marker | nHA (10 µg/mL) / SCAPs | 68 ± 3 (scale 0–300) | Total visible cell count per field (phase contrast microscopy) | Zaki et al.⁸ |
| H-Score (RANKL) Positive Control | OM-PC / SCAPs | 84 ± 1 (scale 0–300) | Total visible cell count per field (phase contrast microscopy) | Zaki et al.⁸ |
| H-Score (RANKL) Negative Control | DMEM-NC / SCAPs | 18 ± 1 (scale 0–300) | Total visible cell count per field (phase contrast microscopy) | Zaki et al.⁸ |
| H-Score — DMP-1 Protein Expression (Odontogenic Marker) | ||||
| H-Score (DMP-1) Odontogenic marker | Nano-NeoMTA2 (9.92 µg/mL) / DPSCs | 169.33 ± 4.04 (scale 0–300) | Total visible cell count per field (phase contrast microscopy) | Habib et al.10 |
| H-Score (DMP-1) Odontogenic marker | nHA (10 µg/mL) / DPSCs | 140.33 ± 2.52 (scale 0–300) | Total visible cell count per field (phase contrast microscopy) | Habib et al.10 |
| H-Score (DMP-1) Negative Control | DMEM-NC / DPSCs | 15.33 ± 1.53 (scale 0–300) | Total visible cell count per field (phase contrast microscopy) | Habib et al.10 |
| H-score (DMP-1) Odontogenic marker [Positive Control -OM-PC] | OM-PC / DPSCs | ~103 H-score (scale 0–300) | Total cell count per field (phase contrast microscopy) | Habib et al. Eur Endod J, 202610 |
| H-score = Σ(i × Pi): i = staining intensity (1, 2, or 3); Pi = percentage of cells at each intensity level (0–100%); range 0–300. MTT viability expressed relative to DMEM-NC set as 100% reference. ALP activity expressed as U/L from enzymatic dephosphorylation of p-nitrophenyl phosphate; further normalized to total protein content (U/mg protein). OM-PC = osteogenic/odontogenic induction medium (positive control). DMEM-NC = Dulbecco’s Modified Eagle Medium (negative control). | ||||
Table 1: Representative results from the standardized in vitro evaluation workflow. Representative quantitative outcomes from previously published studies demonstrating cell proliferation, alkaline phosphatase activity, and immunofluorescence analyses performed using the standardized protocol.
| Observed problem | Potential cause | Recommended solution |
| Low cell viability in MTT assay (OD < untreated control) | Nanomaterial concentration exceeds EC₅₀, or insufficient UV sterilization, or inadequate nanoparticle dispersion. | Re-run EC₅₀ determination (Section 4). Extend UV sterilization to 30 min. Verify homogeneous nanoparticle suspension by probe sonication (40 W, 30 s on/off, 3 cycles at 4 °C) immediately before use. |
| MTT viability CV >15% across replicates | Pipetting error, uneven cell seeding, or variable MTT incubation time/temperature. | Use a calibrated multichannel pipette for all additions. Confirm seeding density by hemocytometer before plating. Maintain strict 4 h incubation at 37 °C in a humidified CO₂ incubator. Include a blank well for background correction. |
| Inconsistent ALP absorbance readings (CV >20% across wells) | Uneven cell seeding density, incomplete cell lysis, or pipetting inconsistency during substrate addition. | Adhere strictly to 1 × 10⁴ cells/well in 24-well plates. Vortex lysis buffer thoroughly before use. Maintain consistent lysis incubation (10 min, 4 °C, gentle rocking). Check background absorbance with a no-cell blank well. |
| Weak or absent RANKL immunofluorescence signal (step 5.4a) | Antibody inactivation from improper storage, over-fixation reducing epitope accessibility, or insufficient permeabilization. | Prepare fresh 4% formaldehyde immediately before use. Add 0.1% Triton X-100 permeabilization (10 min, RT) before blocking. Titrate primary antibody dilution (start at 1:200). Include a positive control tissue section. Aliquot antibody stock to avoid repeated freeze-thaw cycles. |
| Weak or absent DMP-1 immunofluorescence signal (step 5.4b) | Antibody inactivation from freeze-thaw cycling, suboptimal primary antibody dilution, or incompatible secondary antibody host species. | Aliquot anti-DMP-1 antibody to avoid freeze-thaw cycles. Titrate dilution starting at 1:200. Confirm host species compatibility between primary (DMP-1) and secondary antibody. Include a dentin tissue section as a positive control for DMP-1. |
| Cross-reactivity between RANKL and DMP-1 fluorescence channels | Spectral overlap in emission spectra if the same fluorochrome is used for both secondary antibodies, or inadequate channel separation on the fluorescence microscope. | Use spectrally distinct secondary antibody fluorochromes for RANKL and DMP-1 (e.g., Alexa Fluor 488 for one marker, Alexa Fluor 594 for the other). Review secondary-only control images for each channel independently before scoring. Acquire RANKL and DMP-1 images separately using sequential acquisition mode. |
| High non-specific background in immunofluorescence staining | Insufficient protein blocking, secondary antibody concentration too high, or inadequate washing steps between incubations. | Extend blocking incubation to 2 h at RT. Increase secondary antibody dilution to 1:1000. Confirm specificity with the secondary-only control (no primary antibody). Ensure all PBS washes are complete (3 × 5 min each). |
| H-score inter-observer variability (Cohen’s kappa <0.7, step 5.6) | Inconsistent application of the four-tier staining intensity scale (0, 1+, 2+, 3+) between observers, or insufficient calibration before scoring sessions. | Conduct a joint calibration session using representative training images before formal scoring. Use identical image display settings (brightness, contrast) for all observers. Score a minimum of five high-power fields per well and calculate kappa after every 10 fields to monitor drift. |
| EC₅₀ curve does not converge or fit is poor (step 4.1) | Insufficient data points, narrow concentration range, or homogeneous suspension not achieved before seeding. | Expand the serial dilution range to include at least 6 concentrations spanning 50–1.56 µg/mL. Ensure probe sonication is performed immediately before each dilution step. Repeat with at least 3 independent biological replicates. Confirm CV <15% across replicates. |
Table 2: Critical parameters and troubleshooting guide. Common technical issues encountered during the protocol, their potential causes, and recommended solutions to improve experimental reproducibility and data quality. Abbreviations: CV = coefficient of variation; RT = room temperature.
Discussion
The critical steps in this protocol include accurate EC₅₀ determination, homogeneous nanomaterial suspension, and normalization of biological assay outputs. EC₅₀ calculation via non-linear regression (four-parameter logistic model) provides a more rigorous dose–response estimate than linear interpolation and should be preferred when sufficient data points are available13,14. Ensuring a homogeneous nanoparticle suspension by probe sonication immediately before cell exposure is critical; poorly dispersed suspensions yield unreliable dose-response curves and confound EC₅₀ estimates. For novel materials such as NeoMTA2, milling to the nanoscale is an essential first step since bulk particle size substantially alters surface reactivity and subsequent bioactivity13,14. If low cell viability is observed at concentrations expected to be safe, investigators should verify the UV sterilization protocol and re-examine the milling and dispersion procedures before repeating the EC₅₀ assay10.
A cornerstone of this protocol is the use of two complementary immunofluorescence markers that reflect distinct yet overlapping differentiation pathways. RANKL upregulation on osteoblast-like cells reflects calcium ion-driven osteogenic signaling and is proportional to the number of osteogenic cells8,9, while DMP-1 expression serves as a specific indicator of odontoblast-like differentiation and dentinogenic activity, making it particularly relevant when the target cell population is DPSCs10. By quantifying both markers using H-score methodology, this protocol enables investigators to distinguish osteogenic from odontogenic lineage commitment within a single standardized assay system, an advancement over single-marker approaches that cannot differentiate between bone-forming and dentin-forming commitment. Both RANKL and DMP-1 H-scores should be reported in all publications using this protocol to maintain comparability across studies. Investigators should use spectrally distinct fluorochromes for the two secondary antibodies to prevent channel overlap and must review secondary-only control images before scoring.
Several methodological modifications may be required when adapting this protocol to alternative biomaterials or cell models. For highly opaque or colored scaffolds, interference with MTT absorbance at 570 nm may necessitate an alternative viability assay, such as CellTiter-Glo (luminescence) or PrestoBlue (resazurin reduction), which are less susceptible to optical interference from scaffold materials. Researchers using SCAPs rather than DPSCs should note that SCAPs tend to show stronger RANKL expression, reflecting their greater osteogenic commitment, while DPSCs demonstrate more pronounced DMP-1 expression, reflecting their stronger odontogenic/dentinogenic lineage bias. Passage number is a critical variable: cells beyond passage 6 should be avoided as they may exhibit reduced differentiation capacity and altered surface marker expression.
Limitations of this methodological framework include a short-term assessment window (72 h), which may not capture late-phase mineralization events that typically require 14–21 days. The absence of in vivo validation represents a significant translational gap. The use of H-score introduces potential observer variability; inter-observer reliability (Cohen's kappa) reported in Section 5.10 should be included in all published results.
This framework offers several advantages over existing single-endpoint approaches. Conventional osteogenic assays often rely solely on alizarin red staining or single-timepoint ALP activity. The integration of MTT viability screening, ALP activity quantification, and dual RANKL + DMP-1 immunofluorescence H-scoring within a single workflow provides a multi-parametric output that enables direct statistical comparison across scaffold types under identical experimental conditions. The normalization strategies described, ALP activity expressed per mg protein, MTT results as percentage of untreated control, and H-score normalized to total cell count per field, eliminate confounding from inter-well variability4,8.
Future studies may apply this methodology to evaluate the effects of biomaterials on inflammatory markers, angiogenic responses, or alternative stem cell models. The assay sequence is also adaptable to 3D scaffold formats. Ultimately, the adoption of this standardized framework across independent laboratories will facilitate meaningful meta-analytic comparisons of scaffold performance in preclinical regenerative dentistry research15.
Disclosures
The authors declare no conflicts of interest.
Materials
| Name | Company | Catalog Number | Comments |
|---|---|---|---|
| 24-well culture plates | Corning | 3527 | Used for ALP assays |
| 96-well plates | Corning | 3596 | Used for ALP absorbance readings and MTT assays |
| ALP assay kit | Abcam | ab83369 (or equivalent) | Used to measure alkaline phosphatase activity |
| ALP substrate buffer (2-amino-2-methyl-1-propanol) | Sigma-Aldrich | N/A | Used to initiate the ALP catalytic reaction |
| Ammonium hydroxide (NH4OH) | N/A | N/A | Used for pH adjustment during nanohydroxyapatite synthesis. CORROSIVE |
| Anti-DMP-1 primary antibody | N/A | N/A | Odontogenic marker; 1:200 dilution in blocking buffer; overnight at 4 °C |
| Anti-human CD44 antibody (CD44-FITC) | Beckman Coulter | N/A | Used for flow cytometry; mesenchymal stem cell positive marker |
| Anti-human CD45 antibody (CD45-PC5) | Beckman Coulter | N/A | Used for flow cytometry; hematopoietic lineage negative marker |
| Anti-human CD73 antibody (CD73-PE) | Beckman Coulter | N/A | Used for flow cytometry; mesenchymal stem cell positive marker |
| Autoclave (hydrothermal reactor) | Tuttnauer | N/A | Used for hydrothermal treatment of nanohydroxyapatite at 140 °C, 0.3 MPa |
| BCA Protein Assay Kit | Thermo Fisher Scientific | 23225 (or equivalent) | Used to determine total protein concentration for normalization of ALP activity |
| CO2 incubator | Thermo Fisher Scientific | N/A | Set to 37 °C and 5% CO2 for all cell culture steps |
| Collagenase Type I | Sigma-Aldrich | C0130 | Used for enzymatic digestion of dental tissues during stem cell isolation |
| DMEM (Dulbecco's Modified Eagle Medium) | Gibco (Thermo Fisher Scientific) | 11965-092 | Basal culture medium; also used as negative control group |
| Fetal bovine serum (FBS) | Gibco (Thermo Fisher Scientific) | 10270-106 | Supplement for complete culture medium; MSC-qualified FBS used for differentiation medium |
| Flow cytometer (Navios) | Beckman Coulter | Navios | Used for stem cell immunophenotyping |
| Flow cytometry analysis software (Navios) | Beckman Coulter | N/A | Used for gating and data analysis of flow cytometry panels |
| Fluorescence microscope | Labomed / NY Microscope Company | 9126000 | Used for immunofluorescence imaging and H-score scoring |
| Freeze dryer (lyophilizer) | Labconco | N/A | Used to dry nanomaterial precipitates at −50 °C |
| Goat anti-rabbit IgG secondary antibody (Alexa Fluor 488) | Invitrogen | A-11034 | Fluorescent secondary antibody; 1:500 dilution; 1 h at room temperature |
| Goat anti-rabbit IgG secondary antibody (Alexa Fluor 594) | Invitrogen (or equivalent) | A-11012 (or equivalent) | Spectrally distinct secondary antibody used for DMP-1 immunofluorescence when multiplex staining is performed |
| GraphPad Prism software | GraphPad Software | Version 9 | Used for EC50 calculation and statistical analysis |
| Hemocytometer | Neubauer | N/A | Used for manual cell counting and total cell count for H-score normalization |
| Inverted phase-contrast microscope | Olympus | N/A | Used for daily monitoring of cell growth and morphology |
| Mounting medium, antifade (ProLong Gold) | Invitrogen | P36930 | Used for slide mounting after immunofluorescence staining |
| MTT reagent | Invitrogen | M6494 | Used to assess cell metabolic activity; 0.5 mg/mL, 4 h at 37 °C |
| Nanohydroxyapatite (NHAP) | Nanogate, Cairo, Egypt | N/A | Synthesized by wet precipitation or sourced commercially; used at 10 µg/mL |
| NeoMTA2 powder | NuSmile Ltd. / Avalon Biomed | N/A | Starting material for Nano-NeoMTA2 preparation by planetary ball mill |
| Normal goat serum | N/A | N/A | Used for blocking (5% in PBS) before primary antibody application |
| Osteogenic/odontogenic differentiation medium | Gibco (Thermo Fisher Scientific) | N/A | Positive control medium; contains DMEM, FBS, ascorbate, beta-glycerophosphate, and dexamethasone |
| Paraformaldehyde (4%) | Sigma-Aldrich | P6148 | Used for cell fixation before immunofluorescence. TOXIC — use in fume hood |
| PBS (phosphate-buffered saline, pH 7.4) | Gibco (Thermo Fisher Scientific) | 10010-023 | Used for cell washing, antibody dilution, and nanomaterial suspension |
| Penicillin-streptomycin solution | Gibco (Thermo Fisher Scientific) | 15140-122 | Antibiotic supplement; used at 1% in complete culture medium |
| Planetary ball mill | Retsch (or equivalent) | PM 400 | Used for nanosizing NeoMTA2 powder; 350 rpm, 10 h |
| p-Nitrophenol standards | Sigma-Aldrich | N/A | Used to generate the ALP activity standard curve |
| Rabbit anti-RANKL primary antibody | Abcam | ab9957 | Osteogenic marker; 1:200 dilution; overnight at 4 °C |
| Rabbit IgG isotype control antibody | N/A | Negative control for immunofluorescence; matched concentration of primary antibody | |
| SDS-HCl solubilization solution | Sigma-Aldrich | N/A | Used to dissolve MTT formazan crystals. CORROSIVE |
| Six-well tissue culture plates | Corning | 3516 | Used for differentiation assays |
| Sodium hydroxide (NaOH), 0.5 M | Sigma-Aldrich (or equivalent) | N/A | Used to terminate the ALP reaction prior to absorbance measurement; CORROSIVE |
| Sonicator (probe / ultrasonic bath) | Branson Ultrasonics | N/A | Used for nanoparticle dispersion before biological assays |
| T-75 culture flasks | Corning | 430641 | Used for stem cell expansion |
| TEOS (tetraethyl orthosilicate) | N/A | N/A | Silica precursor for 45S5 bioactive glass sol-gel synthesis. FLAMMABLE |
| Transmission electron microscope | JEOL Ltd. | JEM-2100 | Used for nanomaterial size and morphology characterization |
| Triton X-100 (0.1% in PBS) | N/A | N/A | Used for cell permeabilization before immunofluorescence |
| Trypan blue solution (0.4%) | Sigma-Aldrich | T8154 | Used for cell viability assessment |
| X-ray diffractometer (X'PERT-PRO) | PANalytical | X'PERT-PRO | Used for crystallographic analysis of nanoparticles |
References
- Sui B et al. Dental pulp stem cells: from discovery to clinical application. J Endod. 2020;46(9 Suppl):S46-S55. doi:10.1016/j.joen.2020.06.027.
- Zhang W, Yelick PC. Vital pulp therapy: current progress of dental pulp regeneration and revascularization. Int J Dent. 2010;2010:856087. doi:10.1155/2010/856087.
- Zhang W et al. The performance of human dental pulp stem cells on different three-dimensional scaffold materials. Biomaterials. 2006;27(33):5658-68. doi:10.1016/j.biomaterials.2006.07.013.
- Elshahat S, Elgendy AA, Elsewify T. Osteogenic differentiation and proliferation of apical papilla stem cells using chitosan-coated nanohydroxyapatite and bioactive glass nanoparticles. Eur J Dent. 2024;18(2):665-71. doi:10.1055/s-0043-1777044.
- Huang M, Dissanayaka WL, Yiu CKY. Exploring the potential of stem cells from the apical papilla (SCAPs) in regenerative medicine: advantages, applications, challenges and opportunities. Stem Cell Res Ther. 2025;16(1):626. doi:10.1186/S13287-025-04705-8.
- Tran N, Webster TJ. Nanotechnology for bone materials. Wiley Interdiscip Rev Nanomed Nanobiotechnol. 2009;1(3):336-51. doi:10.1002/wnan.23.
- Ding F, Guo S, Pan G. Emerging biomimetic materials with micro/nanostructure-dependent biological effects. Rev Mater Res. 2025;1(2):100040. doi:10.1016/j.revmat.2025.100040.
- Zaki NT, El-Helbawy M, Mahran AH, Elsewefy T. Effect of Neo-MTA and hydroxyapatite nanoparticles on proliferation and osteogenic differentiation of apical papilla stem cells (SCAPs) (in vitro study). J Pharm Negat Results. 2023;14. doi:10.47750/pnr.2023.14.02.344.
- Abdelaziz H, Mahran AH, Elsewify T. Osteogenic differentiation and proliferation of apical papilla stem cells using nanoparticles of Neo MTA and bioactive glass. Saudi Dent J. 2024;36(1):134-39. doi:10.1016/j.sdentj.2023.10.018.
- Habib N, Elgendy A, Elsewify T, Yehia T. The effect of Nano-NeoMTA2 and nanohydroxyapatite on the human dental pulp stem cells odontogenic differentiation and proliferation. Eur Endod J. 2026;11(4):158-65. doi:10.65717/eej.2026.25165.
- Ferraz MP, Monteiro FJ, Manuel CM. Hydroxyapatite nanoparticles: a review of preparation methodologies. J Appl Biomater Biomech. 2004;2(2):74-80.
- Xu F, Li Y, Wang X, Wang J, Yang A. Preparation and characterization of nano-hydroxyapatite/poly(vinyl alcohol) hydrogel biocomposite. J Mater Sci. 2004;39:5669-72. doi:10.1023/B:JMSC.0000040074.64787.b3.
- Tanomaru-Filho M et al. Biocompatibility and mineralized nodule formation of Neo MTA Plus and an experimental tricalcium silicate cement containing tantalum oxide. Int Endod J. 2017;50(Suppl 2):e31-e39. doi:10.1111/iej.12780.
- Rodríguez-Lozano FJ et al. Biomineralization potential and biological properties of a new tantalum oxide (Ta2O5)-containing calcium silicate cement. Clin Oral Investig. 2022;26(2):1427-41. doi:10.1007/s00784-021-04117-x.
- Okajcekova T et al. A comparative in vitro analysis of the osteogenic potential of human dental pulp stem cells using various differentiation conditions. Int J Mol Sci. 2020;21(7). doi:10.3390/ijms21072280.