This protocol describes a standardized workflow for evaluating ischemic brain injury in patients with right-to-left shunt by integrating c-TCD shunt grading, brain MRI classification, echocardiographic anatomical phenotyping, and structured clinical data analysis.
Method Article
A Standardized Workflow for Multimodal Assessment of Right-to-Left Shunt–Related Ischemic Brain Injury
In This Article
Summary
Abstract
Right-to-left shunt (RLS) has been associated with cryptogenic stroke, migraine, and other neurological conditions in which ischemic brain injury may be clinically relevant. In routine practice, however, assessment is often fragmented. Shunt presence may be documented, but shunt burden, provoked versus non-provoked patterns, anatomical complexity, and MRI-defined brain injury are not always integrated into a reproducible workflow. Here, we describe a standardized protocol for multimodal assessment of RLS-related ischemic brain injury in a clinically selected cohort. The workflow includes patient screening, exclusion of major vascular and systemic factors that could independently contribute to brain parenchymal injury, contrast-enhanced transcranial Doppler ultrasound (c-TCD) confirmation and shunt grading, brain magnetic resonance imaging (MRI) classification, transthoracic and/or transesophageal echocardiographic anatomical assessment, structured data extraction, and dataset cleaning. To improve reproducibility, the protocol also standardizes key coding steps, including shunt-grade harmonization, classification of RLS as simple or complex, and interpretation of D-dimer values reported below the assay threshold. Using this workflow, a harmonized analytic cohort of 60 RLS-positive patients was established. MRI identified 23 MRI-negative and 37 MRI-positive patients. Representative analyses showed that MRI-positive findings were more frequent in patients with greater shunt burden and more complex anatomical phenotypes. This protocol provides an operational model for incorporating c-TCD, MRI, echocardiography, and structured clinical parameters into the evaluation of MRI-defined ischemic brain injury in RLS-positive patients. It should be interpreted as a workflow for standardized multimodal phenotyping rather than as a standalone physiologic assessment of all clinically significant or hypoxemia-related RLS.
Introduction
Right-to-left shunt (RLS) refers to an abnormal pathway by which venous blood bypasses the pulmonary circulation and enters the systemic arterial circulation. In clinical practice, RLS is most commonly associated with patent foramen ovale (PFO), although atrial septal defect (ASD), pulmonary arteriovenous fistula, and other structural shunt-related disorders may also contribute1,2. In recent years, RLS has been discussed not only in relation to cryptogenic stroke but also in migraine and other neurological conditions in which ischemic brain injury may be clinically relevant3,4,5. Thus, RLS is not always an incidental anatomical finding; in selected patients, it may represent a clinically meaningful neurovascular phenotype6.
In routine practice, RLS assessment is often performed as a set of partially independent tests. Contrast-enhanced transcranial Doppler ultrasound (c-TCD) is sensitive for confirming the presence and burden of a shunt, whereas transthoracic echocardiography (TTE) and/or transesophageal echocardiography (TEE) provide anatomical information such as PFO morphology, atrial septal aneurysm, ASD, and pulmonary arteriovenous fistula6,7,8,9. Brain MRI characterizes the presence and pattern of parenchymal injury in patients with suspected ischemic brain injury3,4. Existing approaches are useful, but patient eligibility, exclusion of competing causes of brain injury, shunt grade, provoked versus non-provoked shunt pattern, anatomical complexity, MRI-defined injury, and downstream data coding are not always handled within a single auditable protocol7,8,9,10,11. The main advantage of the present workflow is that it links these steps into a reproducible pipeline, allowing readers to trace how an RLS-positive patient is screened, phenotyped, coded, and analyzed.
The goal of this method article is therefore not only to compare MRI-positive and MRI-negative patients but to provide a reproducible route for evaluating MRI-defined ischemic brain injury in RLS-positive patients. The workflow starts with eligibility screening, continues through c-TCD confirmation and shunt grading, MRI classification, TTE and/or TEE anatomical assessment, structured data extraction, dataset cleaning, and representative statistical outputs, and ends with a harmonized analytic dataset9.
To improve reproducibility, the protocol standardizes decisions that are often handled inconsistently in retrospective clinical datasets. These include defining RLS positivity as Grade I–IV shunt on c-TCD, retaining the original four-level shunt grade while also dichotomizing shunt burden as Grade I versus Grade II–IV for the primary analysis, classifying MRI as negative or positive with additional subtypes, and distinguishing simple from complex RLS according to anatomical features. The workflow also specifies coding decisions that might otherwise introduce noise, including harmonization of non-standard shunt-grade symbols and the treatment of D-dimer values reported below the assay threshold.
This protocol is intended for clinically selected young-to-middle-aged patients with suspected RLS-related neurological manifestations, particularly patients aged 18–55 years who present with migraine, cryptogenic stroke, or both, and who have available c-TCD, brain MRI, and TTE and/or TEE data. It is most applicable to single-center or multicenter observational studies that aim to standardize multimodal phenotyping and risk-factor analysis in RLS-positive patients. The workflow is not intended to replace a comprehensive physiologic evaluation of all clinically important RLS, especially in patients whose main presentation is unexplained hypoxemia, orthodeoxia-platypnea, exertional desaturation, high-altitude symptoms, or sleep-disordered breathing.
Protocol
The procedures were performed in accordance with the Declaration of Helsinki and were approved by the Medical Ethics Committee of the Second Affiliated Hospital of Xiamen Medical College (Approval number: 2024095). Written informed consent was obtained from all participants.
1. Patient screening and cohort definition
- Identify patients who consulted the Second Affiliated Hospital of Xiamen Medical College between January 2022 and December 2023 because of migraine or cryptogenic stroke.
- Screen patients with suspected RLS using the electronic medical record system and clinical examination records.
- Apply the inclusion criteria
- Include patients aged 18–55 years.
- Include patients with RLS confirmed by contrast-enhanced transcranial Doppler ultrasound, defined as the presence of at least one microbubble signal in the monitored cerebral artery after contrast injection.
- Include patients with available brain magnetic resonance imaging (MRI) data.
- Include patients with available transthoracic echocardiography and/or transesophageal echocardiography data for anatomical assessment.
- Exclude patients with major vascular or systemic factors that may independently contribute to brain parenchymal injury, including hypertension, diabetes mellitus, smoking history, dyslipidemia, elevated homocysteine, obesity, infection, trauma, immune-related disease, metabolic disease, hereditary vascular disease, hematologic disease, tumor-related brain injury, or other clearly documented causes of brain parenchymal injury.
- Define the final analytic cohort as RLS-positive patients who meet all inclusion criteria and none of the exclusion criteria.
NOTE: This exclusion step is intended to reduce competing explanations for ischemic brain injury and to focus the protocol on RLS-related shunt volume, shunt type, anatomical complexity, and associated clinical variables. The final analytic cohort included 60 RLS-positive patients.
2. c-TCD confirmation and shunt grading
- Perform c-TCD using a dedicated 2 MHz transcranial Doppler ultrasound system.
- Before the examination, train each patient to perform a standardized Valsalva maneuver.
NOTE: Verify an adequate Valsalva maneuver by maintaining an expiratory pressure of at least 40 mmHg for approximately 10 s. - Place the patient in the supine position.
- Place 2 MHz probes over the temporal window to monitor the middle cerebral artery.
NOTE: Bilateral monitoring is preferred when both temporal windows are adequate; unilateral monitoring may be used when only one adequate temporal window is available. - Prepare the agitated saline contrast medium by mixing 1 mL of air, 1 mL of autologous venous blood, and 8 mL of sterile normal saline.
- Inject the contrast medium through antecubital venous access using a bolus technique.
- Observe and record microbubble signals in the middle cerebral artery within 10 s after injection.
- If microbubble signals are detected at rest, classify the patient as having non-Valsalva-induced RLS.
- If no microbubble signal is detected at rest, wait 10 min and repeat the contrast injection during the Valsalva maneuver.
- Inject the contrast medium approximately 5 s before the start of the maneuver, ask the patient to reach the target expiratory pressure of at least 40 mmHg and maintain the maneuver for approximately 10 s, and instruct the patient to release the strain on the examiner’s command.
- Observe and record microbubble signals during the first 10 s after release of the Valsalva maneuver.
NOTE: If the maneuver is inadequate, the target pressure is not reached, or release timing is poor, repeat the test after additional training and record this as a suboptimal acquisition. - Classify the patient as having Valsalva-induced RLS if microbubble signals are detected only during the Valsalva maneuver.
- Grade the right-to-left shunt (RLS) according to the number and pattern of microbubble signals detected on contrast-enhanced transcranial Doppler ultrasound (c-TCD), and record the corresponding shunt grade in the study dataset.
NOTE: Use the following grading criteria: Grade 0, no microbubble signal; Grade I, 1–10 microbubbles; Grade II, 11–25 microbubbles; Grade III, >25 microbubbles without a curtain pattern; Grade IV, curtain-like microbubble signal. - Include only RLS-positive patients, defined as patients with Grade I–IV shunt, in the final analytic cohort.
- Record the original four-level shunt grade as Grade I, Grade II, Grade III, or Grade IV.
- Dichotomize shunt volume for the primary analysis as Grade I versus Grade II–IV.
NOTE: Before coding, harmonize non-standard Roman numerals and symbols to Grades I–IV.
3. Brain MRI acquisition and outcome classification
- Perform brain MRI using a clinical 3.0T MRI scanner, equipped with a standard head coil.
- Acquire the institutional routine brain MRI protocol for ischemic or vascular brain injury.
NOTE: Acquire T1WI, T2WI, FLAIR, DWI, and TOF-MRA using the sequence parameters listed in Supplementary Table 1. - Ask two imaging specialists to independently review the MRI scans.
- Classify patients as MRI-negative if no focal parenchymal lesion compatible with ischemic brain injury is identified on DWI, FLAIR, T2WI, or MRA.
- Classify patients as MRI-positive when at least one lesion is identified as ischemic brain injury by the two imaging specialists after exclusion of non-ischemic mimics such as tumor, infection, demyelination, trauma, and major vascular malformation.
- Further classify MRI-positive findings into the following subtypes:
- Classify findings as cerebral infarction if they show an acute or subacute focal lesion with diffusion-weighted imaging (DWI) hyperintensity and corresponding apparent diffusion coefficient (ADC) reduction, with or without fluid-attenuated inversion recovery (FLAIR) or T2-weighted imaging (T2WI) hyperintensity, or if they show a chronic ischemic lesion with encephalomalacia, gliosis, or a lacunar, cortical, or subcortical defect in a vascular distribution.
- Classify findings as a white matter lesion if they show focal or patchy FLAIR/T2WI hyperintensity in the periventricular or deep white matter that is judged by the two reviewers to represent ischemic or small-vessel-type injury using established neuroimaging terminology.
- Classify findings as other MRI-positive ischemic findings if they show ischemic-appearing abnormalities that do not meet the criteria for cerebral infarction or white matter lesion but are considered clinically relevant by consensus review.
- Resolve disagreements by consensus review. If consensus cannot be reached, invite a third senior imaging specialist.
NOTE: Record the consensus MRI classification and MRI-positive subtype in the study dataset.
4. TTE and/or TEE anatomical assessment of RLS
- Review the original TTE and/or TEE reports and, when available, the stored image clips for anatomical characterization of RLS.
- Identify the anatomical source of RLS, including patent foramen ovale (PFO), atrial septal defect (ASD), pulmonary arteriovenous fistula, or other documented shunt-related structural abnormalities.
- Measure or extract the patent foramen ovale (PFO) tunnel length and width primarily using transesophageal echocardiography (TEE).
- Measure three orthogonal PFO diameters when three-dimensional (3D) TEE is available to obtain additional anatomical information.
- Measure the PFO tunnel length and width on the bicaval view of the interatrial septum during routine two-dimensional TEE whenever the tunnel is clearly visualized. Use the view that best displays the PFO tunnel if the bicaval view is inadequate.
- Perform right-heart contrast echocardiography if transthoracic echocardiography (TTE) findings are inconclusive. Reserve TEE for pre-procedural confirmation because it is an invasive examination.
- Measure or extract septum secundum thickness at the thickest portion adjacent to the fossa ovalis on the optimized interatrial septal view.
- Classify an atrial septal aneurysm as septal excursion ≥10 mm toward either atrium or combined bilateral excursion ≥15 mm.
- Record atrial septal aneurysm, Chiari network, prominent Eustachian/inferior vena cava valve, concurrent ASD, and pulmonary arteriovenous fistula according to the original echocardiography report and image review. If the interpreting physician is uncertain about the measurement, obtain a consensus review by another experienced echocardiography physician.
- Extract left atrial and right atrial size indices when available, including left atrial diameter or volume index and right atrial area or volume. Code atrial enlargement according to the local echocardiography reference range or an established chamber-quantification guideline. If atrial size is not reported or cannot be measured reliably from stored images, code the variable as unavailable rather than normal.
NOTE: In the present retrospective dataset, positional and nocturnal left- and right-atrial dimensions were not routinely assessed. - Classify RLS as simple RLS if it is caused solely by PFO and all of the following criteria are met: PFO tunnel length <8 mm, absence of atrial septal aneurysm, absence of an overgrown Eustachian/inferior vena cava valve, absence of Chiari network, septum secundum thickness ≤10 mm, and absence of concurrent ASD.
- Classify RLS as complex RLS if any criterion for simple RLS is not met, or if the shunt is caused by complex PFO, ASD, or pulmonary arteriovenous fistula.
NOTE: For descriptive clinical reporting, a PFO tunnel length >10 mm may also be described as a long tunnel PFO, according to local echocardiography practice. - Extract and record specific complex anatomical features when available, including complex PFO, PFO tunnel length ≥8 mm, long-tunnel PFO, atrial septal aneurysm, ASD, Chiari network, Eustachian/inferior vena cava valve abnormality, septum secundum hypertrophy, pulmonary arteriovenous fistula, and atrial enlargement.
NOTE: Anatomical assessment should be described as “TTE and/or TEE” rather than “TTE and TEE” unless every patient underwent both examinations. In the cleaned analytic dataset, anatomical classification identified 40 patients with simple RLS and 20 patients with complex RLS.
5. Clinical data extraction and dataset cleaning
- Extract demographic characteristics from the electronic medical record system, including age, sex, height, weight, body surface area, and body mass index.
- Extract clinical presentation and classify patients as having migraine, cryptogenic stroke, or migraine combined with stroke.
- Extract medical history and medication-related variables, including anxiety or depression, treatment for anxiety or depression, family history of migraine, medication for migraine, oral contraceptive use, and other relevant comorbidities.
- Extract laboratory indicators, including D-dimer, C-reactive protein (CRP), and high-sensitivity C-reactive protein (hsCRP).
- Extract oxygenation parameters, including baseline SpO2 and SpO2 after activity. When available, also extract standardized supine/upright positional SpO2, exertional SpO2, arterial blood gas results, alveolar-arterial oxygen gradient, and formal shunt-study results.
- Extract sleep-related variables when available, including history of obstructive sleep apnea, polysomnography results, nocturnal oximetry, or clinically documented nocturnal hypoxemia.
- Extract echocardiographic variables, including tricuspid regurgitation, atrial arrhythmia, main pulmonary artery diameter, left atrial size, right atrial size, and atrial enlargement when available.
- Define abnormal inflammatory markers as CRP > 6 mg/L or hsCRP > 0.2 mg/L.
- Classify D-dimer as increased when the value exceeds the upper limit of the local laboratory reference range.
- Code D-dimer values reported as "<0.10 mg/L" as not increased.
- Remove empty rows, explanatory notes, and non-patient records from the analytic dataset.
- Standardize sex as male or female.
- Standardize clinical presentation as migraine, cryptogenic stroke, or migraine combined with stroke.
- Standardize shunt grade as Grade I, Grade II, Grade III, or Grade IV.
- Dichotomize shunt volume as Grade I versus Grade II–IV.
- Standardize shunt type as Valsalva-induced or non-Valsalva-induced RLS.
- Code MRI outcome as MRI-negative or MRI-positive.
- Standardize MRI-positive subtype as cerebral infarction, white matter lesion, or other MRI-positive ischemic findings.
- Standardize the anatomical type as either simple or complex RLS.
- Extract PFO length from the original echocardiography report. Code PFO length ≥8 mm as complex RLS even when the original report does not explicitly state “complex PFO.”
- Generate a combined right-to-left shunt (RLS) phenotype variable by combining the anatomical classification with the shunt grade, and record the phenotype for each patient.
NOTE: Classify patients as Simple RLS + Grade I, Simple RLS + Grade II–IV, Complex RLS + Grade I, or Complex RLS + Grade II–IV. - Generate an audit table to verify the availability of key variables, including MRI outcome, shunt grade, shunt type, anatomical type, combined RLS phenotype, D-dimer status, SpO2, and main pulmonary artery diameter.
NOTE: Code values below the assay reporting threshold are not increased, and code-unavailable measurements are considered missing rather than normal.
6. Statistical analysis and sensitivity analysis
- Perform all statistical analyses using the statistical software.
- Use the routine statistical package for descriptive statistics and group comparisons.
- Use the statistical computing environment for data cleaning, visualization, logistic regression, Firth penalized logistic regression, receiver operating characteristic analysis, and calibration assessment.
- Divide patients into MRI-negative and MRI-positive groups according to brain MRI findings.
- Express categorical variables as n (%).
- Assess the distribution of continuous variables.
- Express normally distributed continuous variables as mean ± standard deviation.
- Express non-normally distributed continuous variables as median (Q1, Q3).
- Compare categorical variables between MRI-negative and MRI-positive groups using the χ2 test or Fisher’s exact test, as appropriate.
- Compare continuous variables between MRI-negative and MRI-positive groups using the independent-samples t-test or Mann–Whitney U test, as appropriate.
- Perform univariable logistic regression to identify candidate factors associated with MRI-positive ischemic brain injury.
- Report odds ratios, 95% confidence intervals, and P values for each candidate variable.
- Consider variables with P < 0.10 in univariable analysis and clinically relevant variables for multivariable logistic regression.
- Fit the main multivariable logistic regression model using MRI-positive ischemic brain injury as the dependent variable. Use complete-case analysis for the main model.
NOTE: In the present dataset, all 60 patients had complete data for the MRI outcome and the five prespecified independent variables—age, Grade II–IV shunt, complex RLS, increased D-dimer, and main pulmonary artery diameter. Thus, all 60 patients were included in the model; no observations were excluded due to missing data, and no imputation was performed. - Include the predefined independent variables in the main multivariable logistic regression model.
NOTE: Enter age, Grade II–IV shunt, complex right-to-left shunt (RLS), increased D-dimer, and main pulmonary artery diameter as independent variables. - Report adjusted odds ratios, 95% confidence intervals, and P values.
- Perform Firth penalized logistic regression using the same dependent variable and the same core independent variables as the main multivariable logistic regression model.
- Use Firth-penalized logistic regression as a sensitivity analysis to account for the limited sample size and sparse data in certain categorical combinations.
- Perform exploratory discrimination analysis using receiver operating characteristic curves.
- Compare the performance of the predefined logistic regression models using receiver operating characteristic analysis.
NOTE: Evaluate an age-only model, an RLS-feature model including shunt volume and anatomical type, and a combined model including age, Grade II–IV shunt, complex RLS, increased D-dimer, and main pulmonary artery diameter. - Report the area under the curve, 95% confidence interval, sensitivity, specificity, and Youden index.
- Assess model calibration using a calibration plot and the Brier score.
- Interpret two-sided P values < 0.05 as statistically significant.
NOTE: Treat the regression, ROC, and calibration analyses as exploratory outputs rather than causal or externally validated prediction models.
7. Generation of representative outputs
- Generate a study workflow figure showing patient eligibility, screening criteria, exclusion of major vascular and systemic risk factors, final analytic cohort, c-TCD confirmation, MRI classification, anatomical assessment, data extraction, data cleaning, statistical analysis, and representative outputs.
- Generate a representative multimodal imaging figure that illustrates the key imaging findings used in the workflow.
NOTE: Include representative images of an MRI-negative case, an MRI-positive case with cerebral infarction, an MRI-positive case with a white matter lesion, a Grade I c-TCD small-shunt pattern, a Grade IV c-TCD large-shunt pattern, a simple patent foramen ovale (PFO) on transthoracic or transesophageal echocardiography (TTE/TEE), and a complex right-to-left shunt (RLS) on TTE/TEE. - Generate an alluvial plot showing patient flow across anatomical type, shunt grade, and MRI outcome.
- Generate a bar chart showing MRI-positive rates across combined RLS phenotype categories.
- Generate a violin-box plot showing age distribution stratified by MRI outcome.
- Generate a forest plot showing the results of the multivariable logistic regression model.
- Generate ROC and calibration plots for exploratory model performance.
- Prepare Table 1 to summarize baseline and clinical characteristics stratified by MRI outcome.
- Prepare Table 2 to summarize RLS phenotype distribution and MRI-positive rate.
- Prepare Table 3 to summarize univariable logistic regression, multivariable logistic regression, and Firth penalized logistic regression.
- Export all figures and tables at publication quality with consistent terminology, group labels, sample-size notation, and denominators.
NOTE: Before export, verify that figure numbers, panel labels, sample sizes, terminology, and denominators agree with the corresponding legends and tables.
Results
The flowchart in Figure 1 illustrates the overall workflow for evaluating ischemic brain injury associated with RLS. Following the screening of patients with migraine or cryptogenic stroke, and the exclusion of significant vascular and systemic factors that might have contributed independently to brain parenchymal injury, 60 RLS-positive patients were selected into the final analytic group. Brain MRI classification was used to categorize 23 patients as MRI-negative and 37 as MRI-positive. On anatomical examination, 40 patients had simple RLS, whereas 20 had complex RLS. Shunt grading also revealed 27 Grade I, 9 Grade II, 15 Grade III, and 9 Grade IV. Taken together, these data indicate that the protocol can generate a systematically characterized cohort with standardized c-TCD, MRI, and echocardiographic data for phenotype-level analysis and regression modeling.
Multimodal results of interest are presented in Figure 2. The MRI images contain one MRI negative case that has no well-defined ischemic brain injury, one MRI positive case involving cerebral infarction, and one MRI positive case involving a white matter lesion. The c-TCD recordings demonstrate a small-shunt pattern as well as a large-shunt pattern, and the echocardiographic pictures show typical simple PFO and complex RLS phenotypes. In the cleaned analytic dataset (Table 2), the MRI-positive group comprised 17 patients with cerebral infarction, 17 with white matter lesions, and 3 with other MRI-positive ischemic findings. These example images illustrate how MRI classification, shunt grading, and anatomical phenotyping were defined prior to the formal statistical analysis.
The workflow also generated interpretable negative or lower-burden findings. The MRI-negative example in Figure 2A illustrates the expected negative neuroimaging output, and the small-shunt c-TCD example in Figure 2D illustrates a low-burden positive result. During screening, patients with no microbubble signal at rest or during an adequate Valsalva maneuver would be classified as Grade 0 and excluded from the RLS-positive analytic cohort. Suboptimal c-TCD acquisitions may occur when the Valsalva maneuver is poorly timed, when the patient cannot maintain adequate pressure, or when the temporal acoustic window is insufficient; in such cases, the maneuver should be retrained or repeated, and the acquisition should be flagged during data cleaning. In clinical practice, an initial non-diagnostic MRI scan may also be performed and should be repeated until interpretable; unsuccessful initial MRI images were not retained in this retrospective dataset and are therefore not shown in the representative figure.
Figure 3 shows the distribution of RLS phenotypes across MRI outcomes. In Figure 3A, the alluvial plot illustrates the flow of patients from anatomical type to shunt grade and then to MRI outcome. In Figure 3B, the bar chart shows the MRI-positive rate across combined RLS phenotype categories. MRI-positive findings were concentrated mainly in the complex RLS group with Grade II–IV shunt. More specifically, MRI-positive rates were 40.0% for simple RLS with Grade I shunt, 60.0% for simple RLS with Grade II–IV shunt, 50.0% for complex RLS with Grade I shunt, and 94.4% for complex RLS with Grade II–IV shunt. This pattern suggests that considering anatomical complexity alongside shunt burden may provide a more informative description of the risk of RLS-related ischemic brain injury than either feature alone.
Baseline and clinical characteristics stratified by MRI outcome are summarized in Table 1. Compared with the MRI-negative group, patients in the MRI-positive group were older, more frequently had Grade II–IV shunts, and more often showed complex RLS. Abnormal D-dimer results were also more common in the MRI-positive group, and the main pulmonary artery diameter tended to be larger. For example, the median age was 41 years in the MRI-positive group and 28 years in the MRI-negative group. Grade II–IV shunts were present in 70.3% versus 30.4% of patients, complex RLS in 48.6% versus 8.7%, and abnormal D-dimer in 37.8% versus 4.3%. Median main pulmonary artery diameter was 21 mm in the MRI-positive group and 20 mm in the MRI-negative group. Overall, the descriptive comparisons pointed in the same direction as the later regression results. Baseline SpO2 and post-activity SpO2 were extracted when available and are summarized in Table 1. These measurements did not differ significantly between MRI-negative and MRI-positive groups in the current cohort. However, formal arterial blood gas analysis, alveolar-arterial oxygen gradient, standardized positional oximetry, nocturnal oximetry, and polysomnography-based OSA assessment were not uniformly available in the retrospective dataset and were therefore excluded from the main model.
The independent factors associated with MRI-positive brain injury are presented in Figure 4 and Table 3. In univariable logistic regression, older age, Grade II–IV shunt, complex RLS, abnormal D-dimer, and a larger main pulmonary artery diameter were all associated with MRI-positive ischemic brain injury. After multivariable adjustment, age (OR = 1.154, 95% CI: 1.055–1.302, P = 0.006), Grade II–IV shunt (OR = 5.810, 95% CI: 1.112–39.747, P = 0.048), complex RLS (OR = 19.774, 95% CI: 2.344–303.428, P = 0.014), and abnormal D-dimer (OR = 16.653, 95% CI: 1.554–452.258, P = 0.039) remained independently associated with MRI-positive brain injury. By contrast, the main pulmonary artery diameter was no longer significant after adjustment (OR = 1.032, 95% CI: 0.535–2.033, P = 0.925). Because the sample size was limited and some phenotype categories were sparse, Firth penalized logistic regression was further used as a sensitivity analysis. In that model, age, complex RLS, and abnormal D-dimer remained significant, whereas Grade II–IV shunt showed borderline significance. This overall pattern was broadly consistent with the main model.
Exploratory model-performance analyses are shown in Figure 5. The receiver operating characteristic curves suggest that the combined model, which included age, shunt volume, anatomical type, D-dimer status, and main pulmonary artery diameter, had better apparent discrimination than the age-only model or the RLS-feature model. The calibration plot and Brier score provided an additional exploratory assessment of model fit. Supplementary Figure 1 further shows that patients in the MRI-positive group were generally older than those in the MRI-negative group, while Supplementary Figure 2 shows that predicted probabilities from the combined model were higher in the MRI-positive group. These analyses are presented as representative outputs of the protocol and should be interpreted as exploratory rather than as evidence of external validation.
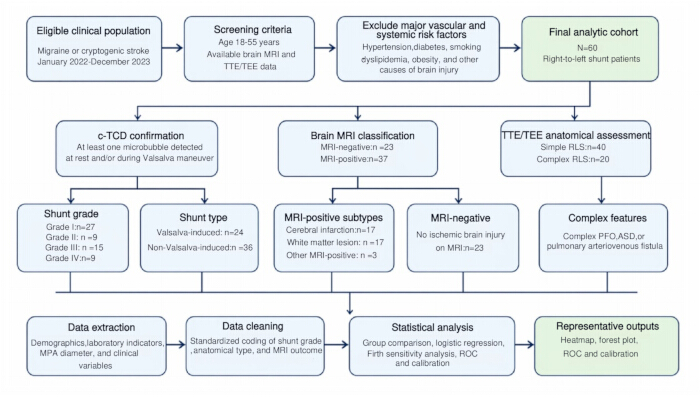
Figure 1: Standardized workflow for RLS-related ischemic brain injury assessment. This workflow shows the overall procedure for assessing RLS-related ischemic brain injury, including patient screening, exclusion of major vascular and systemic risk factors, final cohort definition, c-TCD confirmation of right-to-left shunt, brain MRI classification, TTE and/or TEE anatomical assessment, structured data extraction, dataset cleaning, and representative statistical outputs. The final analytic cohort comprised 60 RLS-positive patients. MRI classification identified 23 MRI-negative patients and 37 MRI-positive patients. Anatomical assessment classified 40 patients as having simple RLS and 20 as having complex RLS. Shunt grading showed 27 Grade I, 9 Grade II, 15 Grade III, and 9 Grade IV cases. Representative outputs included phenotype visualization, regression modeling, and exploratory ROC and calibration analyses. Abbreviations: RLS = right-to-left shunt; c-TCD = contrast-enhanced transcranial Doppler ultrasound; MRI = magnetic resonance imaging; TTE = transthoracic echocardiography; TEE = transesophageal echocardiography; PFO = patent foramen ovale; ASD = atrial septal defect; ROC = receiver operating characteristic. Please click here to view a larger version of this figure.
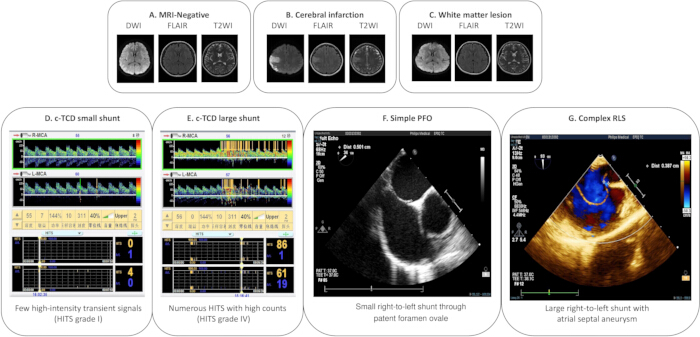
Figure 2: Representative neuroimaging, c-TCD, and echocardiographic findings. (A) Representative MRI-negative case showing no definite ischemic brain injury on diffusion-weighted imaging (DWI), fluid-attenuated inversion recovery (FLAIR), and T2-weighted imaging (T2WI). (B) Representative MRI-positive case with cerebral infarction. (C) Representative MRI-positive case with white matter lesion. (D) Representative c-TCD image showing a small shunt, characterized by a limited number of high-intensity transient signals (HITS grade I). (E) Representative c-TCD image showing a large shunt, corresponding to Grade IV in the study grading system. (F) Representative TTE/TEE image of a simple patent foramen ovale (PFO). (G) Representative TTE/TEE image of complex RLS, illustrated here by a large right-to-left shunt with atrial septal aneurysm. These representative images illustrate how multimodal imaging and examination findings were used for MRI classification, shunt grading, and anatomical phenotyping prior to statistical analysis. Abbreviation: MRI = magnetic resonance imaging; DWI = diffusion-weighted imaging; FLAIR = fluid-attenuated inversion recovery; T2WI = T2-weighted imaging; c-TCD = contrast-enhanced transcranial Doppler ultrasound; HITS = high-intensity transient signals; TTE = transthoracic echocardiography; TEE = transesophageal echocardiography; PFO = patent foramen ovale; RLS = right-to-left shunt. Please click here to view a larger version of this figure.
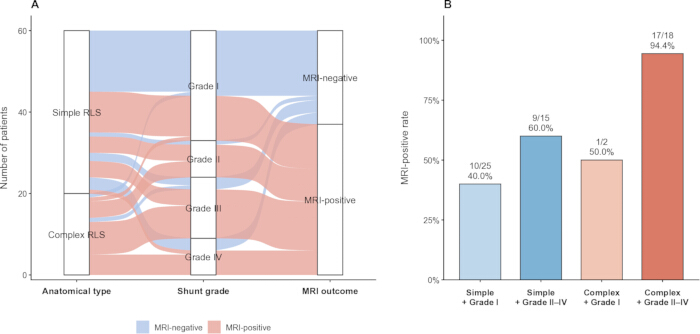
Figure 3: Distribution of RLS phenotypes and MRI findings. (A) Alluvial plot showing the distribution of patients across anatomical type, shunt grade, and MRI outcome. (B) Bar chart showing the MRI-positive rate across combined RLS phenotype categories. Values above the bars indicate the number of MRI-positive cases over the total number of cases, together with the corresponding MRI-positive percentage. MRI-positive findings were most frequent in complex RLS with Grade II–IV shunt. Abbreviations: RLS = right-to-left shunt; MRI = magnetic resonance imaging. Please click here to view a larger version of this figure.
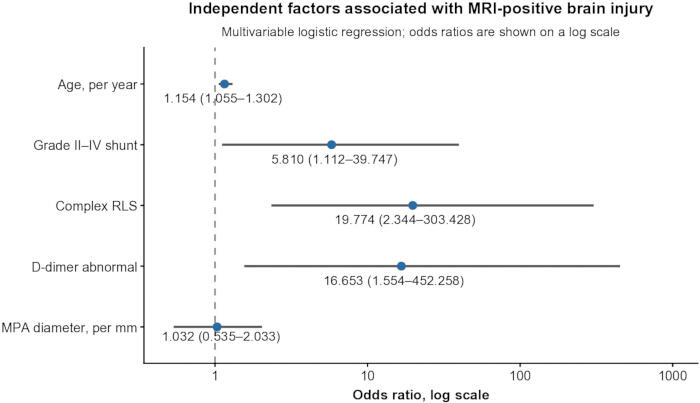
Figure 4: Independent factors associated with MRI-positive brain injury in multivariable logistic regression. Forest plot showing odds ratios (ORs) and 95% confidence intervals (CIs) from the multivariable logistic regression model for MRI-positive ischemic brain injury. Horizontal lines represent 95% CIs rather than SD or SEM. The model comprised age, Grade II-IV shunt, complex RLS, abnormal D-dimer, and main pulmonary artery diameter. ORs are shown on a logarithmic scale. Because the sample size was small and some phenotype categories were sparse, the effect estimates should be interpreted with caution. Firth penalized logistic regression was performed as a sensitivity analysis. Abbreviations: RLS = right-to-left shunt; OR = odds ratio; CI = confidence interval; MPA = main pulmonary artery; SD = standard deviation; SEM = standard error of the mean. Please click here to view a larger version of this figure.
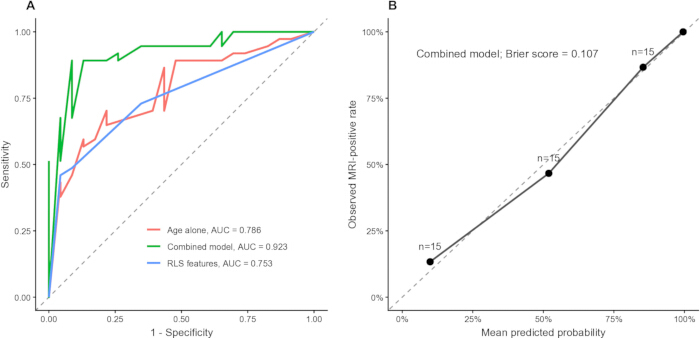
Figure 5: Exploratory ROC and calibration analysis of the age-only, RLS-feature, and combined models. (A) The receiver operating characteristic (ROC) curves of the age-only model, the RLS-feature model, and the combined model. The respective areas under the curve (AUCs) are shown in the figure. (B) Calibration plot for the combined model, with grouped observed event rates plotted against mean predicted probabilities. The Brier score is shown as a summary measure of calibration. These analyses are presented as exploratory outputs of the protocol and should not be interpreted as external validation of a prediction model. Abbreviations: ROC = receiver operating characteristic; AUC = area under the curve; RLS = right-to-left shunt. Please click here to view a larger version of this figure.
| Variable | Total | MRI-negative | MRI-positive | P value | |||||
| Age, years | 35.50 (28.00, 47.25) | 28.00 (21.50, 34.00) | 41.00 (32.00, 51.00) | <0.001 | |||||
| Height, cm | 161.00 (157.00, 168.25) | 161.00 (158.00, 169.00) | 160.00 (157.00, 168.00) | 0.307 | |||||
| Weight, kg | 55.00 (51.75, 64.00) | 55.00 (50.50, 63.50) | 57.50 (52.00, 64.00) | 0.819 | |||||
| BSA, m2 | 1.56 (1.50, 1.73) | 1.55 (1.50, 1.77) | 1.58 (1.52, 1.70) | 0.681 | |||||
| BMI, kg/m2 | 21.55 (20.54, 23.02) | 21.01 (20.18, 21.98) | 21.78 (20.76, 23.51) | 0.091 | |||||
| Baseline SpO2, % | 98.00 (97.00, 98.00) | 97.00 (97.00, 98.00) | 98.00 (97.00, 98.00) | 0.726 | |||||
| SpO2 after activity, % | 96.00 (95.00, 97.00) | 96.00 (95.00, 97.00) | 96.00 (96.00, 97.00) | 0.509 | |||||
| MPA diameter, mm | 20.50 (19.75, 21.00) | 20.00 (19.00, 21.00) | 21.00 (20.00, 22.00) | 0.023 | |||||
| Male | 20 (33.3%) | 7 (30.4%) | 13 (35.1%) | 0.707 | |||||
| Grade II–IV shunt | 33 (55.0%) | 7 (30.4%) | 26 (70.3%) | 0.003 | |||||
| Non-Valsalva-induced RLS | 36 (60.0%) | 13 (56.5%) | 23 (62.2%) | 0.665 | |||||
| Complex RLS | 20 (33.3%) | 2 (8.7%) | 18 (48.6%) | 0.001 | |||||
| Moderate/heavy manual work | 6 (10.0%) | 1 (4.3%) | 5 (13.5%) | 0.391 | |||||
| Residence in southern China | 29 (48.3%) | 14 (60.9%) | 15 (40.5%) | 0.126 | |||||
| Married | 38 (63.3%) | 9 (39.1%) | 29 (78.4%) | 0.002 | |||||
| Have children | 35 (58.3%) | 8 (34.8%) | 27 (73.0%) | 0.004 | |||||
| Oral contraceptive use (among women) | 3 (7.5%) | 1 (6.3%) | 2 (8.3%) | 1.000 | |||||
| Anxiety or depression | 18 (30.0%) | 8 (34.8%) | 10 (27.0%) | 0.524 | |||||
| Family history of migraine | 13 (21.7%) | 7 (30.4%) | 6 (16.2%) | 0.215 | |||||
| Abnormal inflammatory markers | 13 (21.7%) | 3 (13.0%) | 10 (27.0%) | 0.334 | |||||
| D-dimer abnormal | 15 (25.0%) | 1 (4.3%) | 14 (37.8%) | 0.004 | |||||
| Tricuspid regurgitation | 7 (11.7%) | 2 (8.7%) | 5 (13.5%) | 0.697 | |||||
Table 1: Baseline and clinical characteristics according to MRI outcome. Categorical variables are presented as n (%). Continuous variables with a skewed distribution are presented as median (Q1, Q3), unless otherwise specified. Differences between the MRI-negative and MRI-positive groups were assessed using the χ2 test or Fisher’s exact test for categorical variables, and the independent-samples t-test or Mann–Whitney U test for continuous variables, as appropriate. Abbreviations: MRI = magnetic resonance imaging; RLS = right-to-left shunt; BMI = body mass index; CRP = C-reactive protein; hsCRP = high-sensitivity C-reactive protein; SpO₂ = peripheral oxygen saturation; MPA = main pulmonary artery. D-dimer values reported as “<0.10 mg/L” were coded as not increased. For oral contraceptive use, percentages were calculated only among women. Variables with no observed events in either group were not highlighted in the inferential interpretation.
| Part A. Distribution of anatomical type across shunt grades | ||||
| Anatomy type | Grade I | Grade II | Grade III | Grade IV |
| Simple RLS | 25 (62.5%) | 5 (12.5%) | 6 (15%) | 4 (10%) |
| Complex RLS | 2 (10%) | 4 (20%) | 9 (45%) | 5 (25%) |
| Part B. MRI-positive rate across combined RLS phenotype categories | ||||
| RLS combined group | Total(n) | MRI positive n | MRI positive rate | Result |
| Complex + Grade I | 2 | 1 | 50 | 1/2 (50%) |
| Complex + Grade II–IV | 18 | 17 | 94.4 | 17/18 (94.4%) |
| Simple + Grade I | 25 | 10 | 40 | 10/25 (40%) |
| Simple + Grade II–IV | 15 | 9 | 60 | 9/15 (60%) |
Table 2: RLS phenotype distribution and MRI-positive rate. This table presents the distribution of shunt grade within the simple and complex RLS groups, together with the MRI-positive rates across the combined RLS phenotypes. Shunt grade was classified from c-TCD findings as Grade I, Grade II, Grade III, or Grade IV. For the combined phenotype analysis, it was also grouped as Grade I versus Grade II–IV. The combined phenotype categories were simple RLS with Grade I shunt, simple RLS with Grade II–IV shunt, complex RLS with Grade I shunt, and complex RLS with Grade II–IV shunt. Abbreviations: MRI = magnetic resonance imaging; RLS = right-to-left shunt; c-TCD = contrast-enhanced transcranial Doppler ultrasound.
| Variable | Univariable OR (95% CI) | Univariable P value | Multivariable OR (95% CI) | Multivariable P value | Firth OR (95% CI) | Firth P value |
| Male sex | 1.238 (0.411–3.921) | 0.707 | ||||
| Age, per year | 1.116 (1.054–1.196) | <0.001 | 1.154 (1.055–1.302) | 0.006 | 1.124 (1.039–1.249) | 0.002 |
| Grade II–IV shunt | 5.403 (1.802–17.733) | 0.004 | 5.810 (1.112–39.747) | 0.048 | 4.344 (0.965–24.038) | 0.056 |
| Non-Valsalva-induced RLS | 1.264 (0.434–3.663) | 0.665 | ||||
| Complex RLS | 9.947 (2.439–67.951) | 0.005 | 19.774 (2.344–303.428) | 0.014 | 11.230 (1.711–119.491) | 0.010 |
| Moderate/heavy manual work | 3.438 (0.508–68.275) | 0.274 | ||||
| Residence in southern China | 0.438 (0.147–1.253) | 0.129 | ||||
| Married | 5.639 (1.850–18.646) | 0.003 | ||||
| Have children | 5.062 (1.697–16.328) | 0.005 | ||||
| BMI, per kg/m2 | 1.286 (0.952–1.792) | 0.113 | ||||
| Anxiety or depression | 0.694 (0.224–2.172) | 0.525 | ||||
| Family history of migraine | 0.442 (0.123–1.542) | 0.200 | ||||
| Abnormal inflammatory markers | 2.469 (0.655–12.081) | 0.210 | ||||
| D-dimer abnormal | 13.391 (2.381–252.919) | 0.016 | 16.653 (1.554–452.258) | 0.039 | 8.995 (1.115–127.081) | 0.038 |
| Baseline SpO2, per 1% | 1.019 (0.603–1.719) | 0.944 | ||||
| SpO2 after activity, per 1% | 1.186 (0.695–2.068) | 0.534 | ||||
| Tricuspid regurgitation | 1.641 (0.320–12.199) | 0.575 | ||||
| MPA diameter, per mm | 1.645 (1.095–2.668) | 0.027 | 1.032 (0.535–2.033) | 0.925 | 1.026 (0.572–1.888) | 0.931 |
Table 3: Univariable, multivariable, and Firth penalized logistic regression analyses for MRI-positive ischemic brain injury. Odds ratios (ORs) with 95% confidence intervals (CIs) are presented for candidate factors associated with MRI-positive ischemic brain injury. Univariable logistic regression was first used to screen candidate variables. The main multivariable model included age, Grade II–IV shunt, complex RLS, abnormal D-dimer, and main pulmonary artery diameter. Given the limited sample size and the sparse distribution in several phenotype categories, Firth penalized logistic regression was additionally performed as a sensitivity analysis. Abbreviations: MRI = magnetic resonance imaging; RLS = right-to-left shunt; OR = odds ratio; CI = confidence interval; MPA = main pulmonary artery.
Supplementary Figure 1: Age distribution according to MRI outcome. Violin-box plot showing age distribution in MRI-negative and MRI-positive patients. The center line in each box represents the median; the box represents the interquartile range; whiskers represent 1.5 times the interquartile range; and points represent individual patients. Abbreviations: MRI = magnetic resonance imaging. Please click here to download this file.
Supplementary Figure 2: Distribution of predicted probability by MRI outcome. Violin-box plot showing predicted probabilities from the combined model according to MRI outcome. The combined model included age, shunt grade, anatomical type, D-dimer status, and main pulmonary artery (MPA) diameter. The center line in each box represents the median; the box represents the interquartile range; whiskers represent 1.5 times the interquartile range; and points represent individual patients. Abbreviations: MRI = magnetic resonance imaging; MPA = main pulmonary artery. Please click here to download this file.
Supplementary Table 1: Brain MRI acquisition parameters used in the present cohort. Acquisition parameters for the routine brain magnetic resonance imaging (MRI) protocol used to evaluate ischemic brain injury, including T1-weighted imaging (T1WI), T2-weighted imaging (T2WI), fluid-attenuated inversion recovery (FLAIR), diffusion-weighted imaging (DWI), and time-of-flight magnetic resonance angiography (TOF-MRA). The table summarizes the sequence-specific repetition time (TR), echo time (TE), inversion time (TI) or b value, slice thickness, interslice gap, and additional acquisition notes. Abbreviations: MRI = magnetic resonance imaging; TR = repetition time; TE = echo time; TI = inversion time; T1WI = T1-weighted imaging; T2WI = T2-weighted imaging; FLAIR = fluid-attenuated inversion recovery; DWI = diffusion-weighted imaging; TOF-MRA = time-of-flight magnetic resonance angiography. Please click here to download this file.
Discussion
The present study describes a standardized real-world workflow for evaluating MRI-defined ischemic brain injury in a clinically selected RLS-positive population. The value of the workflow lies in its integration of c-TCD shunt confirmation and grading, provoked versus non-provoked shunt pattern, brain MRI classification, TTE and/or TEE anatomical phenotyping, structured clinical data extraction, and transparent data cleaning6,7,8,9,11,12. The representative results suggest that MRI-positive findings were more frequent among patients with higher shunt burden and complex anatomical phenotypes, and that age, Grade II-IV shunt, complex RLS, and abnormal D-dimer were associated with MRI-positive brain injury in the main multivariable model13,14,15,16,17. These findings should be interpreted as exploratory outputs of a standardized protocol rather than as externally validated prediction results18,19.
Several implementation steps require particular attention. First, Valsalva performance is critical for detecting provoked RLS12,20,21,22. Inadequate pressure generation, incorrect timing between contrast injection and maneuver release, and inter-patient variability can lead to underestimation or inconsistent classification of shunt burden. In the present protocol, the mouthpiece/manometer method was used to objectively verify maneuver adequacy, with an expiratory pressure threshold of at least 40 mmHg maintained for approximately 10 s. Nevertheless, this approach reduces but does not eliminate variability related to patient cooperation, maneuver timing, and release quality. Therefore, maneuvers that do not reach the pressure target or are poorly timed should be retrained, repeated when clinically feasible, and flagged during data cleaning. Second, shunt-grade coding should be harmonized prior to analysis because mixed Roman numerals or non-standard symbols can lead to misclassification. Third, anatomical classification should not be reduced to the presence or absence of PFO alone; PFO tunnel length, atrial septal aneurysm, Chiari network, Eustachian/inferior vena cava valve abnormality, septum secundum thickness, ASD, pulmonary arteriovenous fistula, and atrial chamber enlargement should be reviewed when available8,11,13,14,15.
From a troubleshooting perspective, inadequate Valsalva pressure or mistimed release should prompt additional instruction and repeat contrast injection; an insufficient temporal window should prompt repositioning, use of the contralateral window, or alternative contrast echocardiographic assessment when clinically necessary; unclear PFO visualization should prompt use of the best available interatrial septal view, 3D TEE when available, or consensus review by an experienced echocardiography physician; and non-diagnostic MRI acquisition due to motion or technical failure should be repeated rather than classified as MRI-negative. These steps are intended to make protocol failures visible during data cleaning rather than allowing them to become hidden sources of misclassification.
This workflow has important limitations. MRI-positive ischemic brain injury was used as the outcome phenotype, but this does not mean that MRI is a complete surrogate for the clinical danger of every RLS. Some clinically important RLS may cause hypoxemia, exertional symptoms, high-altitude intolerance, or paradoxical embolic risk before an overt MRI-defined central nervous system event has occurred10,23,24,25. Therefore, MRI-negative status should not be interpreted as the absence of clinically relevant RLS.
The current protocol also does not replace physiologic evaluation of hypoxemia-related or dynamically inducible shunting. RLS magnitude may change with body position, Valsalva quality, exercise, reduced barometric pressure, hypoxic stress, and sleep-disordered breathing21,22,24,25,26. For patients with unexplained hypoxemia, elevated alveolar-arterial oxygen gradient, orthodeoxia-platypnea, exertional desaturation, high-altitude symptoms, suspected obstructive sleep apnea, or nocturnal hypoxemia, the workflow should be expanded to include arterial blood gas analysis, standardized supine/upright and post-exertional oximetry, nocturnal oximetry or polysomnography, and dynamic c-TCD or contrast echocardiography under standardized physiologic stress when clinically appropriate24,25,26. These variables were not uniformly available in the present retrospective dataset and were therefore not included in the main multivariable model.
Additional limitations include the single-center design, modest sample size, sparse phenotype categories, and the retrospective nature of data extraction. Firth penalized logistic regression was used as a sensitivity analysis to reduce small-sample bias, but wide confidence intervals indicate that effect estimates require cautious interpretation19,27,28. Future prospective studies should incorporate standardized Valsalva manometry, systematic assessment of positional and nocturnal oxygenation, screening for obstructive sleep apnea, atrial chamber quantification, and dynamic shunt assessment11,21,22,24,25,26. Such modifications would allow the current workflow to be extended from MRI-defined neurovascular phenotyping toward a broader physiologic and clinical risk-assessment framework.
Disclosures
The authors have nothing to disclose.
Acknowledgements
The authors are grateful to the patients who have enabled us to conduct this study through their participation. Gratitude goes to the clinical team at the Second Affiliated Hospital of Xiamen Medical College, who helped assess patients, perform imaging tests, and gather data. The study has been supported by the Leading Project of Fujian Provincial Science and Technology Department (project name: Application of Flexible Sensor-Based Motion Capture Clothing in Stroke Rehabilitation; grant number: 2022D022).
Materials
| Name | Company | Catalog Number | Comments |
|---|---|---|---|
| Electronic medical record system | The Second Affiliated Hospital of Xiamen Medical College | Institutional electronic medical record platform; not commercially cataloged | Used for patient identification, eligibility screening, and extraction of demographic and clinical variables. |
| Contrast-enhanced transcranial Doppler ultrasound system | Natus Neurology Incorporated | SONARA transcranial Doppler system; manufacturer website: https://natus.com/; FDA 510(k): https://www.accessdata.fda.gov/cdrh_docs/pdf6/K060421.pdf | Used for c-TCD confirmation of right-to-left shunt and shunt grading. |
| 2 MHz transcranial Doppler probe | Natus Neurology Incorporated | 2 MHz pulsed-wave transcranial Doppler probe compatible with the SONARA system; local equipment identifier: 2 MHz PW PROBE; serial no. 15-3189. Catalog number not available. | Used to monitor the middle cerebral artery during c-TCD examination. |
| Valsalva maneuver mouthpiece/blowing tube with pressure gauge or manometer | Institutional clinical mouthpiece–blowing tube–manometer system | No commercial catalog number available | Used to verify Valsalva maneuver adequacy. An adequate maneuver was defined as an expiratory pressure ≥40 mmHg maintained for approximately 10 s. |
| Sterile normal saline | Shijiazhuang No.4 Pharmaceutical Co., Ltd. | Sodium Chloride Injection, 100 mL:0.9 g; approval no. H13023202 | Used to prepare the agitated saline contrast medium. |
| Autologous venous blood | Not applicable | Patient-derived sample; no catalog number | Used as 1 mL of autologous venous blood in the agitated saline contrast medium. |
| Room air | Not applicable | No catalog number | Used as 1 mL of air in the agitated saline contrast medium. |
| Disposable sterile syringe, 10 mL | Shandong Weigao Group Medical Polymer Co., Ltd. | Catalog number not available; manufacturer information: https://www.wegomedical.com/wp-content/uploads/2024/03/WEGO-Syringe-Combination.pdf | Used for preparation and bolus injection of the agitated saline contrast medium. |
| Three-way stopcock | BD Switzerland Sàrl | BD Connecta™ Stopcock; REF 394601 | Used to mix air, autologous venous blood, and saline to generate the agitated saline contrast medium. |
| Peripheral intravenous infusion set / venous access supplies | Shanghai Kindly Enterprise Development Group Co., Ltd. | Manufacturer website: http://www.kdlchina.cn/ | Used for antecubital venous access and contrast injection. |
| Clinical 3.0 T MRI scanner | GE HealthCare | Discovery MR750, 3.0 T; product information: https://www.gehealthcare.com.au/en-AU/products/magnetic-resonance-imaging/3-0t/discovery-mr750 | Used for brain MRI acquisition, including T1WI, T2WI, FLAIR, DWI, and TOF-MRA. |
| Standard head coil for MRI | GE HealthCare | Standard head coil supplied with the Discovery MR750; not separately cataloged | Used for routine brain MRI acquisition. |
| Transthoracic echocardiography system | GE HealthCare | Vivid E9 cardiovascular ultrasound system; product information: https://www.vividechoclub.net/emea/generalnews?id=172 | Used for transthoracic echocardiographic assessment of right-to-left shunt. |
| Transesophageal echocardiography system | Philips Healthcare | EPIQ 7C ultrasound system for cardiology; product information: https://www.usa.philips.com/healthcare/product/HC795200C/epiq-7-ultrasound-system-for-cardiology | Used for transesophageal echocardiographic assessment of right-to-left shunt. |
| Imaging review workstation / PACS | The Second Affiliated Hospital of Xiamen Medical College | Institutional picture archiving and communication system; not commercially cataloged | Used for review of MRI and echocardiographic findings by imaging specialists. |
| Statistical package software | IBM Corp. | IBM SPSS Statistics, version 22.0 | Used for routine descriptive statistics and group comparisons. |
| Statistical computing environment | R Foundation for Statistical Computing | R software, version 4.5.2; https://www.r-project.org/ | Used for data cleaning, visualization, logistic regression, Firth penalized logistic regression, ROC analysis, and calibration assessment. |
References
- Buchholz S, Shakil A, Figtree GA, Hansen PS, Bhindi R. Diagnosis and management of patent foramen ovale. Postgrad Med J. 2012;88(1038):217-225.
- Lacombe P, et al. Diagnosis and treatment of pulmonary arteriovenous malformations in hereditary hemorrhagic telangiectasia: An overview. Diagn Interv Imaging. 2013;94(9):835-848.
- Kent DM, Wang AY. Patent foramen ovale and stroke: A review. JAMA. 2025;334(16):1463-1473.
- Lucà F, et al. Patent foramen ovale and cryptogenic stroke: Integrated management. J Clin Med. 2023;12(5):1952.
- Liu K, Wang BZ, Hao Y, Song S, Pan M. The correlation between migraine and patent foramen ovale. Front Neurol. 2020;11:543485.
- Anzola GP. Clinical impact of patent foramen ovale diagnosis with transcranial Doppler. Eur J Ultrasound. 2002;16(1-2):11-20.
- Soliman OII, et al. The use of contrast echocardiography for the detection of cardiac shunts. Eur J Echocardiogr. 2007;8(3 Suppl):S2-S12.
- Aggeli C, et al. Echocardiographic features of patent foramen ovale and paradoxical embolism: A complicated puzzle. Int J Cardiovasc Imaging. 2018;34(12):1849-1861.
- Caputi L, et al. Transcranial Doppler and transesophageal echocardiography: Comparison of both techniques and prospective clinical relevance of transcranial Doppler in patent foramen ovale detection. J Stroke Cerebrovasc Dis. 2009;18(5):343-348.
- Ioannidis SG, Mitsias PD. Patent foramen ovale in cryptogenic ischemic stroke: Direct cause, risk factor, or incidental finding? Front Neurol. 2020;11:567.
- Saeed S, Gerdts E, Waje-Andreassen U, Sinisalo J, Putaala J. Searching for Explanations for Cryptogenic Stroke in the Young (SECRETO): Echocardiography performance protocol. Echo Res Pract. 2019;6(3):53-61.
- Van der Giessen H, Wilson LC, Coffey S, Whalley GA. Detection of patent foramen ovale using transcranial Doppler or standard echocardiography. Australas J Ultrasound Med. 2020;23(4):210-219.
- Nakayama R, et al. Identification of high-risk patent foramen ovale associated with cryptogenic stroke: Development of a scoring system. J Am Soc Echocardiogr. 2019;32(7):811-816.
- Goel SS, et al. Morphology of the patent foramen ovale in asymptomatic versus symptomatic (stroke or transient ischemic attack) patients. Am J Cardiol. 2009;103(1):124-129.
- Rigatelli G, Zuin M, Bilato C. Atrial septal aneurysm contribution to the risk of cryptogenic stroke in patients with patent foramen ovale: A brief updated systematic review and meta-analysis. Trends Cardiovasc Med. 2023;33(6):329-333.
- Kim YD, et al. D-dimer for prediction of long-term outcome in cryptogenic stroke patients with patent foramen ovale. Thromb Haemost. 2015;114(3):614-622.
- Park S, et al. Risk of recurrent ischemic stroke in patients with patent foramen ovale: The role of D-dimer. J Stroke Cerebrovasc Dis. 2023;32(9):107246.
- Moons KGM, et al. Transparent Reporting of a multivariable prediction model for Individual Prognosis or Diagnosis (TRIPOD): Explanation and elaboration. Ann Intern Med. 2015;162(1):W1-W73.
- Wang X, Cheng Z. Cross-sectional studies: Strengths, weaknesses, and recommendations. Chest. 2020;158(1 Suppl):S65-S71.
- Kim BJ, Kim NY, Kang DW, Kim JS, Kwon SU. Provoked right-to-left shunt in patent foramen ovale associates with ischemic stroke in posterior circulation. Stroke. 2014;45(12):3707-3710.
- Rodrigues AC, et al. Importance of adequately performed Valsalva maneuver to detect patent foramen ovale during transesophageal echocardiography. J Am Soc Echocardiogr. 2013;26(11):1337-1343.
- Zetola VF, et al. Latin American consensus statement for the use of contrast-enhanced transcranial ultrasound as a diagnostic test for detection of right-to-left shunt. Cerebrovasc Dis. 2019;48(3-6):99-108.
- Søndergaard L, et al. Patent foramen ovale closure or antiplatelet therapy for cryptogenic stroke. N Engl J Med. 2017;377(11):1033-1042.
- Blanche C, et al. Platypnea-orthodeoxia syndrome in the elderly treated by percutaneous patent foramen ovale closure: A case series and literature review. Eur J Intern Med. 2013;24(8):813-817.
- Stepanek J, et al. Identifying the causes of unexplained dyspnea at high altitude using normobaric hypoxia with echocardiography. J Imaging. 2024;10(2):38.
- Beelke M, et al. Obstructive sleep apnea can be provocative for right-to-left shunting through a patent foramen ovale. Sleep. 2002;25(8):21-27.
- Suhas S, et al. Firth's penalized logistic regression: A superior approach for analysis of data from India's National Mental Health Survey, 2016. Indian J Psychiatry. 2023;65(12):1208-1213.
- Pavlou M, Ambler G, Seaman S, De Iorio M, Omar RZ. Review and evaluation of penalised regression methods for risk prediction in low-dimensional data with few events. Stat Med. 2016;35(7):1159-1177.