This behavioral-science and psychological-assessment protocol standardizes online questionnaire administration, scoring, data-quality screening, and reproducible analysis to assess internet addiction and emotion-regulation difficulty among university students.
Method Article
A Standardized Questionnaire Protocol for Internet Addiction and Emotion-Regulation Assessment in University Students
In This Article
Summary
Abstract
Internet use is deeply embedded in university life, but problematic internet use cannot be evaluated adequately by exposure time alone. Evidence suggests that maladaptive or compulsive patterns of internet use are associated with difficulty in emotion regulation, yet inconsistencies in questionnaire order, eligibility criteria, screening thresholds, scoring procedures, and analytic reporting continue to limit comparability across studies. This method's article presents a standardized questionnaire protocol for behavioral-science and psychological-assessment studies examining internet addiction and emotion-regulation difficulty among university students. The workflow includes a fixed questionnaire sequence, prespecified eligibility criteria, mandatory-response settings, pilot-based completion-time thresholds, sequential data-quality screening, standardized scoring of the Internet addiction test and the 16-item difficulties in emotion regulation scale, and reproducible descriptive, correlational, and multivariable regression analyses. The protocol also specifies archiving of raw returns, screening logs, README/codebook files, and the final analysis-ready dataset. A representative implementation is reported to demonstrate execution of the protocol rather than to validate the instruments or establish prevalence. In that implementation, 520 students were invited, and 480 questionnaires were returned. After sequential exclusion of duplicate submissions, speeded responses, failed attention checks, patterned responding, logical inconsistency, and missing core data, 452 valid questionnaires were retained. The predefined analytic demonstration examined the association between the Internet addiction test total score and the difficulties in emotion regulation scale total score. The retained sample showed a mean Internet addiction test total score of 51.94 and a mean Difficulties in emotion regulation scale total score of 35.95. Emotion-regulation difficulty increased across internet-addiction severity groups, and the association remained evident after adjustment for demographic and behavioral covariates. This protocol provides a transparent workflow that can be repeated, audited, and adapted for future cross-sectional, repeated-measure, or longitudinal studies in university populations.
Introduction
Internet use has become an ordinary part of university life, including academic work, social communication, entertainment, information seeking, and emotional coping. For this reason, student internet behavior should not be interpreted simply as screen exposure or time online. Earlier evidence showed that problematic internet use was already visible in youth and college populations before the current mobile-platform environment became highly saturated1. More recent university-based studies further indicate that problematic internet use is common enough to require systematic assessment rather than informal description2.
University students represent a particularly relevant population for standardized assessment because academic pressure, social transition, independent living, and increased autonomy often occur at the same developmental stage. These demands are frequently managed through the same digital devices and platforms that may also become difficult to regulate. A meta-analytic review showed that problematic internet use among students is associated with multiple mental-health outcomes, supporting its interpretation as a broader behavioral and psychological concern rather than a narrow technology-use problem3. Perceived stress has also been linked to internet-addiction patterns among college students, suggesting that emotional and contextual pressures should be considered when designing questionnaire-based studies in this field4.
The present protocol uses the term “internet addiction” when referring specifically to the construct measured by the Internet addiction test and its established score categories. The broader term “problematic internet use” is used when discussing the wider literature on maladaptive, excessive, or functionally impairing internet-related behavior. “Compulsive internet use” is used only when the cited literature emphasizes loss of control, urges, or repetitive use despite negative consequences. These terms are therefore related but not treated as fully interchangeable. When the protocol is implemented with the Internet Addiction Test, “internet addiction” is retained as the instrument-specific terminology; when alternative or revised instruments are used, terminology should be aligned with the construct labels and diagnostic assumptions of the selected measure.
Emotion regulation provides a plausible psychological entry point for understanding why some students move from frequent internet use to maladaptive internet use. A one-year prospective study showed that difficulty in emotion regulation was relevant to both later occurrence and remission of internet addiction among college students5. This finding is important for protocol design because emotion regulation is not merely an additional correlate; it may influence how students use the internet to avoid, reduce, or manage distress. At the same time, social functioning remains relevant. Problematic internet use has been associated with social skills among university students, indicating that interpersonal and emotional factors should be assessed alongside digital-use variables6. During the COVID-19 period, problematic internet use also co-occurred with broader psychological difficulties among Chinese university students, further supporting the need for structured assessment in university settings7.
A further challenge is that digital behavior is heterogeneous. Students may use digital platforms for study, social contact, entertainment, health information, or temporary emotional relief, and not all high-frequency use is harmful. A systematic review of mental health-related digital use by university students showed that digital engagement can serve multiple psychological purposes8. The field, therefore, needs procedures that distinguish ordinary high-frequency use from problematic or dysregulated use. Recent evidence on problematic smartphone use in university students similarly suggests that risk depends on behavioral pattern, function, and context rather than duration alone9. For this reason, the present protocol combines internet-use duration, late-night use, primary online activity, and standardized symptom scoring instead of relying on a single exposure indicator.
Measurement is another major source of inconsistency. The Internet addiction test remains one of the most widely used instruments for assessing internet-addiction symptoms, but its dimensionality and interpretation have varied across settings. Systematic psychometric evidence indicates that the instrument has been used extensively while continuing to raise questions about factor structure and scoring interpretation10. Similar concerns have been reported in college-student samples, where widespread use of the scale did not fully resolve uncertainty about the construct being measured11. Validation studies in Spanish and Peruvian university populations also show that the instrument can perform adequately, but that its psychometric behavior should be considered within the target population where it is applied12,13.
The protocol is therefore designed to be stable in workflow but adaptable in instrument selection. The Internet addiction test is used here because of its historical use, available thresholds, and comparability with prior university-student research. However, the protocol does not require the Internet addiction test to remain the preferred instrument indefinitely. If diagnostic frameworks evolve or if newer instruments become more appropriate for a specific population, the same workflow can be retained while replacing the scale-specific module, score range, severity thresholds, codebook entries, and README documentation. Any such replacement should be made before formal data collection begins and should be reported as a protocol modification rather than an ad hoc analytic change.
The methodological problem addressed by this article is not simply that studies of internet addiction and emotion regulation reach different conclusions. Rather, many studies differ in questionnaire sequence, eligibility criteria, survey-platform settings, duplicate-response handling, attention-check procedures, completion-time thresholds, missing-data rules, scoring verification, and reporting of analysis-ready files. These differences make results difficult to compare, reproduce, and include in later evidence synthesis. The present protocol responds to this gap by fixing the administration sequence, screening logic, scoring structure, and analytic pathway in a way that can be repeated, audited, and modified transparently. Its contribution is therefore protocol-oriented: it provides a reproducible workflow for observational behavioral-science and psychological-assessment studies in university populations, rather than proposing a new psychological construct or presenting a prevalence study as the main outcome.
Protocol
The study, entitled “A Standardized Questionnaire Protocol for Internet Addiction and Emotion Regulation Assessment in University Students,” was reviewed and approved by the Ethics and Academic Committee of Zhengzhou University of Economics and Business under Approval Number 20260113004 before participant recruitment began14. The study used a cross-sectional, anonymous online questionnaire design involving full-time university students aged 18–24 years and was conducted in accordance with institutional ethical requirements and the Declaration of Helsinki. Electronic informed consent was obtained before questionnaire access. Participants received an electronic information sheet describing the study purpose, procedures, voluntary nature of participation, and data-protection measures, and they were free to withdraw at any time without penalty. No directly identifiable personal information, including name, student identification number, exact address, telephone number, personal email address, or social-media account, was collected in the main survey file. Platform-generated identifiers were used only for duplicate-response screening and were removed before dataset analysis. All data were stored securely and analyzed in de-identified form. This questionnaire workflow was not prospectively registered before participant recruitment. However, all core protocol components, including the locked questionnaire version, README/codebook, screening log, scoring rules, analysis syntax, and analysis-ready workflow files, were archived and are provided as supplementary workflow materials to support reproducibility and auditability.
Platform-generated response identifiers and device- or account-limited technical identifiers were used only for duplicate-response screening and were removed from the final anonymized analytical dataset. The core variables and scoring rules are summarized in Table 1, and the complete variable dictionary is provided in Supplementary Table 1. The questionnaire files, codebook, screening log, output plan, and analysis-ready workflow materials are provided in Supplementary File 1.
| Domain | Variable | Coding/Scoring | Role in protocol |
| Eligibility | Age | Years; eligible range 18–24 | Eligibility variable and covariate |
| Demographics | Sex | 1 = male; 2 = female; 3 = prefer not to say | Descriptive variable and regression covariate |
| Demographics | Academic year | 1 = first year; 2 = second year; 3 = third year; 4 = fourth year or above; 5 = postgraduate | Descriptive variable |
| Demographics | Discipline category | 1 = humanities and social sciences; 2 = science and engineering; 3 = business and management; 4 = arts and design; 5 = other | Descriptive variable |
| Demographics | Residence type | 1 = on-campus dormitory; 2 = off-campus rental; 3 = family home; 4 = other | Descriptive variable |
| Demographics | Monthly living expenses | 1 = <1,000 CNY; 2 = 1,000–1,999 CNY; 3 = 2,000–2,999 CNY; 4 = ≥3,000 CNY | Descriptive variable |
| Internet-use behavior | Weekday internet use | 1 = <2 h; 2 = 2–3.9 h; 3 = 4–5.9 h; 4 = ≥6 h | Behavioral covariate |
| Internet-use behavior | Weekend internet use | 1 = <2 h; 2 = 2–3.9 h; 3 = 4–5.9 h; 4 = ≥6 h | Behavioral covariate |
| Internet-use behavior | Primary online activity | 1 = study; 2 = social media; 3 = gaming; 4 = entertainment/video; 5 = shopping; 6 = mixed use; 7 = other | Descriptive variable |
| Internet-use behavior | Primary access device | 1 = smartphone; 2 = tablet; 3 = laptop/desktop; 4 = mixed devices | Descriptive variable |
| Internet-use behavior | Late-night use after 23:00 | 1 = never; 2 = less than once per week; 3 = 1–2 nights/week; 4 = 3–5 nights/week; 5 = almost every night | Behavioral covariate and logical-consistency screening variable |
| Core scale | IAT total score | Sum of 20 items; each item scored 1–5; total range 20–100 | Primary independent variable |
| Core scale | IAT severity group | 20–39 = normal use; 40–69 = problematic use; 70–100 = severe problematic use | Grouping variable |
| Core scale | DERS-16 total score | Sum of 16 items after required reverse coding; total range 16–80 | Primary dependent variable |
| Core scale | DERS-16 subscales | Computed according to the locked DERS-16 scoring key | Descriptive emotion-regulation outcomes |
| Covariate | Sleep duration | 1 = <6 h; 2 = 6–6.9 h; 3 = 7–7.9 h; 4 = ≥8 h | Adjustment variable |
| Covariate | Weekly physical activity | 0 = none; 1 = 1–2 sessions; 2 = 3–4 sessions; 3 = ≥5 sessions | Adjustment variable |
| Covariate | Academic stress | 1 = low; 2 = moderate; 3 = high | Adjustment variable |
| Quality control | Attention check | 1 = pass; 0 = fail | Exclusion criterion |
| Quality control | Completion time | Completion duration in seconds | Timing-based screening variable |
| Quality control | Long-string response count | Maximum run length of identical responses across the 36 scored scale items | Patterned-response screening variable |
| Quality control | Within-person SD | Within-person standard deviation across the 36 scored scale items | Invariant-response screening variable |
| Quality control | Logical-consistency flag | 0 = no inconsistency; 1 = inconsistency detected | Logical-consistency screening variable |
Table 1: Core variables, coding structure, and scoring rules used in the standardized questionnaire protocol. This table summarizes the core eligibility, demographic, internet-use, scale, covariate, and quality-control variables used in the main workflow. It includes the coding values, score ranges, scoring rules, and roles of the main variables used for questionnaire administration, screening, scoring, and analysis. Abbreviations: IAT = internet addiction test; DERS-16 = 16-item difficulties in emotion regulation scale. Please click here to download this Table.
1. Set up the study population, questionnaire structure, and survey flow
- Define the target population and valid sample
- Recruit full-time undergraduate and postgraduate students aged 18–24 years who can complete the questionnaire independently on a mobile phone or computer. Record the questionnaire language version and use scale versions that have been validated or appropriately adapted for the target student population.
- Document any accessibility or language modification before data collection when international students, students with disabilities, or multilingual student groups are included.
- Restrict participation to one completed response per participant. Use the survey platform’s device restriction, account restriction, cookie restriction, or authenticated-link function when available.
NOTE: When the same participant account generates responses from multiple devices, identify and reconcile those records during duplicate screening using the account-limited identifier, timestamp, questionnaire status, and response-pattern similarity. - Set the minimum final valid sample at 450 questionnaires and continue recruitment until the cleaned dataset remains above this threshold after screening.
NOTE: When severe problematic internet use or another small subgroup is a primary analysis target, set a larger recruitment target before data collection begins. - Record the number invited, the number returned, the number excluded at each prespecified screening step, and the final number retained so that the participant flow can later be summarized in Figure 1.
- Construct the questionnaire in a fixed order
- Arrange the questionnaire in the following sequence: informed consent, demographic information, internet-use behavior, Internet Addiction Test, Difficulties in emotion regulation scale short form, sleep duration, weekly physical activity, and perceived academic stress. Keep this order unchanged for all participants. Do not randomize the order of the core scales.
- Record age, sex, academic year, discipline category, residence type, and monthly living expenses using closed-ended response categories. Mark all demographic items as mandatory.
NOTE: For sex, include male, female, and prefer not to say. Retain “prefer not to say” in descriptive analyses. In regression analyses, code sex using indicator variables with male as the reference category, including separate indicators for female and prefer not to say. Do not delete participants solely because they select “prefer not to say.” - Record weekday internet-use duration, weekend internet-use duration, primary online activity, primary access device, and late-night internet use after 23:00. Code late-night use as 1 = never, 2 = less than once per week, 3 = 1–2 nights per week, 4 = 3–5 nights per week, and 5 = almost every night.
- Record the academic period during which the questionnaire is administered. In the representative implementation, the survey was administered during a regular teaching semester, outside final examination weeks, specifically during semester weeks 6–7.
- Administer and score the core instruments
- Administer the 20-item Internet addiction test as a mandatory scale and score each item from 1 to 5. Sum all 20 items to obtain a total score ranging from 20 to 100, then classify 20–39 as normal use, 40–69 as problematic use, and 70–100 as severe problematic use15.
- Use “internet addiction” when reporting IAT-based scores and severity groups. Use “problematic internet use” only when referring to the broader literature or non-IAT constructs.
- Administer the 16-item Difficulties in emotion regulation scale short form immediately after the internet addiction test and score each item from 1 to 5. Reverse-code Items 1, 6, and 8 before summation, then calculate a total score ranging from 16 to 80, with higher scores indicating greater difficulty in emotion regulation16.
- Generate five subscale scores for nonacceptance, goals, impulse, strategies, and clarity after reverse coding has been verified.
- Recheck the coding direction of all reversed items before calculating the total and subscale scores. Use the same DERS-16 scoring key for every participant and document the scoring key in the README/codebook.
- When a revised or alternative internet-addiction instrument is used, replace the scale-specific module before data collection begins and update the item names, score range, severity thresholds, scoring syntax, README/codebook, questionnaire screenshots, and Table of Materials.
- Add covariates and one attention-check item
- Record sleep duration as <6 h, 6–6.9 h, 7–7.9 h, and ≥8 h. Record weekly physical activity frequency as 0, 1–2, 3–4, and ≥5 sessions. Record perceived academic stress as low, moderate, or high. Define one physical-activity session as ≥20 min of moderate or vigorous activity.
- Insert one directed-response attention-check item in the behavioral section and require the participant to select one specified response option. The attention-check item used in the representative implementation was: “To confirm that you are reading carefully, please select ‘3 = sometimes’ for this item”. Mark any questionnaire that fails this item for exclusion during cleaning17.
CRITICAL STEP: Do not change item wording, response anchors, scale order, exclusion thresholds, survey-platform settings, coding rules, or statistical-analysis rules after formal data collection begins.
NOTE: Summarize the core variables, coding values, score ranges, and scoring rules in Table 1. Provide the complete variable dictionary, file-status fields, screening flags, technical identifier fields, dataset-tracking variables, file names, and software versions in Supplementary Table 1 and the README/codebook.
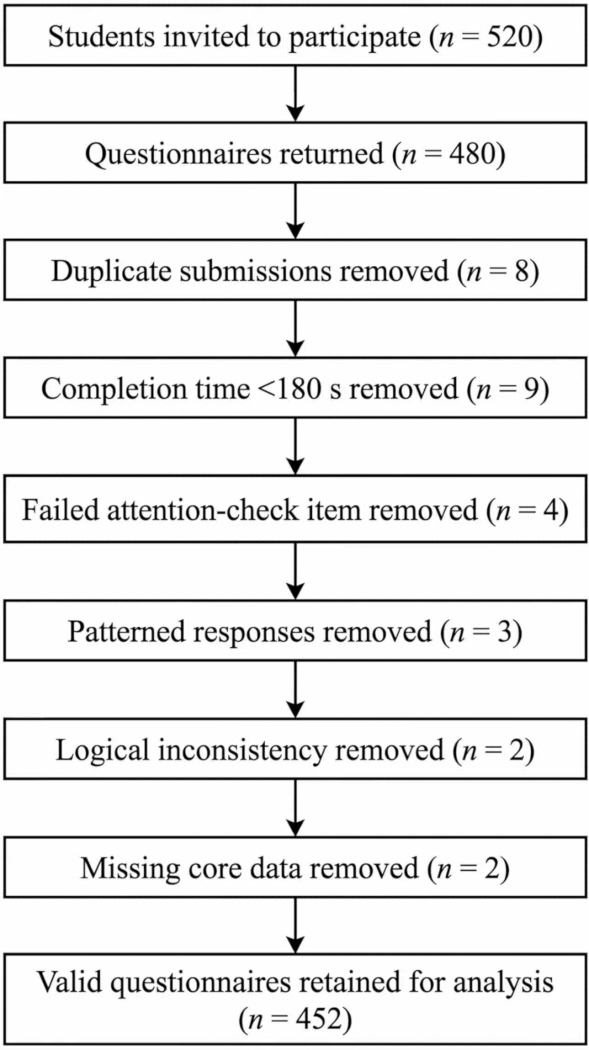
Figure 1: Questionnaire flow for recruitment, screening, exclusion, and final analytic retention. This flow diagram shows the progression from invited students to returned questionnaires, through sequential data-quality screening and exclusion by prespecified criteria, to final retention of valid questionnaires for analysis. The figure presents the number of invited students, returned questionnaires, excluded records at each screening step, and the final analytic sample. Please click here to view a larger version of this figure.
2. Pilot-test the questionnaire and lock the final field version
- Pilot-test the full questionnaire
- Administer the full questionnaire to 20–30 students who satisfy the formal inclusion criteria but are not retained in the final dataset.
- Record completion time and written feedback on clarity, response burden, technical access, item order, attention-check comprehension, and any ambiguity in demographic or behavioral response options.
- Record the pilot sample size, median completion time, interquartile range, minimum and maximum completion time, and all wording changes made after pilot testing.
- In the representative implementation, the pilot included 25 students, the median completion time was 540 s, and the expected completion time was set at 6–8 min.
- Revise ambiguous wording, duplicated meaning, unclear response options, or software-display problems identified during pilot testing, then freeze the final questionnaire version before formal release.
NOTE: If the study includes multilingual students, older adults, adolescents, or students with disabilities, conduct additional cognitive testing or subgroup pilot testing before formal release.
- Fix the operational settings and export rules
- Create a new survey project in the selected online survey platform. Enter the consent page as the first page and set the consent item as a required branching item.
- Configure the survey so that participants who do not provide consent exit the survey automatically without seeing the questionnaire body.
- Enter all demographic, internet-use, IAT, DERS-16, covariate, and attention-check items using the locked wording and response anchors. Set all core items as mandatory.
- Activate automatic recording of start time, end time, completion duration, response status, and platform-generated response identifier.
- Enable one-response-per-participant controls when available, including authenticated survey links, device restriction, cookie-based repeat prevention, account-based repeat prevention, or duplicate-response review settings. Record the enabled controls in the README/codebook.
- Disable collection of unnecessary direct identifiers. If the platform records IP address by default, disable IP storage or replace it with a non-identifying duplicate-screening field when permitted by institutional policy.
NOTE: When IP addresses or device metadata are temporarily retained for duplicate screening, store them only in the encrypted raw file, restrict access to the study analyst, and remove them before producing the final analytical dataset. - Specify whether pause-and-resume is permitted. In this protocol, a formal save-and-return function across different sessions is not enabled. Participants may pause only within the same open browser session, and the recorded completion time includes the full elapsed time.
- Export the raw return file in both spreadsheet and comma-separated-value formats at survey closure18. Also export a survey-to-document file or PDF/A copy containing the final questionnaire wording, item order, branching settings, mandatory-item settings, and coding structure. Save these files with version-controlled names.
- Calculate the pilot median completion time and set the minimum valid completion threshold at approximately one-third of that value. Fix the final lower threshold at 180 s and apply it uniformly during formal screening.
- Because this cutoff is derived from the pilot sample, re-establish the threshold when the protocol is implemented in a substantially different population, platform, language version, or institutional setting.
NOTE: Archive the final questionnaire screenshots, final questionnaire export, README/codebook, pilot log, attention-check wording, screening-log template, export settings, and statistical syntax as supplementary or audit files.
3. Release the questionnaire and preserve the raw dataset
- Recruit participants through fixed channels
- Distribute one standardized invitation through student communication groups, class channels, or institutional mailing lists during a fixed 14-day collection window.
- State the study purpose, expected completion time of 6–8 min, anonymous handling of data, voluntary participation, and the absence of academic penalty or reward for nonparticipation in both the invitation and the consent page.
- Display the consent page before any questionnaire item appears and require active agreement before entry. Do not permit access to the questionnaire body without an affirmative consent response.
- State on the consent page that participants may stop before final submission and that incomplete responses will not be used in the final analysis.
- Use the same locked questionnaire version across all recruitment channels. If several recruitment channels are used, record the channel only when it is prespecified as a study variable.
- Preserve the raw return file
- Retain all returned records, including incomplete and later-excluded submissions, in the raw export file. Export the full dataset immediately after survey closure and store it as raw_returns_YYYYMMDD.csv and raw_returns_YYYYMMDD.xlsx.
- Preserve the original submission time, completion duration, response status, platform-generated response identifier, and device-limited or account-limited technical identifier in the raw file. Do not overwrite these fields during later cleaning.
- Save one read-only raw-data copy before screening begins. Store the raw file, screening log, and final analytic dataset in separate folders. Restrict access to the raw file containing technical identifiers to authorized study personnel only.
CAUTION: Do not collect directly identifying information, such as full name, student identification number, exact dormitory address, personal telephone number, personal email address, or social media account, in the main survey file.
NOTE: Pause the workflow after raw export, save one read-only copy of the raw dataset, and restart cleaning only from that preserved copy.
4. Screen returned questionnaires and generate the final analytic dataset
- Apply the screening sequence in a fixed order
- Sort all returned records by device-limited identifier, account-limited identifier when available, timestamp, questionnaire status, and response similarity. Identify duplicate submissions first. Retain the earliest complete record when two or more submissions originate from the same participant within the same collection cycle.
- If multiple submissions are detected from the same authenticated account but different devices, treat them as duplicate submissions from the same participant. Retain the earliest complete record and exclude later complete records. If the earliest record is incomplete and a later record is complete, retain the earliest complete record.
- Remove records with completion time <180 s, review records completed in 180–240 s, and remove records that fail the directed-response attention-check item fourth. Document the number removed at each step in screening_log_v1.xlsx19.
- For records completed in 180–240 s, conduct manual review using the attention-check result, long-string responding flag, within-person standard deviation, and logical-consistency flag.
- Retain a borderline-speed record only when no additional data-quality flag is present. Record every borderline-speed decision in the screening log.
- Remove patterned, inconsistent, or incomplete records
- Remove all questionnaires showing long-string responding, defined as 18 or more consecutive identical responses across the 36 scored scale items, or a within-person standard deviation ≤0.25 across those items.
- Remove any questionnaire showing impossible behavioral combinations. Define “the highest response category on nearly all Internet addiction test items” as a score of 5 on at least 18 of the 20 IAT items.
NOTE: The logical-inconsistency rule is triggered when a respondent reports both weekday and weekend internet use in the lowest duration category (<2 h per day), late-night internet use coded as “almost every night,” and a score of 5 on at least 18 of the 20 IAT items. Apply this rule only after duplicate, completion-time, attention-check, and patterned-response screening have been completed. - Remove all questionnaires with missing values in any IAT item, any DERS-16 item, or any prespecified covariate.
NOTE: This complete-case rule is used because the online survey uses mandatory core items and because the representative regression model requires a fixed covariate set. When missing covariate data exceed 5%, use a prespecified alternative missing-data method, such as multiple imputation. - Assign one anonymous study ID to each retained record and save the remaining file as analytic_dataset_v1.csv and analytic_dataset_v1.xlsx.
- Remove platform-generated response identifiers, device-limited identifiers, account-limited identifiers, IP addresses if retained during screening, timestamps, and free-text review notes from the final analytic dataset. Keep only the anonymous study ID and analysis variables.
CRITICAL STEP: Apply the screening sequence in the same order to every record and do not re-enter previously excluded cases at later stages. Assign the first triggered exclusion criterion as the primary exclusion reason and record secondary flags only as screening-log notes.
NOTE: Summarize the final exclusion counts by reason in Table 2, and keep those counts identical to the participant flow reported later in Figure 1.
| Screening order | Screening item | Operational rule | Screening action | Documentation rule |
| Step 1 | Raw export preservation | Export all returned records immediately after survey closure and save them as raw_returns_YYYYMMDD.csv and raw_returns_YYYYMMDD.xlsx | Preserve one read-only copy before any cleaning begins | Archive in raw-data folder |
| Step 2 | Consent and access check | Identify records without active electronic informed consent before questionnaire access | Exclude records without consent from the analytic workflow | Log excluded or inaccessible records in screening_log_v1.xlsx when retained in the platform export |
| Step 3 | Duplicate screening | Identify records sharing the same device-limited identifier or account-limited identifier within the same collection cycle and matching on sex, age, academic year, and at least 80% identical questionnaire responses | Retain the earliest complete record and exclude all later duplicates | Log excluded count and affected raw_record_id values in screening_log_v1.xlsx; assign primary exclusion_reason = 1 |
| Step 4 | Multiple-device duplicate reconciliation | Identify multiple complete submissions from the same authenticated participant account across different devices | Treat these records as duplicate submissions; retain the earliest complete record | Log the account-limited identifier and retained raw_record_id in screening_log_v1.xlsx; assign later records primary exclusion_reason = 1 |
| Step 5 | Completion-time screening | Identify all questionnaires with completion time <180 s | Exclude all such records automatically | Log excluded count in screening_log_v1.xlsx; assign primary exclusion_reason = 2 |
| Step 6 | Borderline-speed review | Identify all questionnaires with completion time 180–240 s | Review each record manually using attention-check, long-string, within-person SD, and logic flags; retain only if no additional flag is present | Record each case as retained_after_manual_review = 1 or excluded_after_manual_review = 1 in screening_log_v1.xlsx |
| Step 7 | Attention-check screening | Identify all records failing the directed-response attention-check item | Exclude all failed records not already excluded at an earlier step | Log excluded count in screening_log_v1.xlsx; assign primary exclusion_reason = 3 |
| Step 8 | Patterned-response screening | Identify records with 18 or more consecutive identical responses across the 36 scored scale items, or within-person SD ≤0.25 across those items | Exclude all such records not already excluded at an earlier step | Log excluded count in screening_log_v1.xlsx; assign primary exclusion_reason = 4 |
| Step 9 | Logical-consistency screening | Identify records showing the prespecified impossible behavioral combination: weekday_internet_use and weekend_internet_use both coded as <2 h, late_night_use coded as almost every night, and a score of 5 on at least 18 of the 20 IAT items | Exclude all such records not already excluded at an earlier step | Log excluded count and review note in screening_log_v1.xlsx; assign primary exclusion_reason = 5 |
| Step 10 | Core-missingness screening | Identify records with any missing value in IAT_1–IAT_20, DERS_1–DERS_16, age, sex, weekday_internet_use, weekend_internet_use, sleep_duration, physical_activity, or academic_stress; “prefer not to say” for sex is treated as a valid response, not as missing | Exclude all such records not already excluded at an earlier step | Log excluded count in screening_log_v1.xlsx; assign primary exclusion_reason = 6 |
| Step 11 | Primary exclusion assignment | Identify records meeting more than one exclusion criterion | Assign the first triggered criterion in the prespecified screening sequence as the primary exclusion reason | Record secondary flags in review notes only; do not assign multiple primary reasons |
| Step 12 | Technical identifier removal | Identify platform-generated response identifiers, device-limited identifiers, account-limited identifiers, timestamps, and any temporarily retained technical metadata in the cleaned file | Remove these fields from the final analytic dataset after screening is complete | Document removal in screening_log_v1.xlsx |
| Step 13 | Final retention | Retain all records that pass all prior screening steps | Assign one anonymous study ID to each retained record | Save as analytic_dataset_v1.csv and analytic_dataset_v1.xlsx |
| Step 14 | Screening summary | Count the number removed at each step and the final number retained | Summarize the final counts for manuscript reporting | Keep the counts in Table 2 identical to Figure 1 |
| Step 15 | Audit trail preservation | Preserve the raw file, screening log, and final analytic dataset as separate files | Do not overwrite, merge, or manually edit archived source files | Store in raw-data, screening, and analytic folders separately |
Table 2: Prespecified screening sequence, exclusion thresholds, screening actions, and documentation rules for questionnaire cleaning. This table summarizes the fixed screening order used to clean returned questionnaires, including consent and access checks, duplicate screening, multiple-device reconciliation, completion-time screening, borderline-speed review, attention-check failure, patterned responding, logical inconsistency, core missingness, technical identifier removal, final retention, and audit-trail preservation. Abbreviations: IAT = internet addiction test; DERS-16 = 16-item difficulties in emotion regulation scale. Please click here to download this Table.
5. Score variables, verify reliability, and prepare the analysis-ready file
- Generate total scores, subscale scores, and derived categorical variables
- Sum the 20 IAT item scores to generate the total internet addiction score, then store both the continuous score and the three-level severity class in the analysis-ready file.
- Reverse-code DERS-16 Items 1, 6, and 8, calculate the total score and five subscale scores, and append all derived variables to the same participant-level dataset.
- Run a range check before score calculation. Confirm that all IAT and DERS-16 item values fall within 1–5, all reverse-coded values fall within 1–5, IAT total scores fall within 20–100, and DERS-16 total scores fall within 16–80. Record the range-check output in the scoring log.
- Recode covariates into fixed analytic categories
- Recode weekday and weekend internet-use duration as <2 h, 2–3.9 h, 4–5.9 h, and ≥6 h. Recode late-night internet use as never, <1 night/week, 1–2 nights/week, 3–5 nights/week, and almost every night.
- Recode sleep duration, physical activity frequency, and perceived academic stress using the prespecified category rules defined in Section 1.4 and store the recoded values under fixed variable names in the same dataset.
- Recode sex for regression using two indicator variables: female versus male and prefer not to say versus male. Report the coding in the table footnote and README/codebook.
- Verify scoring integrity and internal consistency
- Calculate Cronbach’s alpha for the IAT total score and the DERS-16 total score before inferential analysis. Recheck item coding, reverse coding, and impossible item ranges if either alpha is <0.7020. Report the Cronbach’s alpha values in the Representative Results section.
- Calculate item-total correlations or alpha-if-item-deleted values if either scale shows unexpectedly low internal consistency. Do not remove scale items from the primary analysis unless item removal was prespecified or the study is explicitly designed as a psychometric validation study.
- Save the final analysis-ready dataset together with a README file listing variable names, coding rules, exclusion thresholds, file names, software versions, questionnaire version, scoring syntax, regression model specification, and procedures required to regenerate the same dataset.
6. Analyze the data and preserve reproducible outputs
- Generate descriptive statistics and group comparisons
- Report continuous variables as mean ± standard deviation and categorical variables as frequency and percentage. Summarize demographic characteristics, internet-use behavior, and scale scores using the predefined output structure.
- Report the sample size used for every analysis. Use the retained analytic sample as the denominator unless a table clearly states otherwise.
- Compare DERS-16 total and subscale scores across the three IAT severity groups and use two-sided testing with α = 0.05 for the primary analyses. Report standardized effect sizes where appropriate.
NOTE: For group comparisons, report η2 or partial η2 for analysis of variance, or an equivalent nonparametric effect size if a nonparametric test is used. Interpret severe problematic-use subgroup comparisons cautiously when the subgroup is small. - Calculate the Pearson correlation between IAT total score and DERS-16 total score when both variables show acceptable distributional behavior; otherwise, use Spearman correlation as a sensitivity analysis. Report n, r or ρ, 95% confidence interval if generated by the statistical software, p value, and interpretation of magnitude.
- Fit the adjusted regression model and archive outputs
- Use the DERS-16 total score as the dependent variable and the IAT total score as the primary independent variable. Enter age, sex, weekday internet use, weekend internet use, sleep duration, physical activity, and perceived academic stress as covariates. This model is the predefined analytic demonstration of the standardized workflow.
- Before interpreting the adjusted regression model, evaluate regression assumptions and model stability. Inspect residual-versus-fitted plots for linearity and homoscedasticity, inspect a Q-Q plot or normality test for residual distribution, and calculate variance inflation factors to assess multicollinearity.
- Report these diagnostics in the Representative Results section or supplementary analysis output.
- If residual heteroscedasticity is detected, report heteroscedasticity-robust standard errors as a sensitivity analysis.
- If influential observations are present, report whether the primary coefficient for the IAT total score remains materially unchanged after influence diagnostics. Do not remove influential observations unless a prespecified data-quality rule is met.
- Report unstandardized coefficients, standard errors, standardized coefficients, p values, model R2, adjusted R2, model F statistic, and VIF range for the adjusted model. Include the sample size in the table title or table footnote.
- If interactions, subgroup effects, or mediation pathways are tested, specify those analyses before data collection or label them as exploratory. The core protocol does not require interaction testing unless subgroup differences are a predefined study aim.
- Save all statistical syntax, output tables, residual plots, VIF output, reliability output, and generated figures under version-controlled file names. Regenerate all reportable outputs directly from analytic_dataset_v1 rather than from manually edited files.
NOTE: Keep the protocol text focused on workflow replication. Present the detailed representative statistics, subgroup figures, regression diagnostics, multicollinearity assessment, and model outputs in the Representative Results section.
Results
Study flow and final analytic retention
The results demonstrate the execution of the standardized questionnaire workflow rather than independent validation of the Internet addiction test or the DERS-16. During the 14-day survey window, 520 university students were invited to participate, and 480 questionnaires were returned. Screening was conducted in the prespecified order. First, 8 duplicate submissions were removed, followed by 9 questionnaires with a completion time of less than 180 s, 4 questionnaires that failed the directed-response attention-check item, 3 questionnaires showing patterned responding, 2 questionnaires with logical inconsistency, and 2 questionnaires with missing core data. After completion of the full screening sequence, 452 valid questionnaires were retained in the final analytic dataset. The final retention rate was 94.2% among returned questionnaires and 86.9% among invited students. The questionnaire flow from invitation to final analytic retention is presented in Figure 1.
Participant characteristics
The final analytic sample included 452 students, with a mean age of 20.41 ± 1.58 years. Female respondents constituted the larger share of the sample, including 279 female students, 167 male students, and 6 students selecting “prefer not to say.” Participants were drawn from all academic years and multiple disciplines, with second- and third-year students accounting for the largest proportions. Most respondents lived in on-campus dormitories, and monthly living expenses were concentrated in the 1,000–1,999 and 2,000–2,999 categories. The retained sample also showed substantial routine internet exposure. On weekdays, the distribution was centered mainly in the 2–3.9 h and 4–5.9 h categories, whereas weekend use shifted upward, with 322 of 452 students reporting at least 4 h per day. Smartphone access was the dominant access mode. The most frequently reported primary online activities were social media, entertainment/video, and study-related use. Late-night use after 23:00 was common, with 228 of 452 students reporting late-night use on at least 3 nights per week. Sleep duration was concentrated between 6 and 7.9 h, physical activity most often fell in the 1–2 sessions per week category, and moderate academic stress was the modal response. The demographic and behavioral profile of the retained sample is shown in Table 3.
| Characteristic | Category | n | % |
| Sex | Male | 167 | 36.9 |
| Female | 279 | 61.7 | |
| Prefer not to say | 6 | 1.3 | |
| Academic year | First year | 88 | 19.5 |
| Second year | 124 | 27.4 | |
| Third year | 131 | 29 | |
| Fourth year or above | 79 | 17.5 | |
| Postgraduate | 30 | 6.6 | |
| Discipline category | Humanities and social sciences | 118 | 26.1 |
| Science and engineering | 96 | 21.2 | |
| Business and management | 104 | 23 | |
| Arts and design | 82 | 18.1 | |
| Other | 52 | 11.5 | |
| Residence type | On-campus dormitory | 301 | 66.6 |
| Off-campus rental | 79 | 17.5 | |
| Family home | 58 | 12.8 | |
| Other | 14 | 3.1 | |
| Monthly living expenses, CNY | <1,000 | 61 | 13.5 |
| 1,000–1,999 | 176 | 38.9 | |
| 2,000–2,999 | 149 | 33 | |
| ≥3,000 | 66 | 14.6 | |
| Weekday internet use | <2 h | 52 | 11.5 |
| 2–3.9 h | 157 | 34.7 | |
| 4–5.9 h | 166 | 36.7 | |
| ≥6 h | 77 | 17 | |
| <2 h | 29 | 6.4 | |
| 2–3.9 h | 101 | 22.3 | |
| 4–5.9 h | 178 | 39.4 | |
| ≥6 h | 144 | 31.9 | |
| Primary online activity | Study | 74 | 16.4 |
| Social media | 126 | 27.9 | |
| Gaming | 61 | 13.5 | |
| Entertainment/video | 102 | 22.6 | |
| Shopping | 28 | 6.2 | |
| Mixed use | 47 | 10.4 | |
| Other | 14 | 3.1 | |
| Primary access device | Smartphone | 323 | 71.5 |
| Tablet | 18 | 4 | |
| Laptop/desktop | 67 | 14.8 | |
| Mixed devices | 44 | 9.7 | |
| Late-night use after 23:00 | Never | 48 | 10.6 |
| Less than once per week | 57 | 12.6 | |
| 1–2 nights/week | 119 | 26.3 | |
| 3–5 nights/week | 141 | 31.2 | |
| Almost every night | 87 | 19.2 | |
| Sleep duration | <6 h | 83 | 18.4 |
| 6–6.9 h | 146 | 32.3 | |
| 7–7.9 h | 157 | 34.7 | |
| ≥8 h | 66 | 14.6 | |
| Weekly physical activity | None | 91 | 20.1 |
| 1–2 sessions | 176 | 38.9 | |
| 3–4 sessions | 128 | 28.3 | |
| ≥5 sessions | 57 | 12.6 | |
| Academic stress | Low | 73 | 16.2 |
| Moderate | 241 | 53.3 | |
| High | 138 | 30.5 | |
| Age, years | Mean ± SD | 20.41 ± 1.58 | — |
Table 3: Baseline demographic and behavioral characteristics of the retained sample. This table presents the demographic profile and internet-use characteristics of the final retained sample after prespecified screening. Variables include sex, academic year, discipline category, residence type, monthly living expenses, weekday and weekend internet use, primary online activity, primary access device, late-night use after 23:00, sleep duration, weekly physical activity, academic stress, and age. Abbreviations: CNY = Chinese yuan; SD = standard deviation. Please click here to download this Table.
Internet addiction severity, emotion regulation outcomes, and reliability
In the full retained sample (n = 452), the mean Internet addiction test total score was 51.94 ± 16.58. Under the prespecified severity thresholds, 200 respondents were classified as normal users, 239 as problematic users, and 13 as severe problematic users, making the problematic-use group the largest subgroup. The mean DERS-16 total score in the retained sample was 35.95 ± 8.89. The Internet addiction test showed acceptable internal consistency, with a Cronbach’s alpha of 0.91, and the DERS-16 also showed acceptable internal consistency, with a Cronbach’s alpha of 0.88. When DERS-16 total scores were examined across the three IAT severity groups, the normal-use group had the lowest mean, the problematic-use group had a higher mean, and the severe problematic-use group had the highest mean. The group comparison for DERS-16 total score was statistically significant in the retained sample (n = 452; F = 72.80, p < 0.001; η2 = 0.245 ). The same directional pattern was visible in the DERS-16 subscale summaries. Because the severe problematic-use subgroup was small (n = 13), subgroup values are presented as part of the overall distributional pattern rather than as a basis for fine-grained severe-subgroup inference. Internet addiction severity and emotion-regulation outcomes are summarized in Table 4.
| Measure | Normal Use | Problematic Use | Severe Problematic Use | Total |
| n = 200 | n = 239 | n = 13 | n = 452 | |
| IAT total score | 34.20 ± 3.90 | 65.33 ± 6.90 | 78.70 ± 6.20 | 51.94 ± 16.58 |
| DERS-16 total score | 31.20 ± 7.10 | 39.24 ± 8.30 | 48.50 ± 9.60 | 35.95 ± 8.89 |
| DERS-16 nonacceptance | 5.90 ± 1.90 | 7.29 ± 2.10 | 8.90 ± 2.40 | 6.72 ± 2.16 |
| DERS-16 goals | 6.20 ± 1.80 | 7.82 ± 2.00 | 9.10 ± 2.30 | 7.14 ± 2.09 |
| DERS-16 impulse | 5.80 ± 1.70 | 7.72 ± 2.10 | 9.40 ± 2.50 | 6.92 ± 2.19 |
| DERS-16 strategies | 9.60 ± 2.90 | 12.29 ± 3.30 | 15.10 ± 3.80 | 11.18 ± 3.44 |
| DERS-16 clarity | 3.70 ± 1.30 | 4.18 ± 1.40 | 5.00 ± 1.60 | 3.99 ± 1.41 |
| IAT Cronbach’s alpha | — | — | — | 0.91 |
| DERS-16 Cronbach’s alpha | — | — | — | 0.88 |
| DERS-16 total group comparison | — | — | — | F = 72.80; p < 0.001; η² = 0.245 |
| Pearson correlation between IAT total and DERS-16 total | — | — | — | n = 452; r = 0.524; 95% CI: 0.45–0.59; p < 0.001 |
Table 4: Internet addiction severity groups, emotion-regulation outcomes, reliability, and correlation in the final analytic sample. This table reports IAT total scores, DERS-16 total scores, and DERS-16 subscale values across the normal-use, problematic-use, and severe problematic-use groups. It also reports the overall sample means, Cronbach’s alpha values for the IAT and DERS-16, the DERS-16 total score group comparison, and the Pearson correlation between IAT total score and DERS-16 total score. Abbreviations: IAT = internet addiction test; DERS-16 = 16-item difficulties in emotion regulation scale ; CI = confidence interval; SD = standard deviation. Please click here to download this Table.
Association between internet addiction and emotion regulation
The predefined continuous-score association was evaluated between the IAT total score and the DERS-16 total score in the retained analytic sample (n = 452). The Pearson correlation between IAT total score and DERS-16 total score was positive and moderate in magnitude (r = 0.524, 95% CI: 0.45–0.59, p < 0.001). Students with higher IAT total scores, therefore, tended to report greater overall difficulty in emotion regulation. This result was consistent with the severity-group distribution and did not depend solely on categorical IAT classification, as shown in Table 4.
Multivariable regression analysis
The adjusted regression model included the retained analytic sample (n = 452). DERS-16 total score was entered as the dependent variable, and IAT total score was entered as the primary independent variable. Age, sex, weekday internet use, weekend internet use, sleep duration, weekly physical activity, and academic stress were included as covariates in the same model. Sex was entered using prespecified indicator-variable coding, with male as the reference category and separate indicators for female and prefer not to say. After adjustment, the IAT total score remained positively associated with the DERS-16 total score (B = 0.21, SE = 0.02, β = 0.39, p < 0.001). Among the covariates, academic stress showed a positive association with DERS-16 total score (B = 2.36, β = 0.23, p < 0.001), whereas sleep duration (B = -1.12, β = -0.13, p < 0.001) and weekly physical activity (B = -0.84, β = -0.10, p = 0.003) were negatively associated with DERS-16 total score. Weekday internet use retained a smaller positive coefficient after adjustment (B = 0.71, β = 0.09, p = 0.015), whereas weekend internet use did not remain statistically robust in the adjusted model (B = 0.49, β = 0.07, p = 0.071). Age and both sex indicators were not significant independent predictors under the same specification. The model accounted for 39.8% of the variance in DERS-16 total score, with an adjusted R2 of 0.386, and the overall model was statistically significant, F(9, 442) = 32.47, p < 0.001. Multicollinearity was not evident, with variance inflation factors ranging from 1.03 to 1.42. Residual diagnostics did not show major violation of linearity or homoscedasticity on residual-versus-fitted inspection. The residual Q-Q plot showed no substantial departure from approximate normality. The Breusch-Pagan test was not statistically significant, p = 0.214. The maximum Cook’s distance was 0.18, and no observation exceeded a Cook’s distance of 0.50. The adjusted regression model is reported in Table 5.
| Predictor | B | SE | β | t | p | VIF |
| Constant | 18.42 | 2.11 | — | 8.73 | <0.001 | — |
| IAT total score | 0.21 | 0.02 | 0.39 | 9.84 | <0.001 | 1.42 |
| Age | 0.18 | 0.11 | 0.03 | 1.64 | 0.102 | 1.08 |
| Sex, female vs. male | 0.62 | 0.54 | 0.04 | 1.15 | 0.252 | 1.05 |
| Sex, prefer not to say vs. male | 0.28 | 1.89 | 0.01 | 0.15 | 0.882 | 1.03 |
| Weekday internet use | 0.71 | 0.29 | 0.09 | 2.45 | 0.015 | 1.36 |
| Weekend internet use | 0.49 | 0.27 | 0.07 | 1.81 | 0.071 | 1.31 |
| Sleep duration | -1.12 | 0.31 | -0.13 | -3.61 | <0.001 | 1.18 |
| Weekly physical activity | -0.84 | 0.28 | -0.1 | -3 | 0.003 | 1.12 |
| Academic stress | 2.36 | 0.39 | 0.23 | 6.05 | <0.001 | 1.27 |
Table 5: Multivariable linear regression of DERS-16 total score on IAT total score and covariates in the final analytic sample. This table presents the adjusted regression model with DERS-16 total score as the dependent variable and IAT total score as the primary independent variable. Age, sex, weekday internet use, weekend internet use, sleep duration, weekly physical activity, and academic stress were included as covariates. The table also reports standardized coefficients, variance inflation factors, and model diagnostics. Abbreviations: IAT = internet addiction test; DERS-16 = 16-item difficulties in emotion regulation scale ; VIF = variance inflation factor. Please click here to download this Table.
Supplementary Table 1: Full variable dictionary, file presence, coding structure, and data-management fields used in the standardized questionnaire workflow. This supplementary table provides the complete variable dictionary for the protocol, including ethics and consent variables, survey-setting variables, demographic variables, internet-use variables, quality-control flags, scale items, derived scores, covariates, technical identifier fields, dataset-tracking variables, file-status information, and coding rules. Abbreviations: IAT = internet addiction test; DERS-16 = 16-item difficulties in emotion regulation scale .Please click here to download this file.
Supplementary File 1: Supplementary questionnaire workflow materials. This supplementary file contains the questionnaire files, codebook, screening log, output plan, and analysis-ready workflow materials used to reproduce the standardized questionnaire-administration, screening, scoring, and analysis workflow.Please click here to download this file.
Discussion
The main contribution of this article is the standardized questionnaire workflow rather than the representative association observed between internet addiction and emotion-regulation difficulty. The implementation showed that a fixed sequence of electronic consent, demographic items, internet-use behavior, IAT scoring, DERS-16 scoring, covariate collection, sequential data-quality screening, and reproducible regression analysis can be executed in a university-student sample. This procedural emphasis is important because problematic internet use is often linked with emotional dysregulation in the literature, but inconsistent administration and cleaning procedures can make findings difficult to compare across studies21. The present workflow, therefore, supports comparability by making the order of measurement, exclusion rules, scoring steps, and analytic outputs explicit before interpretation begins.
Several procedural steps are especially critical for reproducibility. First, electronic consent must be completed before questionnaire access, and technical identifiers used for duplicate screening must be separated from the final anonymized analytical dataset. Second, duplicate screening should precede completion-time screening, attention-check review, patterned-response screening, logical-consistency review, and missingness checks, because changing this order can change the final retained sample. Third, the IAT and DERS-16 scoring procedures must be locked before data collection, including reverse coding and severity classification. These steps reduce avoidable variation in online survey research and are consistent with broader concerns that internet addiction findings can be affected by stress, self-control, and anxiety as well as by differences in measurement procedure22.
The protocol also requires several troubleshooting checks during implementation. If the survey platform cannot restrict repeated submissions, duplicate screening should rely on a combination of account-limited identifiers, device-limited identifiers, timestamps, questionnaire status, and response-pattern similarity. If many records fall within the borderline-speed range, the attention-check result, long-string response count, within-person standard deviation, and logical-consistency flag should be reviewed together rather than using completion time alone. If Cronbach’s alpha is unexpectedly low, item coding, reverse coding, and score ranges should be checked before any item-level decision is made. These procedures are particularly relevant because online and smartphone-related behaviors are associated with sleep and emotion-regulation processes, making careless screening or miscoding a potential source of distorted inference23.
The exclusion thresholds used in the representative implementation should be treated as standardized within this workflow but not universally fixed for all future populations. The 180-s lower completion-time threshold was derived from pilot testing and should be recalibrated when the protocol is applied to older adults, adolescents, multilingual respondents, accessibility-adapted questionnaires, or platforms with different display formats. The logical-inconsistency rule and patterned-response criteria may also require adjustment when scale length, item order, or response anchors differ. Similarly, the small, severe problematic-use subgroup in the representative implementation indicates that studies designed for subgroup comparisons should increase recruitment targets or use stratified sampling before data collection. Such flexibility is important because behavioral and lifestyle variables, including physical activity, may interact with attention, rumination, and self-regulation in ways that vary across student groups24.
Several limitations should be considered when applying this protocol. The workflow uses self-report instruments, so recall error, social desirability bias, and common-method variance may influence both the exposure and outcome measures. These risks can be reduced but not eliminated by using neutral wording, a fixed questionnaire order, attention checks, prespecified covariates, and transparent reporting of missingness and exclusions. Future studies may also incorporate objective digital behavior measures, such as smartphone screen time logs, app usage records, or platform-based usage summaries, to strengthen construct validity. However, these additions require separate consent language, privacy safeguards, data-minimization procedures, and linkage rules. They should therefore be added as planned protocol extensions rather than informal additions to the questionnaire workflow25.
The protocol is adaptable but should not be transferred mechanically to every setting. In non-university populations, eligibility criteria, recruitment channels, academic-stress items, and internet-use categories may need to be revised. In international multicenter studies, translation, cultural adaptation, platform equivalence, time-zone handling, data-protection rules, and site-level monitoring should be documented before pooling data. If the IAT is replaced by a newer or population-specific measure, the workflow can still be retained, but the score range, severity thresholds, codebook, syntax, Table of Materials, and supplementary variable dictionary should be updated before data collection. This distinction between internet-use duration and dysregulated use is important, because time online alone may not capture the same construct as problematic or compulsive use26.
Finally, the representative implementation was cross-sectional and should not be interpreted as evidence of temporal direction. The observed association between IAT total score and DERS-16 total score demonstrates how the analytic pathway operates, not whether emotion-regulation difficulty causes problematic internet use or whether problematic internet use worsens emotion regulation over time. Similar cross-sectional patterns have been reported in other university settings, but longitudinal or repeated-measure applications are needed to examine directionality and change27. The value of the present protocol is that it provides a stable baseline workflow for such future work. By standardizing consent, questionnaire administration, screening, scoring, reliability checks, model diagnostics, file archiving, and supplementary documentation, the protocol can support more reproducible cross-sectional studies and can be extended to longitudinal or intervention designs when temporal questions become the primary objective28. The inclusion of a codebook, screening log, output plan, and analysis-ready workflow materials is also consistent with FAIR-oriented research software and workflow documentation principles29 and with broader open-science recommendations for transparent and reproducible reporting30.
Disclosures
The author has nothing to disclose.
Acknowledgements
This work was supported by the 2025 Henan Province Soft Science Project, “Research on the Impact and Optimization Path of Changes in School Age Population on the High Quality Development of Private Higher Education in Henan Province” (Project No. 252400410490), and the 2025 Doctoral Research Fund Project of Zhengzhou University of Economics and Business, “Research on the Formation Mechanism and Public Sentiment Guidance Mechanism of College Students’ Network Cluster Behavior.” The author thanks Zhengzhou University of Economics and Business for institutional support.
Materials
| Name | Company | Catalog Number | Comments |
|---|---|---|---|
| Analysis-ready dataset | Study-specific internal document | analytic_dataset_v1.csv and analytic_dataset_v1.xlsx | Final anonymized dataset used for all reportable descriptive, reliability, correlation, and regression analyses |
| Analysis syntax | Study-specific internal document | analysis_syntax_v1.R or equivalent script file | Used to reproduce scoring verification, reliability checks, descriptive statistics, correlation analysis, regression modeling, VIF calculation, and diagnostic output |
| Attention-check item wording | Study-specific internal document | attention_check_v1.txt | Locked wording of the directed-response attention-check item used during questionnaire administration |
| DERS-16 questionnaire | Original scale source or authorized/adapted questionnaire version | 16-item Difficulties in Emotion Regulation Scale short form | Used to assess emotion-regulation difficulty; scoring follows the locked DERS-16 scoring key documented in the codebook |
| Electronic information sheet and consent page | Study-specific internal document | consent_form_v1.pdf or platform consent page | Used to provide study information and obtain electronic informed consent before questionnaire access |
| File naming convention sheet | Study-specific internal document | file_naming_convention_v1.xlsx | Used to standardize names for raw, cleaned, analytic, screening-log, codebook, and output files |
| Final questionnaire screenshots | Study-specific internal document | questionnaire_screenshots_v1.pdf | Used to document the locked survey display, item order, response anchors, and mandatory-item settings |
| Integrated development environment | Posit | RStudio Desktop | Used to manage scripts, logs, and reproducible analysis workflows |
| Internet Addiction Test questionnaire | Original scale source or authorized/adapted questionnaire version | 20-item Internet Addiction Test | Used to assess internet-addiction symptoms and classify normal use, problematic use, and severe problematic use |
| Online survey platform | Qualtrics | XM Platform; institutional or licensed account | Used to build the questionnaire, enforce mandatory items, manage consent-based access, restrict repeated submissions where enabled, and export response data |
| Optional menu-driven statistical package | IBM | SPSS Statistics | Used when a GUI-based analysis workflow is required for descriptive statistics, reliability checks, or regression analysis |
| README/codebook file | Study-specific internal document | README_v1.txt or codebook_v1.xlsx | Used to document variable names, coding rules, score ranges, reverse-coding rules, exclusion thresholds, file names, and software versions |
| Read-only archival copy | Portable document format | PDF/A or institution-approved archival PDF | Used to preserve the locked survey instrument, consent page, and protocol-supporting documents |
| Screening log workbook | Study-specific internal document | screening_log_v1.xlsx | Used to document duplicate screening, completion-time screening, attention-check failures, patterned responding, logical inconsistency, missingness, manual review decisions, and final retained counts |
| Spreadsheet software | Microsoft | Microsoft Excel workbook format (.xlsx) | Used for screening logs, variable dictionary, manual review records, and supplementary workbook preparation |
| Statistical computing environment | R Foundation / CRAN | R 4.5.3 | Used for scoring verification, descriptive statistics, reliability checks, correlation analysis, regression analysis, VIF calculation, and diagnostic output |
| Supplementary File 1 | Study-specific supplementary file | Supplementary File 1.xlsx | Contains questionnaire workflow materials, codebook, screening log, output plan, and analysis-ready workflow materials |
| Supplementary Table S1 | Study-specific supplementary table | Supplementary Table S1 | Provides the complete variable dictionary, file presence, coding structure, technical identifier fields, screening variables, and dataset-tracking fields |
| Survey export document | Qualtrics | Survey-to-Word export or PDF export | Used to archive the final questionnaire wording, item order, branching settings, mandatory-item settings, and response coding |
| Survey export format | Qualtrics | CSV export | Used for raw return preservation and analysis-ready data export |
References
- Moreno MA, et al. Problematic internet use among US youth: a systematic review. Arch Pediatr Adolesc Med. 2011;165:797-805.
- Ramón-Arbués E, et al. Prevalence and factors associated with problematic internet use in a population of Spanish university students. Int J Environ Res Public Health. 2021;18:7620.
- Cai Z, et al. Associations between problematic internet use and mental health outcomes of students: a meta-analytic review. Adolesc Res Rev. 2023;8:45-62.
- Gong Z, Wang L, Wang H. Perceived stress and internet addiction among Chinese college students: mediating effect of procrastination and moderating effect of flow. Front Psychol. 2021;12:632461.
- Tsai JK, et al. Relationship between difficulty in emotion regulation and internet addiction in college students: a one-year prospective study. Int J Environ Res Public Health. 2020;17:4766.
- Romero-López M, Pichardo C, De Hoces I, García-Berbén T. Problematic internet use among university students and its relationship with social skills. Brain Sci. 2021;11:1301.
- Xie X, et al. Problematic internet use was associated with psychological problems among university students during COVID-19 outbreak in China. Front Public Health. 2021;9:675380.
- Montagni I, et al. Mental health-related digital use by university students: a systematic review. Telemed J E Health. 2020;26:131-146.
- Candussi CJ, Kabir R, Sivasubramanian M. Problematic smartphone usage, prevalence and patterns among university students: a systematic review. J Affect Disord Rep. 2023;14:100643.
- Moon SJ, Hwang JS, Kim JY, Shin AL, Bae SM, Kim JW. Psychometric properties of the Internet Addiction Test: a systematic review and meta-analysis. Cyberpsychol Behav Soc Netw. 2018;21:473-484.
- Jelenchick LA, Becker T, Moreno MA. Assessing the psychometric properties of the Internet addiction test in US college students. Psychiatry Res. 2012;196:296-301.
- Tafur-Mendoza AA, Acosta-Prado JC, Zárate-Torres RA, Ramírez-Ospina DE. Assessing the psychometric properties of the Internet addiction test in Peruvian university students. Int J Environ Res Public Health. 2020;17:5782.
- Fernández-Villa T, Molina AJ, García-Martín M, Llorca J, Delgado-Rodríguez M, Martín V. Validation and psychometric analysis of the Internet addiction test in Spanish among college students. BMC Public Health. 2015;15:953.
- World Medical Association. World Medical Association Declaration of Helsinki: ethical principles for medical research involving human subjects. JAMA. 2013;310:2191-2194.
- Wei Z, Hassan NC, Hassan SA, Ismail N, Gu X, Dong J. Psychometric validation of Young’s Internet addiction test among Chinese undergraduate students. PLoS One. 2025;20:e0320641.
- Bjureberg J, et al. Development and validation of a brief version of the Difficulties in emotion regulation scale : the DERS-16. J Psychopathol Behav Assess. 2016;38:284-296.
- Muszyński M. Attention checks and how to use them: review and practical recommendations. ASK: Research and Methods. 2023;32:3-38.
- Broman KW, Woo KH. Data organization in spreadsheets. Am Stat. 2018;72:2-10.
- Leiner DJ. Too fast, too straight, too weird: non-reactive indicators for meaningless data in internet surveys. Surv Res Methods. 2019;13:229-248.
- Taber KS. The use of Cronbach’s alpha when developing and reporting research instruments in science education. Res Sci Educ. 2018;48:1273-1296.
- Gioia F, Rega V, Boursier V. Problematic Internet use and emotional dysregulation among young people: a literature review. Clin Neuropsychiatry. 2021;18:41-54.
- Chen M, Zhang X. Factors influencing internet addiction among university students: the mediating roles of self-control and anxiety. Acta Psychol (Amst). 2024;250:104535.
- Akbari M, Seydavi M, Sheikhi S, Spada MM. Problematic smartphone use and sleep disturbance: the roles of metacognitions, desire thinking, and emotion regulation. Front Psychiatry. 2023;14:1137533.
- Wang S, Cheng Y, Yang Y, Lu B. The impact of physical activity on internet addiction among college students: the chain mediation role of rumination and mindfulness. BMC Public Health. 2025;25:3643.
- Struminskaya B, Sakshaug JW. Ethical considerations for augmenting surveys with auxiliary data sources. Public Opin Q. 2023;87:619-633.
- Yin J, et al. Associations between both smartphone addiction and objectively measured smartphone use and sleep quality and duration among university students: a cross-sectional study. JMIR Ment Health. 2025;12:e77796.
- Hainagiu SM, Neagu SN. Caught in the Web—emotional regulation difficulties and internet addiction among Romanian medical and technical university students: a pilot cross-sectional study. Healthcare (Basel). 2025;13:2528.
- Guo C, Chen M, Ji X, Li J, Ma Y, Zang S. Association between internet addiction and sleep quality in medical students: a longitudinal study. Front Psychol. 2025;16:1517590.
- Barker M, Chue Hong NP, Katz DS, Lamprecht AL, Martinez-Ortiz C, Psomopoulos F, et al. Introducing the FAIR Principles for research software. Sci Data. 2022;9:622.
- Nosek BA, Alter G, Banks GC, Borsboom D, Bowman SD, Breckler SJ, et al. Promoting an open research culture. Science. 2015;348:1422-1425.