This is a cross-sectional study that included 431 female university students aiming to assess physical activity patterns and their associated factors. Physical inactivity was prevalent, and regular exercise, activity duration, and sedentary behavior were important factors associated with weekly participation in vigorous, moderate, and walking activities.
Research Article
Physical Activity Patterns and Associated Factors Among First-Year Female University Students in Saudi Arabia: A Cross-Sectional Study
In This Article
Summary
Abstract
The World Health Organization (WHO) recommends at least 150 min of moderate-intensity or 75 min of vigorous-intensity physical activity (PA) per week for adults. In Saudi Arabia, over 70% of young adults are physically inactive. This study aimed to describe PA patterns among first-year Saudi female university students and determine factors that are associated with weekly participation in vigorous PA using convenience sampling. Participants completed an anonymous online survey after providing their informed consent. The survey comprised: i) demographic information, ii) PA level assessment using the International Physical Activity Questionnaire short form, and iii) exercise environments. Of the 431 students (mean age 19 ± 0.64 years) who participated in the study, 40% reported no regular PA. Walking was the most common activity type (32.56%), followed by home (16.63%) and gym (10.16%) exercises. Among the students, 38.75% reported no participation in vigorous PA, 30.40% in moderate activity, and 21.81% in daily walking. The majority of students (92.5%) reported sitting for >8 h per day. The regression analyses showed that vigorous activity frequency was positively associated with regular exercise pattern (standardized β = 0.389, p < 0.001) and negatively with weekday sitting time (standardized β = −0.149, p = 0.001). Moderate PA was associated only with the exercise pattern (standardized β = 0.265, p < 0.001). Walking frequency was associated with longer walking duration (standardized β = 0.232, p < 0.001) and exercise pattern (standardized β = 0.151, p = 0.001). Physical inactivity was prevalent, with limited engagement in moderate- and vigorous-intensity activity. The study’s findings support institutional actions that prioritize PA promotion particularly for female college students. Academic institutions should implement targeted strategies to reduce sedentary behavior and promote structured PA programs, particularly for female students.
Introduction
WHO recommends at least 150 min of moderate-intensity activity or 75 min of vigorous-intensity activity per week for adults aged 18 and older1. However, more than one-third of adults aged 18 and older worldwide do not meet these PA recommendations2,3. This has led to an alarming increase in physical inactivity, especially in high-income countries, where lifestyle changes have led to rising obesity and related health issues4–6.
In Saudi Arabia, physical inactivity remains a major public health issue, with current national estimates indicating that more than half of Saudi adults have insufficient PA levels, although prevalence estimates vary according to the population studied, the year of data collection, and the criteria used to define physical inactivity3. Previous published studies among Saudi young adults have reported high rates of physical inactivity that fall below the WHO PA recommendations7–11. Some studies identified barriers to engaging in PA among young Saudi adults, including lack of time, motivation, and access to recreational facilities8,12. In addition to the transition to a more sedentary lifestyle, a strong emphasis on cultural gender roles and expectations may also restrict women's participation in PA, leading to greater sedentary behavior among women than men in many societies4,13. Similar to global trends, in Saudi Arabia, women have consistently reported lower engagement in PA than men9,11. However, a recent shift has been observed in Saudi Arabia toward PA policy. The most apparent change was in the culture shift permitting women’s sports activities14. For example, national data from 2021 showed that 38.7% of Saudi females aged 15 years and older participated in PA, representing an improvement when compared with 2018 and 2019 data15. More recent data from Saudi Arabia showed that only 43.1% of Saudi women meet the WHO PA recommendations compared to 66.5% of men meeting these PA recommendations9.
The transition from high school to university is a critical period for individuals. This transition is marked by increased academic demands, greater independence, and changes in daily routines, all of which may influence PA level and sedentary behavior in new university students16–18. A recent systematic review of 44 studies involving 29,580 Saudi college students found consistently low levels of PA, with only 27% meeting WHO-recommended PA cutoffs19. Moreover, first-year university students are more vulnerable to unhealthy behaviors such as insufficient PA and smoking20. In addition, it has been reported that culture and environmental factors may explain the gap between women's and men's PA levels21. Not prioritizing exercise, lack of time, engagement in housework and daily activities, and lack of motivation and interest are the most reported personal factors impacting PA levels among women13,22.
Fitness facilities provide a structured environment rich with resources that can enhance motivation and facilitate various forms of exercise; in addition, the social aspects of the fitness facilities environment, including interaction with peers and access to group fitness classes, significantly enhance motivation and adherence to exercise routines23,24. While exercising at home is convenient and accessible, allowing young adults to engage in PA without the time constraints of traveling to the gym, prior studies indicate that gym-based exercise is significantly associated with PA levels22,25,26. Access to supportive exercise environments, including appropriate facilities and opportunities for PA, has been associated with greater participation in PA among adults25,26. Women represent the fastest-growing segment in the Saudi fitness club, with a major increase expected between 2026 and 2031.
Regarding cultural PA-related barriers, a recent systematic review suggested that cultural differences and variations in educational systems may lead to PA disparities among university students from different countries27. Since many university students experience increased academic demands and limited time for exercise, understanding the factors associated with PA during this transition is important. PA is known to be associated with physical health and quality of life among university students28,29. Therefore, first-year university students represent an important population and are worth investigating in terms of their PA behavior.
Understanding factors associated with PA participation among first-year female university students is important for developing targeted health promotion strategies during the transition to university life27. Although previous studies have reported the prevalence of physical inactivity among Saudi university students7–10,16, limited evidence has examined potential factors associated with different components of PA among first-year female university students. Understanding these factors may help inform the future development of targeted PA promotion strategies for young adults. The primary aim of this study was to describe PA patterns among first-year Saudi female university students. A secondary aim of this study was to examine whether age, exercise regularity, exercise duration (minutes per day), and sedentary behavior (minutes per day) are associated with weekly participation in vigorous-, moderate-, and walking-related PA. It was hypothesized that demographic and lifestyle characteristics, including age, exercise behavior, activity duration, and sedentary time, would be associated with vigorous, moderate, and walking-related PA among first-year female university students.
Protocol
Study design
This study employed a cross-sectional design to assess PA levels among first-year female university students in Saudi Arabia. The cross-sectional design was chosen to enable the assessment of PA behaviors and related factors at a single time point during the first year of university, a period known to be associated with changes in lifestyle and health behaviors. It was conducted in accordance with the ethical principles outlined in the Declaration of Helsinki and was approved by the Ethics Committee of Princess Nourah bint Abdulrahman University, Riyadh, Kingdom of Saudi Arabia (IRB Log Number: 24-0218; Approval date February 01, 2024).
Details of the materials and software used in this study are provided in the Table of Materials.
Study participants
The target population consisted of first-year female university students enrolled in Saudi Arabian universities during the 2024 academic year. The inclusion criteria for this study were as follows: participants must be first-year university students aged 18–21 years, residing in Saudi Arabia, and willing to participate by providing informed consent. Students who had been diagnosed with medical conditions that are known as contraindications for engagement in PA (such as severe cardiovascular disorders, musculoskeletal impairments, or post-surgical conditions), those with disabilities limiting mobility, or those who provided incomplete questionnaire responses were excluded from participation.
Sampling method
Convenience sampling was employed by distributing the survey link through official university mailing lists, academic platforms, and widely used student social media groups across Saudi Arabia. This approach, although non-random, was aimed at maximizing reach and obtaining responses from diverse geographic and demographic segments of first-year students.
Sample size calculation
The total population of first-year university students in Saudi Arabia in 2023 was 362,23130. To ensure sufficient statistical power, the sample size was calculated using an online epidemiological sample size calculator (OpenEpi software), with a 95% confidence level, a 5% margin of error, and an assumed response distribution of 50%. The minimum required sample size was determined to be 384 respondents. The sample size calculation was based on the descriptive objective of estimating the prevalence of PA.
Data collection tool
Data were collected using a structured, self-administered online survey through a web-based survey platform (Google Forms). The survey began with an introductory page outlining the study’s purpose, the voluntary nature of participation, assurances of confidentiality, and contact details for further inquiries. Informed consent was obtained at the start of the survey. To prevent duplication, submissions were limited to one response per user through the survey-platform settings.
PA was assessed using the International Physical Activity Questionnaire–Short Form (IPAQ-SF) among first-year students31,32. The IPAQ-SF is a standardized self-report instrument developed for assessing PA in individuals aged 15 years and older31,32. The Arabic version of the IPAQ-SF was administered to participants and has been used in previous studies conducted in Saudi Arabia, including studies involving university students19,33–35. The IPAQ-SF assesses the number of days and time (minutes) per week participants engaged in vigorous-intensity physical activity, moderate-intensity physical activity, and walking for at least 10 min per occasion31. The present study focused on frequency of participation (days per week) and PA volume (minutes per day) for vigorous-intensity physical activity, moderate-intensity physical activity, and walking31. IPAQ-SF data were processed in accordance with the official IPAQ scoring protocol. Activity bouts shorter than 10 min were excluded. Extreme duration values were truncated according to IPAQ data-processing guidelines, and implausible activity values were identified and removed during data cleaning. For participants reporting zero days of vigorous-intensity, moderate-intensity, or walking activity, the corresponding duration variables were recorded as 0 min.
Because activity frequency and activity duration describe related dimensions of the same PA behavior, these variables may exhibit conceptual overlap when included simultaneously in regression models. Therefore, the duration coefficients were interpreted as conditional associations rather than evidence of independent causal effects. The same consideration applies to the exercise-pattern variable, which represents a general pattern of PA and may overlap conceptually with the activity-frequency outcomes.
Furthermore, questions were added to evaluate participants’ self-satisfaction regarding their current PA levels (yes/no-based responses) and their regular pattern of PA, including walking, exercising at home, exercising at a gym or not practicing regular PA. Demographic data were collected, including age, gender, university affiliation, year of study, presence of chronic diseases, and health issues that could contraindicate or limit daily activities.
The questionnaire included a multiple-choice item asking participants to indicate their usual exercise pattern, with four mutually exclusive response options: (1) not practicing PA regularly, (2) practicing walking only, (3) exercising primarily at home, and (4) exercising primarily at a gym. This variable was treated as a categorical independent variable in the regression analyses, with "not practicing PA regularly" used as the reference category. A pilot test was conducted with five first-year female students to assess the clarity and comprehensibility of the questionnaire. The pilot participants were not included in the final analytic sample. Feedback confirmed that the questionnaire was clear and understandable, and no substantive modifications were required.
Procedure
An online survey was conducted between May and June 2024. All responses were collected anonymously and stored securely in a password-protected database accessible only to the research team. After data collection was completed, responses were reviewed for completeness, and those with significant missing data or inconsistent answers were excluded from the final analysis. Because only complete questionnaires were included, no imputation of missing data was performed, and no formal missing data analysis was required.
Data analysis
Statistical analyses were performed using statistical software (SPSS statistics). Descriptive analyses were used to report frequencies and percentages for all PA variables, as well as the mean and standard deviation for participants’ ages. The associations between PA types (vigorous-intensity PA, moderate-intensity PA, and walking) and duration (minutes per day), age, exercise pattern, and weekday sitting time were examined using multiple linear regression. Regression diagnostics were assessed for homoscedasticity, linearity, residual normality, and multicollinearity using normal probability plots, histograms, and scatter plots. The statistical significance for all analyses was set a priori at p < 0.05.
Exercise patterns were entered into the regression models as a categorical independent variable using dummy coding. The four mutually exclusive categories were walking only, home-based exercise, gym-based exercise, and not practicing PA regularly. Participants who did not practice PA regularly were used as the reference category; therefore, three dummy variables were included in each regression model (walking vs. no regular exercise, home-based exercise vs. no regular exercise, and gym-based exercise vs. no regular exercise). Dummy coding was automatically generated using the categorical variable function in the statistical software. Multicollinearity among the independent variables was assessed using variance inflation factors (VIFs), and no evidence of problematic multicollinearity was identified.
Results
A total of 597 individuals accessed the survey, of whom 501 provided consent and completed the questionnaire. Following application of the eligibility criteria, 431 participants were included in the final analysis (Figure 1). None of the participants reported being diagnosed with medical conditions that are known as contraindications for engaging in PA or disabilities that could limit mobility. The participants’ mean age was 19 years ± 0.64 years (Table 1).
Relationship between vigorous-intensity PA frequency and duration, age, exercise pattern, and weekday sitting time
Table 2 presents a multiple linear regression analysis that was conducted to examine the associations between the number of days of vigorous-intensity PA per week and vigorous-intensity activity duration, age, exercise pattern, and weekday sitting time. Exercise pattern was represented by three dummy variables, with participants who did not practice PA regularly serving as the reference group. The overall regression model was statistically significant, F(6,424) = 16.943, p < 0.001, explaining 19.3% of the variance in vigorous-intensity PA (R² = 0.193; adjusted R² = 0.182). Compared with participants who did not practice PA regularly, those who reported walking only (B = 1.204, 95% CI [0.802, 1.605], p < 0.001), exercising at home (B = 1.535, 95% CI [1.040, 2.031], p < 0.001), or exercising at a gym (B = 2.331, 95% CI [1.727, 2.935], p < 0.001) reported a greater number of vigorous-intensity activity days per week. Weekday sitting time was inversely associated with vigorous-intensity activity frequency (B = −0.178, 95% CI [−0.285, −0.071], p = 0.001). Vigorous-intensity activity duration (B = 0.257, p = 0.123) and age (B = 0.148, p = 0.278) were not statistically significant predictors.
Relationship between moderate-intensity PA frequency and duration, age, exercise pattern, and weekday sitting time
Table 3 presents a multiple linear regression analysis that was conducted to examine the associations between the number of days of moderate-intensity PA per week and moderate-intensity activity duration, age, exercise pattern, and weekday sitting time. Exercise pattern was represented by three dummy variables, with participants who did not practice PA regularly serving as the reference group. The overall regression model was statistically significant, F(6,424) = 7.813, p < 0.001, explaining 10.0% of the variance in moderate-intensity PA frequency (R² = 0.100; adjusted R² = 0.087). Compared with participants who did not practice PA regularly, those who reported walking only (B = 1.080, 95% CI [0.662, 1.499], p < 0.001), exercising at home (B = 1.286, 95% CI [0.770, 1.803], p < 0.001), or exercising at a gym (B = 1.334, 95% CI [0.706, 1.961], p < 0.001) reported a greater number of moderate-intensity PA days per week. Age (B = 0.184, p = 0.197), weekday sitting time (B = −0.030, p = 0.591), and moderate-intensity activity duration (B = 0.405, p = 0.185) were not statistically significant predictors.
Relationship between walking frequency and duration, age, exercise pattern, and sitting time
Table 4 shows a multiple linear regression analysis that was conducted to examine the associations between the number of days participants walked for at least 10 min per week and walking duration, age, exercise pattern, and weekday sitting time. Exercise pattern was represented by three dummy variables, with participants who did not practice PA regularly serving as the reference group. The overall regression model was statistically significant, F(6,424) = 10.825, p < 0.001, explaining 13.3% of the variance in walking frequency (R² = 0.133; adjusted R² = 0.121). Compared with participants who did not practice PA regularly, those who reported walking only (B = 1.531, 95% CI [1.028, 2.035], p < 0.001), exercising at home (B = 0.835, 95% CI [0.214, 1.456], p = 0.009), or exercising at a gym (B = 0.945, 95% CI [0.195, 1.694], p = 0.014) reported a greater number of walking days per week. Walking duration was also positively associated with walking frequency (B = 0.922, 95% CI [0.549, 1.294], p < 0.001). Age (B = −0.162, p = 0.344) and weekday sitting time (B = −0.035, p = 0.603) were not statistically significant predictors.
DATA AVAILABILITY:
The de-identified dataset supporting the findings of this study is publicly available through the Zenodo repository at [DOI:10.5281/zenodo.22117075].
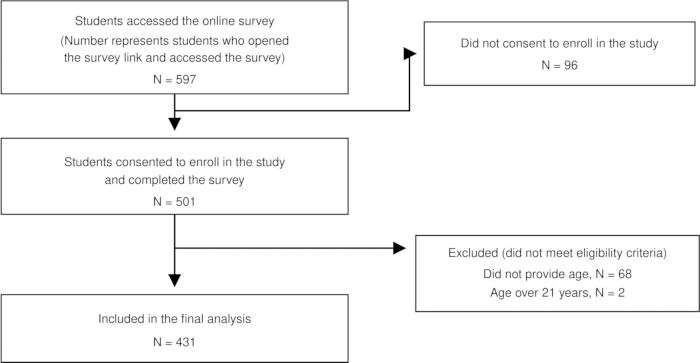
Figure 1: Flow diagram of participant recruitment and inclusion. The online survey was distributed through university mailing lists, academic platforms, and student social media groups. Because the total number of students who received the survey invitation was unknown, a true response rate could not be calculated. Please click here to view a larger version of this figure.
| Variable | Category | n | % |
| Age (years) | Mean ± SD | 19 ± 0.64 | |
| Range | 18–21 | ||
| Regular exercise | No | 175 | 40.6 |
| Yes, walking | 140 | 32.5 | |
| Yes, at home | 72 | 16.7 | |
| Yes, at gym | 44 | 10.2 | |
| Vigorous-intensity physical activity (days/week) | None | 167 | 38.7 |
| 1 day | 62 | 14.4 | |
| 2 days | 49 | 11.4 | |
| 3 days | 52 | 12.1 | |
| 4 days | 55 | 12.8 | |
| 5 days | 24 | 5.6 | |
| 6 days | 7 | 1.6 | |
| 7 days | 15 | 3.5 | |
| Moderate-intensity physical activity (days/week) | None | 131 | 30.4 |
| 1 day | 75 | 17.4 | |
| 2 days | 48 | 11.1 | |
| 3 days | 65 | 15.1 | |
| 4 days | 64 | 14.8 | |
| 5 days | 25 | 5.8 | |
| 6 days | 7 | 1.6 | |
| 7 days | 16 | 3.7 | |
| Walking ≥ 10 min (days/week) | None | 54 | 12.5 |
| 1 day | 55 | 12.8 | |
| 2 days | 36 | 8.4 | |
| 3 days | 61 | 14.2 | |
| 4 days | 59 | 13.7 | |
| 5 days | 56 | 13 | |
| 6 days | 16 | 3.7 | |
| 7 days | 94 | 21.8 | |
| Regular exercise pattern | Not practicing activity regularly | 175 | 40.6 |
| Walking | 140 | 32.6 | |
| Exercise at home | 72 | 16.6 | |
| Exercise at gym | 44 | 10.2 | |
| Time spent sitting on a typical weekday | 30 min–2 hours | 5 | 1.2 |
| 2.5–4 hours | 5 | 1.2 | |
| 4.5–6 hours | 9 | 2.1 | |
| 6.5–8 hours | 13 | 3 | |
| >8 hours | 399 | 92.5 |
Table 1: Sociodemographic and physical activity characteristics of participants (n = 431). Continuous data are presented as mean ± standard deviation (SD), and categorical data are presented as frequency (n) and percentage (%).
| Model | Unstandardized Coefficients | Standardized Coefficients | t | p | 95.0% CI for B | Collinearity Statistics | ||||
| B | SE | Beta | Lower Bound | Upper Bound | Tolerance | VIF | ||||
| 1 | (Constant) | -1.795 | 2.612 | -0.687 | 0.492 | -6.929 | 3.34 | |||
| Walking vs. no regular exercise | 1.204 | 0.204 | 0.284 | 5.896 | 0 | 0.802 | 1.605 | 0.819 | 1.22 | |
| Home vs. no regular exercise | 1.535 | 0.252 | 0.289 | 6.091 | 0 | 1.04 | 2.031 | 0.847 | 1.181 | |
| Gym vs. no regular exercise | 2.331 | 0.307 | 0.356 | 7.585 | 0 | 1.727 | 2.935 | 0.865 | 1.155 | |
| Vigorous-intensity physical activity duration | 0.257 | 0.167 | 0.069 | 1.543 | 0.123 | -0.07 | 0.584 | 0.94 | 1.064 | |
| Age | 0.148 | 0.136 | 0.048 | 1.086 | 0.278 | -0.12 | 0.416 | 0.992 | 1.008 | |
| Sitting time | -0.178 | 0.054 | -0.145 | -3.271 | 0.001 | -0.285 | -0.071 | 0.964 | 1.037 | |
Table 2: Relationship between vigorous-intensity physical activity frequency and vigorous-intensity physical activity duration, age, exercise pattern, and sitting time. The dependent variable was the number of days during the past seven days on which participants engaged in vigorous-intensity physical activity. Abbreviations: PA = physical activity; CI = confidence interval; VIF = variance inflation factor.
| Model | Unstandardized Coefficients | Standardized Coefficients | t | p | 95.0% CI for B | Collinearity Statistics | ||||
| B | SE | Beta | Lower Bound | Upper Bound | Tolerance | VIF | ||||
| 1 | (Constant) | -2.131 | 2.725 | -0.782 | 0.435 | -7.487 | 3.225 | |||
| Walking vs. no regular exercise | 1.08 | 0.213 | 0.258 | 5.077 | 0 | 0.662 | 1.499 | 0.82 | 1.219 | |
| Home vs. no regular exercise | 1.286 | 0.263 | 0.245 | 4.894 | 0 | 0.77 | 1.803 | 0.847 | 1.18 | |
| Gym vs. no regular exercise | 1.334 | 0.319 | 0.206 | 4.178 | 0 | 0.706 | 1.961 | 0.872 | 1.146 | |
| Age | 0.184 | 0.142 | 0.06 | 1.292 | 0.197 | -0.096 | 0.463 | 0.992 | 1.008 | |
| Sitting time | -0.03 | 0.057 | -0.025 | -0.538 | 0.591 | -0.142 | 0.081 | 0.967 | 1.034 | |
| Moderate-intensity physical activity duration | 0.405 | 0.305 | 0.063 | 1.328 | 0.185 | -0.194 | 1.004 | 0.946 | 1.057 | |
Table 3: Relationship between moderate-intensity physical activity frequency and moderate-intensity physical activity duration, age, exercise pattern, and sitting time. The dependent variable was the number of days during the past seven days on which participants engaged in moderate-intensity physical activity. Abbreviations: PA = physical activity; CI = confidence interval; VIF = variance inflation factor.
| Model | Unstandardized Coefficients | Standardized Coefficients | t | p | 95.0% CI for B | Collinearity Statistics | ||||
| B | SE | Beta | Lower Bound | Upper Bound | Tolerance | VIF | ||||
| 1 | (Constant) | 5.92 | 3.277 | 1.806 | 0.072 | -0.522 | 12.361 | |||
| Walking vs. no regular exercise | 1.531 | 0.256 | 0.299 | 5.977 | 0 | 1.028 | 2.035 | 0.818 | 1.222 | |
| Home vs. no regular exercise | 0.835 | 0.316 | 0.13 | 2.642 | 0.009 | 0.214 | 1.456 | 0.848 | 1.179 | |
| Gym vs. no regular exercise | 0.945 | 0.381 | 0.119 | 2.477 | 0.014 | 0.195 | 1.694 | 0.884 | 1.132 | |
| Age | -0.162 | 0.171 | -0.043 | -0.947 | 0.344 | -0.498 | 0.174 | 0.991 | 1.009 | |
| Sitting time | -0.035 | 0.068 | -0.024 | -0.521 | 0.603 | -0.17 | 0.099 | 0.966 | 1.035 | |
| Walking duration | 0.922 | 0.189 | 0.225 | 4.866 | 0 | 0.549 | 1.294 | 0.959 | 1.043 | |
Table 4: Relationship between walking frequency and walking duration, age, exercise pattern, and sitting time. The dependent variable was the number of days during the past seven days on which participants walked for at least 10 min at a time. Abbreviations: CI = confidence interval; VIF = variance inflation factor.
Discussion
This study provides important results regarding PA patterns and their behavioral and environmental associations among first-year female university students in Saudi Arabia. The present study extends previous work by focusing specifically on first-year female university students, a transitional stage during which lifestyle behaviors are established, and by examining exercise patterns and the association of sedentary behavior with the frequency of participation in vigorous PA, moderate PA, and walking. Overall, the findings demonstrate that PA behaviors among first-year female university students are shaped primarily by regular engagement in exercise environments and selected behavioral factors rather than by age. Notably, a substantial proportion of the included sample reported physical inactivity (81.58%). Among those who reported being involved in regular activity, walking was the most reported activity, followed by home-based and gym-based exercises. These findings are consistent with previous published research highlighting low levels of PA among young adults in Saudi Arabia, particularly among women9–11,16. Furthermore, the results indicated limited engagement in moderate- and vigorous activity, with a considerable proportion of students reporting no participation at all in these PA intensities. This aligns with other research emphasizing a decline in PA levels due to transitioning from adolescence to university life, where academic demands, lack of facilities, and/or cultural and social factors are common6,10,12,13,18.
In comparison with Saudi-based evidence, the findings are consistent with prior studies reporting low PA engagement among female university students, with inactivity remaining disproportionately high in this subgroup9–11,16. This pattern also conforms with national survey analyses indicating that Saudi women are significantly less likely to meet PA recommendations than men, reflecting persistent gender disparities in activity behavior9. Additionally, a recent Saudi university-focused synthesis reported that a substantial proportion of university students failed to meet WHO PA recommendations, with female students demonstrating particularly low adherence19. Low engagement in moderate- to vigorous-intensity PA is reported globally, particularly during the transition into higher education, which is frequently associated with decreased PA18. This result is mirrored in the present sample, providing more evidence in this critical stage of transition for new students. The high proportion of physically inactive participants observed in this study reflects broader national and cultural trends. Insufficient time, low motivation, cultural and social restrictions, health issues, inadequate knowledge, and environmental factors may contribute to this pattern9,13,22. Furthermore, traditional gender roles may discourage female students from engaging in gym-based activities, despite their clear benefits in promoting higher-intensity exercise36. The limited availability of university-based exercise facilities and the absence of mandatory physical education programs may contribute to students’ sedentary lifestyles. As previous research has indicated, cultural attitudes toward female PA and a lack of structured exercise opportunities significantly hinder young women’s engagement in regular PA9. A recent systematic review among university students noted that barriers to PA include a lack of time, motivation, and facilities. Conversely, facilitators consist of health benefits, social support, and weight management19. Exercise patterns showed the strongest association with vigorous-intensity PA, whereas weekday sitting time was inversely associated with vigorous activity. These findings suggest that regular engagement in exercise may be more important than age in explaining vigorous-intensity participation among first-year female students. Unlike vigorous activity, age and sitting time were not significantly associated with walking frequency, indicating that walking frequency is primarily linked to walking duration and general exercise engagement rather than sedentary time. This finding indicates that patterns of inactivity and vigorous-intensity activity are meaningfully interconnected and that sedentary time may function as a behavioral barrier to vigorous participation in this group.
The current study underscores an urgent call for university-led interventions to promote PA among students. Integrating PA promotion initiatives into university curricula such as wellness courses, campus-wide step challenges, or incentives for gym membership may help encourage university students to adopt more active lifestyles during study. Furthermore, leveraging digital and mobile health interventions may provide an alternative solution to increase engagement in structured PA programs. Previous studies have shown that mobile fitness applications and virtual exercise programs can enhance motivation and adherence to PA practice, especially among young adults with time constraints37,38.
To translate these findings into actionable strategies, universities may adopt a phased implementation approach. In the short term (0–3 months), institutions could launch low-cost initiatives such as campus-wide step challenges, brief, scheduled ‘active breaks’ integrated into first-year orientation and large lecture sessions. In the medium term (3–12 months), universities could expand access to female-friendly fitness facilities by offering designated women-only gym hours, subsidized memberships, and structured group exercise classes led by qualified instructors. In the long term (≥12 months), integrating a mandatory wellness/PA module within first-year curricula and establishing routine monitoring of PA and sedentary behavior using validated tools (e.g., IPAQ) can support sustained behavior change and enable evaluation of intervention effectiveness.
This study provides important insights into PA patterns and their associated factors among first-year female university students in Saudi Arabia. The relatively medium-to-large sample size improves the precision of the estimates, and the study extends previous work by examining factors associated with vigorous-, moderate-, and walking-related PA. However, this study has several limitations. First, PA was assessed using IPAQ-SF, a self-reported tool that may overestimate activity levels compared with objective tools such as accelerometers31. Second, the cross-sectional design precludes causal inference, and the observed associations should not be interpreted as cause-and-effect relationships. Further, participants were recruited using convenience sampling, which may introduce selection bias and limit the representativeness and generalizability of the findings. Adherence to the WHO PA recommendations was not formally classified; therefore, the findings reflect individual components of PA rather than overall adherence to PA guidelines. A further limitation is the conceptual overlap among activity frequency, activity duration, and general exercise pattern. These measures describe related aspects of PA behavior and were derived from related questionnaire items. Consequently, the observed associations should not be interpreted as independent causal effects. Finally, although the outcome variables represented bounded count data, ordinary least squares regression was used to provide interpretable estimates of association. Future studies may consider count-based regression models to confirm the robustness of these findings. Future studies should include more representative sampling strategies, objective measures of PA, and rigorous study designs such as longitudinal studies to confirm these findings.
Disclosures
The authors declare no conflict of interest.
Acknowledgements
Princess Nourah bint Abdulrahman University Researchers Supporting Project number (PNURSP2026R421), Princess Nourah bint Abdulrahman University, Riyadh, Saudi Arabia. The authors also extend their appreciation to the Deanship of Postgraduate Studies and Scientific Research at Majmaah University for funding this research work through the project number (R-2026-385).
Materials
| Name | Company | Catalog Number | Comments |
|---|---|---|---|
| Google Forms | Google LLC | Web-based platform; version not applicable | Web-based platform used to administer the study survey and collect anonymous participant responses. |
| IBM SPSS Statistics | IBM Corporation, Armonk, NY, USA | Version 30 | Statistical software used for descriptive statistics and multiple linear regression analyses. |
| International Physical Activity Questionnaire–Short Form | International Physical Activity Questionnaire Research Committee | Short Form; questionnaire version | Self-reported questionnaire used to assess the frequency and duration of vigorous-intensity physical activity, moderate-intensity physical activity, walking, and sitting time. The Arabic-language version was administered. |
| OpenEpi | OpenEpi | Version 3 | Online epidemiological calculator used to estimate the minimum required sample size. |
References
- Bull FC, et al. World Health Organization 2020 guidelines on physical activity and sedentary behaviour. Br J Sports Med. 2020;54:1451-62.
- Guthold R, Stevens GA, Riley LM, Bull FC. Global trends in insufficient physical activity among adolescents: a pooled analysis of 298 population-based surveys with 1.6 million participants. Lancet Child Adolesc Health. 2020;4:23-35.
- Strain T, et al. National, regional, and global trends in insufficient physical activity among adults from 2000 to 2022: a pooled analysis of 507 population-based surveys with 5.7 million participants. Lancet Glob Health. 2024;12:e1232-e1243.
- Ding D, et al. The economic burden of physical inactivity: a global analysis of major non-communicable diseases. Lancet. 2016;388:1311-24.
- Katzmarzyk PT, et al. Sedentary behavior and health: update from the 2018 Physical Activity Guidelines Advisory Committee. Med Sci Sports Exerc. 2019;51:1227-41.
- Al-Hazzaa HM, Albawardi NM. Activity energy expenditure, screen time and dietary habits relative to gender among Saudi youth: interactions of gender with obesity status and selected lifestyle behaviours. Asia Pac J Clin Nutr. 2019;28:389-400.
- Alasqah I, Mahmud I, East L, Usher K. Patterns of physical activity and dietary habits among adolescents in Saudi Arabia: a systematic review. Int J Health Sci (Qassim). 2021;15:39-48.
- Al-Hazzaa HM. Physical inactivity in Saudi Arabia revisited: a systematic review of inactivity prevalence and perceived barriers to active living. Int J Health Sci (Qassim). 2018;12:50-64.
- Alqahtani BA, Alenazi AM, Alhowimel AS, Elnaggar RK. The descriptive pattern of physical activity in Saudi Arabia: analysis of national survey data. Int Health. 2021;13:232-9.
- Aljehani N, et al. Exploring female university students' participation in physical activity in Saudi Arabia: a mixed-methods study. Front Public Health. 2022;10:829296.
- El Bcheraoui C, et al. On your mark, get set, go: levels of physical activity in the Kingdom of Saudi Arabia, 2013. J Phys Act Health. 2016;13:231-8.
- Bashatah A, et al. Evaluation of young adults' physical activity status and perceived barriers in the Riyadh region of Saudi Arabia. J Multidiscip Healthc. 2023;16:557-69.
- Alsulami S. Determinants of and barriers to physical activity for women in Jeddah, Saudi Arabia. World Fam Med J Middle East J Fam Med. 2023;21(1):101-9.
- Albujulaya N, Stevinson C, Piggin J. Physical activity policy in Saudi Arabia: analysis of progress and challenges. Int J Sport Policy Polit. 2024;16:609-24.
- General Authority for Statistics (GASTAT). 38.7% of Saudi females aged 15 years and above participated in physical activity in 2021, representing an improvement compared with 2018 and 2019. Riyadh, Saudi Arabia; 2023.
- Khalaf A, et al. Female university students' physical activity levels and associated factors-a cross-sectional study in southwestern Saudi Arabia. Int J Environ Res Public Health. 2013;10:3502-17.
- Arnett JJ, Zukauskiene R, Sugimura K. The new life stage of emerging adulthood at ages 18-29 years: implications for mental health. Lancet Psychiatry. 2014;1:569-76.
- Wilson OWA, Walters SR, Naylor ME, Clarke JC. Physical activity and associated constraints following the transition from high school to university. Recreat Sports J. 2021;45:52-60.
- Bajuaifer SS, Alrashdi NZ. Physical activity levels among college students in Saudi Arabia. Saudi Med J. 2025;46(6):587-607.
- Saghafi-Asl M, Aliasgharzadeh S, Asghari-Jafarabadi M. Factors influencing weight management behavior among college students: an application of the Health Belief Model. PLoS One. 2020;15:e0228058.
- Jaeschke L, et al. Socio-cultural determinants of physical activity across the life course: a 'Determinants of Diet and Physical Activity' (DEDIPAC) umbrella systematic literature review. Int J Behav Nutr Phys Act. 2017;14:173.
- Noori-Sistani M, et al. Barriers to home-based physical activity and predictors of activity levels among women with high sedentary habits: an explanatory mixed-methods study. BMC Res Notes. 2025;18:217.
- Golaszewski NM, LaCroix AZ, Hooker SP, Bartholomew JB. Group exercise membership is associated with forms of social support, exercise identity, and amount of physical activity. Int J Sport Exerc Psychol. 2022;20:630-43.
- Tross LFS, Magalhaes Dias H, Callegari Zanetti M. Maintaining exercise in fitness centre settings: insights from the physical activity maintenance theory. Int J Qual Stud Health Well-being. 2024;19(1):2409832.
- Andrade L, et al. The associations between access to recreational facilities and adherence to the American Heart Association's physical activity guidelines in US adults. Front Public Health. 2021;9:660624.
- Lee SA, et al. The relationship between sports facility accessibility and physical activity among Korean adults. BMC Public Health. 2016;16:893.
- Kljajevic V, et al. Physical activity and physical fitness among university students-a systematic review. Int J Environ Res Public Health. 2021;19(1):158.
- Lalovic L, et al. Physical activity, BMI, and their effects on university students' quality of life. Healthcare (Basel). 2025;13(15):1880.
- Tao X, et al. Associations between physical activity and health-related quality of life among university students in Zhuhai, China. Sci Rep. 2025;15(1):31319.
- Ministry of Education. Higher education statistics. Ministry of Education, Saudi Arabia; 2023.
- Lee PH, Macfarlane DJ, Lam T, Stewart SM. Validity of the international physical activity questionnaire short form (IPAQ-SF): a systematic review. Int J Behav Nutr Phys Act. 2011;8:115.
- Craig CL, et al. International physical activity questionnaire: 12-country reliability and validity. Med Sci Sports Exerc. 2003;35:1381-95.
- Al-Hazzaa HM. Health-enhancing physical activity among Saudi adults using the International Physical Activity Questionnaire (IPAQ). Public Health Nutr. 2007;10:59-64.
- Barwais F. Physical activity levels among male and female undergraduate students at Umm Al-Qura University. Int Sci J Phys Educ Sport Sci. 2021;9(1):39-49.
- Alrashdi N. Do college students at Majmaah University meet the weekly recommended physical activity guidelines? Cross-sectional analyses. Majmaah J Health Sci. 2024;12(4):28-35.
- Deng Y. Influence of gender stereotype on participation in physical education class of high school students. J Educ Humanit Soc Sci. 2023;8:600-6.
- Nam JS, et al. Feasibility of mobile health app-based home aerobic exercise for physical performance in healthy young adults. Ann Rehabil Med. 2024;48:75-85.
- Southcott E, Jooste J. Unveiling the impact of mobile fitness applications on motivational orientation in sustaining exercise behaviors: a qualitative investigation. Phys Cult Sport Stud Res. 2024;103:1-14.