This protocol describes an integrated 60-min battery — pavlovian-to-operant fear conditioning with avoidance, fear acquisition–extinction–reacquisition with social stimuli, and probabilistic reward learning — that records skin conductance, behavior, and phase-by-phase ratings concurrently to derive per-participant indices of threat and reward learning in adults.
A subscription to JoVE is required to view this content. Sign in or start your free trial.
Method Article
Associative Learning and Adverse Childhood Experiences: A Multi-System Protocol
In This Article
Summary
Abstract
Adverse childhood experiences (ACEs) are established transdiagnostic risk factors for adult anxiety and depression, yet the neurocognitive mechanisms linking early adversity to symptoms remain unclear within a unified framework. This protocol presents an integrated, multi-system experimental battery that captures threat discrimination, safety learning, and reward sensitivity within a single laboratory session. Thirty-eight healthy adults completed three behavioral paradigms — Pavlovian-to-operant fear conditioning with avoidance (Experiment 1), fear acquisition-extinction-reacquisition with social stimuli (Experiment 2), and probabilistic reward learning (Experiment 3) — alongside validated self-reports of childhood adversity (CTQ-SF), benevolent childhood experiences (BCE), depression (PHQ-9), and anxiety (GAD-7, STAI). Multi-channel data were collected concurrently: skin conductance response (SCR) as a physiological index of autonomic arousal, button-press avoidance and probabilistic choices as behavioral indices, and phase-by-phase subjective ratings of expectancy, threat, and relief. Each paradigm produced its canonical effect: Pavlovian discrimination on SCR (p = 0.009, ηp2 = 0.12), expectancy (p < 0.001, ηp2 = 0.58), and threat ratings (p < 0.001, ηp2 = 0.35); operant relief discriminating avoidable from unavoidable threat (p < 0.001, d = 0.86); differential autonomic responding present at acquisition but not extinction in Experiment 2 (acquisition p = 0.008; extinction p = 0.168) coexisting with persistent declarative knowledge of the contingency (p < 0.001, d = 3.08); and above-chance probabilistic reward learning in Experiment 3 (M = 73%, p < 0.001, d = 1.97). The multi-system design revealed dissociations that a single channel would have missed, most notably attenuated autonomic responding alongside persistent subjective threat. Per-participant indices derived from the protocol were sensitive to individual differences in childhood experience, with illustrative moderation analyses reported in the supplementary material. The protocol provides a portable, scalable framework for indexing how early adversity recalibrates threat and reward processing in adulthood.
Introduction
Adverse Childhood Experiences (ACEs), encompassing abuse, neglect, and household dysfunction, are highly prevalent worldwide, with rates exceeding 60% in many populations1. Research syntheses indicate that most children are exposed to at least one adverse event during development2. ACEs are well-established transdiagnostic risk factors for adult psychopathology3, contributing to an estimated 30% of anxiety disorders and 40% of depression cases1. Despite this strong association, commonly used clinical assessments rely on categorical diagnoses and retrospective self-reports, which are vulnerable to recall bias and do not capture real-time neurocognitive processes4.
To overcome these limitations, there is an increasing emphasis on transdiagnostic approaches that target underlying mechanisms, particularly associative learning. Associative learning, encompassing both Pavlovian and operant conditioning, provides a framework for understanding how individuals encode relationships between environmental cues, behaviors, and outcomes to guide decision-making4,5. Within this framework, the latent vulnerability theory posits that early adversity induces neurobiological adaptations, such as heightened vigilance, that are initially adaptive in unpredictable environments but may become maladaptive in later, safer contexts6,7.
Evidence suggests that ACEs influence both threat- and reward-related learning processes. Individuals with a history of adversity often show reduced discrimination between conditioned danger (CS+) and safety (CS−) cues, indicative of altered threat learning8. In parallel, early adversity has been associated with diminished reward sensitivity, reflected in lower accuracy and slower acquisition of reward contingencies8. Under conditions of uncertainty, these individuals may also exhibit increased choice variability and a bias toward assuming random reward delivery, consistent with early exposure to volatile environments5,9.
These learning patterns are further shaped by protective and state-dependent factors. Benevolent Childhood Experiences (BCEs) may buffer the effects of adversity on learning systems10, while current affective states, such as anxiety, can modulate conditioning processes11. Physiological measures of autonomic arousal, including Skin Conductance Response (SCR), provide objective indices of these processes and are widely used in conditioning paradigms12.
A major limitation in the current literature is the use of isolated tasks that assess threat or reward learning independently, limiting the ability to capture integrated neurocognitive functioning1. The present protocol addresses this gap by providing a standardized framework that combines behavioral and physiological measures across multiple learning domains. Specifically, the protocol includes three experimental components: (1) a paradigm assessing transitions from Pavlovian to operant conditioning, (2) a social fear extinction task, and (3) a probabilistic reward learning task8.
The rationale for this particular combination of paradigms is not that any one of these three tasks is, in isolation, more sensitive to early adversity than the many other established learning paradigms available; it is a rationale of measurement. In their systematic review of 81 studies (38 threat, 43 reward), Ruge et al.1 showed that the literature linking ACEs to associative learning remains heterogeneous and, in key respects, inconclusive precisely because studies typically deploy a single task, record a single response channel, and operationalize adversity in non-harmonized ways. Illustratively, half of the behavioral reward-learning studies reported blunted learning while the other half reported null results; the small extinction literature is dominated by null findings and by reports that omit the preceding acquisition phase; and no outcome measure has emerged as universally more reliable, so different response channels are not interchangeable proxies for one another. Their explicit recommendation is a move toward within-subject, multi-domain, and multi-channel protocols yielding individual-level indices. The present triad follows that recommendation because its three tasks span three computationally dissociable demands that no single paradigm covers, and which the theory of latent vulnerability7 predicts that adversity should shape in different ways: (i) threat–safety discrimination combined with instrumental controllability, with relief as the putative reinforcer of avoidance13; (ii) inhibitory (safety) learning and return of fear, probed with social face stimuli11, the ecologically relevant stimulus domain for interpersonal maltreatment; and (iii) reinforcement learning under probabilistic uncertainty, which yields per-participant computational parameters (learning rate alpha, inverse temperature beta)8. Because all three are administered within the same participant, the design is constructed to ask whether ACE-related alterations are domain-general — a global recalibration of associative learning, as Hanson et al.8 propose and as a neurocomputational latent-vulnerability account would predict6 — or valence-specific, confined to threat. A single-task study cannot adjudicate between these competing hypotheses by construction.
The battery is designed to test a set of explicit, directional predictions, which the present sample is not powered to adjudicate and which are stated here as targets for adequately powered studies. Consistent with the blunted-learning pattern described by Ruge et al.1, higher ACE load is predicted to be associated with (i) reduced CS+/CS− discrimination in Experiment 1, driven by attenuated responding to the CS+ and expected to be more pronounced in the autonomic channel (SCR) than in declarative expectancy, which may remain intact; (ii) greater avoidance responding and higher subjective relief to the avoidable CS+, consistent with relief-reinforced avoidance13; (iii) slower extinction and a faster, larger return of fear at reacquisition in Experiment 2, an effect predicted to be amplified by the social (face) stimuli that carry ecological relevance for interpersonal adversity11; and (iv) lower choice accuracy, a lower learning rate (alpha), and greater choice variability (lower beta) in Experiment 38. Crucially, the three tasks are jointly informative about a fifth, discriminating prediction: if ACE-related alteration is domain-general, attenuation should appear across all three tasks; if it is valence-specific, it should be confined to the two threat paradigms and absent in probabilistic reward learning. Because response channels are recorded concurrently, a further prediction is testable — that ACE effects will be channel-dependent rather than uniform, so that conclusions drawn from any single channel would not generalize to the others.
Experiment 1 adapts the Pavlovian-to-operant fear conditioning paradigm with avoidance and trial-by-trial relief ratings developed by San Martín et al.13, in which two CS+ cues (one avoidable, one unavoidable) and one CS− are used to dissociate Pavlovian discrimination from instrumental control over the aversive outcome. In the original paradigm, US-expectancy ratings during the Pavlovian acquisition phase were assessed retrospectively at the end of the phase by the experimenter rather than on a trial-by-trial basis. In the present adaptation, subjective ratings of expectancy, threat, and relief were collected concurrently throughout the task on a phase-by-phase basis using visual analog scales, allowing continuous tracking of learning dynamics across phases.
Experiment 2 adapts the fear acquisition–extinction protocol with social (face) stimuli from Dibbets and Evers9, extending it with a brief reacquisition test to evaluate the rapid re-emergence of conditioned responding (savings effect).
Experiment 3 adapts the probabilistic reward learning task introduced by Hanson et al.8 for the study of early-adversity-related learning differences, with two reward contingencies (80/20 and 70/30) that allow estimation of per-participant reinforcement-learning parameters (Q-learning Alpha and Beta). By integrating these three paradigms within a single laboratory session, the present protocol enables direct within-participant comparison of threat and reward learning processes that are typically studied in isolation. Beyond per-trial accuracy and Q-learning parameters, the analysis pipeline also produces individual learning-trajectory slopes from a linear mixed model fit, available for use in larger samples.
Two distinct goals must be kept apart here, because they are not equivalent. The first is to establish that a battery of this kind can be run as a single, integrated 60-min session and that each of its components elicits the canonical effect it was designed to elicit; reproducing canonical effects is sufficient evidence for this first goal. The second is to establish that the resulting indices are sensitive and specific to the consequences of childhood adversity; reproducing canonical effects is not sufficient evidence for that, and the present sample is not powered to provide it. The primary objective of this report is therefore the technical and methodological feasibility of the integrated battery: whether threat acquisition, instrumental avoidance with relief, extinction and return of fear with social stimuli, and probabilistic reward learning can be acquired concurrently across autonomic, behavioral, and self-report channels within a single session, and whether the pipeline yields stable, reusable per-participant indices (differential SCR contrasts, the operant relief contrast, Q-learning alpha and beta parameters, and individual learning-trajectory slopes). Assessment of ACE-related alterations in learning constitutes a secondary, exploratory, and illustrative objective: the individual-difference analyses reported here are intended to demonstrate the measurement capacity of the protocol and to make its candidate indices available for future work, not to specifically test trauma–learning pathways. The protocol thus provides candidate indices; whether they possess the sensitivity and specificity required to characterize the neurocognitive consequences of childhood adversity remains to be established in larger, ideally extreme-group-enriched and pre-registered samples1,14.
Access restricted. Please log in or start a trial to view this content.
Protocol
The present protocol describes the procedures and instrumentation used to measure Skin Conductance Response (SCR) in healthy participants aged 18 or older, in compliance with the ethics committee's requirements. Before participating in the study, all participants signed an informed consent form that also included the possibility of being contacted again after six months for a follow-up assessment. All procedures described in this document were approved by the Scientific Ethics Committee of Universidad de los Andes (ID: CEC2025023).
NOTE: This protocol provides a detailed description of the complete experimental workflow (Figure 1), including participant scheduling, laboratory preparation, physiological signal acquisition, data organization, and post-experimental data handling. In addition, it outlines the staff training procedure implemented to ensure that SCR recordings are collected consistently, standardized, and reliable across all experimental sessions.
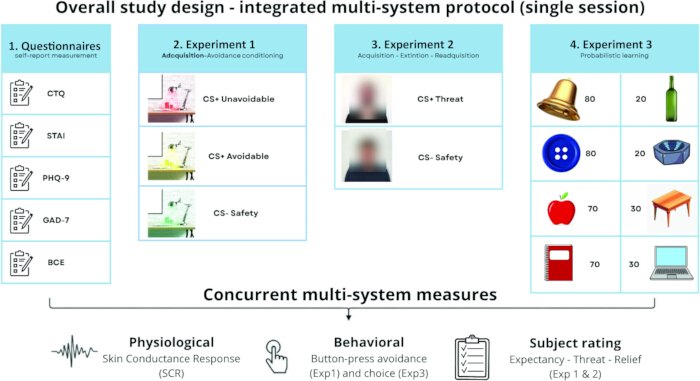
Figure 1: Overall schematic of the study design. Each participant completed a single laboratory session covering three sequential behavioral paradigms: Pavlovian-to-operant fear conditioning with avoidance (Experiment 1), fear acquisition–extinction–reacquisition with social stimuli (Experiment 2), and probabilistic reward learning (Experiment 3). Self-reports of childhood adversity (CTQ-SF), benevolent childhood experiences (BCE), and current symptoms (PHQ-9, GAD-7, STAI) were also collected. Multi-channel data — skin conductance response, behavior (avoidance, probabilistic choices), and subjective ratings (expectancy, threat, relief) were recorded concurrently. Per-participant indices were entered into individual-difference analyses (see Supplementary File 2). Please click here to view a larger version of this figure.
1. Staff training
- Train every team member in three progressive stages to ensure standardized and accurate data measurement.
- Run internal trials in which each staff member takes samples and executes all three experiments according to their respective protocols, so that the trainee becomes familiar with the equipment and with participant handling.
- Next, have each trainee take samples from real participants under the supervision of at least one of the principal researchers, in order to verify their ability to run the protocol and to correct any errors.
- Authorize the assistant to take samples autonomously and to schedule new participants only after the complete protocol has been applied correctly under supervision.
2. Scheduling
- Recruit and schedule participants through social media, providing the general objectives of the research and the participation criteria.
- Create a digital poster and distribute it through the recruitment channels to reach as many potential participants as possible.
- Instruct interested candidates to contact the research team by email and schedule a session on a day convenient for the participant.
- Send the participant a link to the online questionnaire, entitled "The Invisible Marks: The Role of Associative Learning in the Relationship between Adverse Childhood Experiences and Mental Health in Adulthood."
- Begin the questionnaire with an informed consent form, and require the participant to read and accept it before any further items are presented.
- Include in the questionnaire a socio-demographic section and the following validated psychometric scales: Patient Health Questionnaire-9 (PHQ-9)15, Generalized Anxiety Disorder Screener (GAD-7)16, State-Trait Anxiety Inventory (STAI)17, Childhood Trauma Questionnaire—Short Form (CTQ-SF)18, and Benevolent Childhood Experiences (BCEs)10.
3. Preparations
- Ensure that at least one staff member is present in the laboratory before the participant arrives. Prepare the experimental environment, verify the correct functioning of the equipment, and confirm that all protocol requirements are met before the session begins:
- Turn on the laboratory computer and verify that the operating system, experimental software, and all peripherals are functioning correctly.
- Confirm that the experimental files and data acquisition system are ready to use.
- Open and review the daily running file before the participant enters the laboratory.
- Identify the corresponding identification code (ID) assigned to the incoming participant.
- Verify the execution order of the experimental conditions according to the predefined counterbalancing.
- Ensure that the participant is assigned to the correct experimental order before any data acquisition begins.
NOTE: The daily running file contains all necessary information to assign the participant's ID and determine the execution order of the experiment while maintaining the required counterbalancing across all experimental conditions. For example, a participant may be assigned the ID "015". - Organize data storage on the laboratory computer in the standardized directory structure required by the automated processing pipeline: one top-level folder per experiment, one subfolder per counterbalancing condition, and one folder per participant ID, plus two global folders that receive the processed data and the consolidated databases (see Supplementary File 1).
- Create the participant folder corresponding to the ID and counterbalancing condition listed in the daily running file before beginning data acquisition, and follow the directory and file-naming conventions specified in Supplementary File 1 throughout the session, because the pre-processing and database scripts locate files by path and by name.
NOTE: The directory tree, the counterbalancing subfolder labels, the file-naming conventions, and a worked example are given in Supplementary File 1. Deviating from these conventions prevents the automated pipeline from locating the participant's files. - Verify that the experimental desk is completely free of external or distracting objects. Allow only the data acquisition system and the computer peripherals required for the experiment on the desk.
- Invite the participant into the room in a calm and professional manner.
- Ask the participant to leave all personal belongings aside in the designated area.
- Instruct the participant to place their mobile device in silent mode to avoid interruptions or distractions during the experimental session.
- Ask the participant to remove all accessories from their non-dominant hand, particularly rings, bracelets, or any object located in the middle and ring fingers, as they may interfere with the measurements.
- Guide the participant to sit comfortably in the chair positioned in front of the laboratory computer.
- Provide the participant with a printed physical copy of the informed consent document.
- Allow sufficient time for the participant to read the document and ask questions if necessary.
- Confirm that the informed consent form is correctly signed before starting any experimental procedure.
NOTE: The informed consent procedure is repeated in physical format following the requirements established by the ethics committee and in order to maintain a physical backup of the participant's consent documentation.
4. Experimental setup
NOTE: The experimental setup must follow a strict and standardized protocol to ensure that all physiological measurements are acquired under identical controlled conditions across participants.
- Turn on the acquisition system and verify that the device is correctly connected to the laboratory computer and recognized by the acquisition system software (see Figure 2A–E).
- Confirm again that all required modules and peripherals are functioning properly before proceeding with the participant preparation.
- Take two electrodermal activity (EDA) electrodes (see Figure 2F).
- Apply a small quantity of conductive gel to the contact surface of each electrode (see Figure 2G,H).
- Ensure that the conductive gel is evenly distributed across the electrode surface to improve electrical contact with the participant's skin and optimize signal quality.
NOTE: If conductive gel is not applied to the electrodes, the recorded signal may contain excessive noise, and the skin conductance response (SCR) measurement quality may be severely compromised. - Place the electrodes on the participant's non-dominant hand.
- Attach one electrode to the first phalanx of the middle finger (third finger) and the second electrode to the first phalanx of the ring finger (fourth finger) (see Figure 2I).
- Verify that both electrodes are firmly attached and maintain stable contact with the skin without causing discomfort to the participant.
- Place the wrist strap on the participant's wrist.
- Leave the EDA electrodes disconnected from the wrist strap during the calibration stage (see Figure 2J).
- Turn on the wrist strap in order to establish wireless communication with the physiological acquisition system.
- Confirm that the device is successfully detected.
NOTE: Special attention must be paid to the wrist strap throughout the entire experimental session. The staff members must continuously verify that the device remains powered on and connected before starting the experiment, since any interruption in communication may compromise the physiological recording. - Start the acquisition process in the acquisition software.
- Wait for the calibration window, which appears automatically on the screen once acquisition begins.
- Perform the calibration procedure while the electrodes remain disconnected from the wrist strap.
- Follow the calibration instructions provided by the software until the procedure is completed.
- After successful calibration, connect the EDA electrodes to the wrist strap (see Figure 2K).
- Verify in the software that the skin conductance response (SCR) signal is being correctly acquired.
- Instruct the participant to keep their non-dominant hand completely still throughout the entire experiment.
- Explain that unnecessary movements, finger contractions, or changes in posture may introduce noise to the SCR signal.
- Ask the participant to maintain a comfortable and relaxed posture during the session.
- Provide the participant with headphones before starting the experimental task.
- Verify that the headphones are functioning correctly and that the participant can clearly perceive the auditory stimuli presented during the experiment.
- Launch the experimental task in PsychoPy19.
- When the PsychoPy interface opens, enter the participant name in the additional window that requests it.
- Enter the participant's assigned ID exactly as specified in the daily running file before initiating the experiment.
NOTE: Following the previous example, the participant ID entered in PsychoPy should be "015".
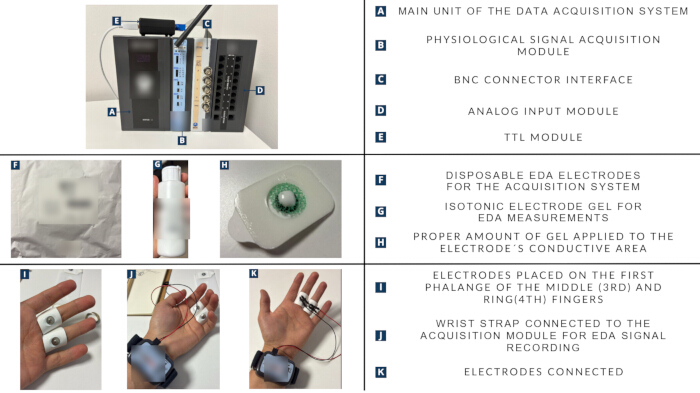
Figure 2: Acquisition system, materials, and electrode placement for skin conductance recording. (A) Main unit Biopac MP200. (B) Physiological signal acquisition module (PPG/EDA). (C) Sensors connector module. (D) Analog input module. (E) TTL module for communication between PsychoPy and AcqKnowledge. (F) Disposable electrodes (EL507A). (G) Isotonic gel (GEL101A) to improve skin contact. (H) Application of the gel on the electrode. (I) Electrodes placed in the first phalange of the third and fourth fingers of the non-dominant hand. (J) Wrist strap placement on the non-dominant hand for SCR measurement. (K) Electrodes connected after the calibration process. Please click here to view a larger version of this figure.
5. Beginning of the experiment
- Before starting the experiment task, explain to the participant in detail how to respond to the questions presented during the experiment.
- Ensure that the participant clearly understands: (i) the response method to be used during the task, (ii) the meaning of the instructions displayed on the screen, and (iii) the importance of remaining attentive and minimizing unnecessary movements throughout the experiment.
- Answer any remaining questions from the participant before beginning the recording session.
- Perform a final verification of the complete experimental setup to ensure that all systems are functioning correctly according to the established protocol, including: physiological acquisition system communication, wrist strap connection, SCR signal quality, PsychoPy execution, audio presentation through the headphones, and correct participant ID registration.
- Once all systems have been verified and the participant confirms readiness to begin, start the experimental task.
- Leave the experimental room once the task has started, in order to minimize external influences and distractions during data acquisition.
- Remain nearby and available in case technical assistance or participant support is required, and wait until the participant completes the session.
6. Between experiments
- Re-enter the experimental room once the participant has finished the task, and stop the physiological recording in the acquisition software.
- Save the physiological recording in the participant's folder as an acquisition file, and then export the same recording to MATLAB format with events, so that the exported file carries the stimulus markers generated by PsychoPy through the TTL module; the export additionally produces a separate marker file.
NOTE: The event and marker information is required by the pre-processing pipeline (Section 8) to segment the signal by trial and by stimulus type. - Save the PsychoPy output spreadsheet generated at the end of the task in the same participant folder. Use the standardized file-naming convention detailed in Supplementary File 1 for all four files.
NOTE: At the end of each experiment, the participant's folder must contain the acquisition file, the exported MATLAB file, the marker file, and the PsychoPy spreadsheet. Exact names, paths, and a worked example are given in Supplementary File 1. - Carefully disconnect the EDA electrodes from the participant, ensuring no excessive movement or discomfort occurs during removal.
- Open the next PsychoPy experimental task and restart the acquisition software in preparation for the following experiment.
- Repeat the complete preparation and acquisition procedure starting from step 4.1.
NOTE: The complete experimental session consists of three independent experiments. Therefore, once the second experiment has finished, the same procedure described above must be repeated for the third experiment. - At the end of the complete experimental session, ensure the participant has three subfolders for each experimental task, each containing all the previously mentioned files.
NOTE: The approximate duration of each experimental task was previously estimated in order to allow staff members to monitor the participant and verify the correct functioning of the acquisition system through the session. The estimated duration of each experiment is as follows:
Experiment_1: approximately 24 min.
Experiment_2: approximately 17 min.
Experiment_3: approximately 8 min.
Considering the preparation, calibration, transition periods between experiments, and finalization procedure, the complete experimental session has an approximate duration of 60 min.
7. End of the experiments
- Close the physiological recording session once all three experimental tasks have been completed.
- Stop the acquisition process in the acquisition software if it has not already been stopped.
- Disconnect the EDA electrodes from the wrist strap and remove the wrist strap from the participant's wrist.
- Allow the participant to remove the EDA electrodes themselves to minimize discomfort and ensure safe removal from the skin.
- Verify that all experimental files and physiological recordings have been correctly saved before concluding the session.
- Thank the participant for their collaboration and offer a light snack as a token of appreciation after the experimental procedure is complete.
NOTE: If any issue occurs during the physiological recording due to technical problems, including, but not limited to: loss of communication between the wrist strap and the physiological acquisition system module, unexpected shutdown of the wrist strap, loose or partially detached electrodes, or temporary signal interruptions or excessive noise caused by connection problems, the experiment must continue as planned and the participant must not repeat the experimental session.
8. Pre-processing of the data
NOTE: Once the experimental session has been completed and all physiological recordings have been properly stored, the SCR data must undergo a standardized pre-processing procedure prior to analysis.
- Run the Ledalab_Format MATLAB script to reorganize the data structure of the physiological recording exported from the acquisition software, so that it is compatible with Ledalab, a MATLAB-based toolbox designed for the analysis of EDA signals.
NOTE: In the Ledalab_Format.mat code, define the path of the {Identification_Code}.mat file as an input variable. This allows the exported physiological recording file to be converted into a format that can be correctly read and processed by Ledalab. Once the conversion process has been completed, a new MATLAB file must be generated and saved inside the corresponding participant folder using the following naming convention: Ledalab_{Identification_Code}.mat. Following the previous example, if the data from Experiment_1 are converted for participant "015", the resulting file must be named: Ledalab_015.mat. - Open Ledalab, in the menu bar located in the upper-left corner, select File > Import Data > Matlab File (*.mat). Then, load the newly generated data file corresponding to the participant's experimental condition.
- Enter the sampling parameters in the configuration window that Ledalab displays once the file is loaded.
- The original acquisition frequency of the SCR signal is 2000 Hz. In order to reduce computational load, downsample the signal to 10 Hz using the following parameters: Target sampling frequency: 10 Hz, Downsampling factor: 200, Resampling method: Steps.
- After completing the downsampling procedure, perform a continuous decomposition analysis (CDA)20 within Ledalab to decompose the EDA signal into its tonic and phasic components.
- In the menu bar, select Analysis > Continuous Decomposition Analysis (Extraction of Continuous Phasic/Tonic Activity).
- Wait for the configuration window to appear on the screen.
- In this window, select the Optimize option to automatically adjust the analysis parameters.
- Once the optimization process is completed, click Apply to start the CDA analysis.
- Once the CDA analysis has been completed, select Results > Event-related Analysis, and a configuration window will appear on the screen.
- Set the minimum amplitude threshold to the Ledalab default of 0.01 µS and leave the z-scale option unselected. The event markers exported from the acquisition software tag the onset of the conditioned stimulus and the onset of the unconditioned stimulus separately, so the event-related analysis returns a response for each. Set the response window as follows:
- For Experiment 1, use 0 s to 9 s after the event marker.
- For Experiment 2, use 0 s to 6 s after the event marker.
- Export the result as a spreadsheet file. Ledalab generates a spreadsheet containing the relevant physiological and event-related information extracted from the SCR signal.
NOTE: The response window corresponds to the full duration of the conditioned stimulus in each task (Supplementary Table 1: 9 s in Experiment 1 and 6 s in Experiment 2), so that the CS-evoked response covers the entire CS-US interval and is not contaminated by the unconditioned response, which is scored separately on its own event marker. Responses falling below the 0.01 µS threshold are written as zero by Ledalab and are retained in the analysis as zeros; do not delete them, because their removal would inflate the mean response of low-responding participants. - Repeat the complete pre-processing, downsampling, and CDA procedure for Experiment 2 (see the NOTE below for Experiment 3, which follows a different procedure and does not require the CDA output).
NOTE: At the end of the pre-processing phase, each experimental folder must contain an additional spreadsheet file corresponding to the CDA analysis results generated by Ledalab. This file must subsequently be converted to .xlsx format for storage, organization, and further analysis. Experiment 3 follows a different pre-processing procedure. For this experiment, only the MATLAB script must be used, and it does not require the CDA output, only the alpha and beta values. When the script is executed for "Experiment_3", it automatically extracts the alpha and beta values, merges them with the behavioral information, and saves the resulting spreadsheet in Global_Data/Exp_3. - Perform signal quality control, non-responders, and artifact handling.
- Before any statistical analysis, display the full downsampled skin conductance trace of each participant in Ledalab and inspect it visually from the first to the last event marker. Perform this inspection for every participant and for every task separately, because signal quality is channel- and task-specific.
- Reject a whole trace, and treat the SCR channel of that task as missing for that participant, if any of the following is observed: (i) a flat or absent signal over the task, indicating loss of wireless communication with the wrist strap, a wrist strap powered off, or a detached electrode; (ii) a tonic skin conductance level below 0.05 µS sustained across the task, which indicates inadequate electrode-skin contact rather than low arousal; (iii) uninterpretable drift or a sudden, sustained inflation of amplitude that is not time-locked to any event; or (iv) saturation of the amplifier range.
NOTE: Do not repeat the session and do not exclude the participant from the other tasks or from the behavioral and self-report channels. - Define a participant as a non-responder for a given task if no phasic response reaches or exceeds the 0.01 µS threshold on any event of that task, including the unconditioned stimulus events of the reinforced trials — that is, if the participant produces no measurable electrodermal response even to the aversive outcome itself.
- Exclude a non-responder from every channel of that task — skin conductance, behavior, and subjective ratings alike — because the absence of any electrodermal response even to the unconditioned stimulus indicates that the electrodermal system was not measurable in that session, and calls into question whether the participant engaged with the contingency at all.
- Retain that participant in the two remaining tasks. Distinguish this case from technical signal loss (a detached electrode, or a wrist strap that lost wireless communication), in which the participant did respond, but the signal was not recorded: there, treat the SCR channel of that task as missing and retain the behavioral and subjective data of that task, which are unaffected by electrodermal signal quality.
- Report the non-responder rate and the technical-loss rate separately for every task.
- Identify movement artifacts on the trace as (i) abrupt rising transients that are not time-locked to any event marker, or (ii) step-like offsets in the tonic level produced by finger contraction, by a shift in posture, or by rubbing the electrodes against the chair or the desk.
- Mark every trial containing such an artifact within its scoring window and exclude it at the trial level; do not exclude the participant.
- Exclude a participant from every channel of a task, and not only from its SCR analysis, if more than 25% of the trials of that task are marked as artifact-contaminated: the remaining trials no longer support a stable per-participant estimate, and the recording conditions of that session are not adequate for any channel. Retain that participant in the two remaining tasks.
- Transform the trial-level amplitudes with log(SCR + 1) before averaging, in order to normalize the positively skewed distribution of electrodermal amplitudes; clamp any negative CDA value, a rare consequence of baseline drift, to zero before the transformation.
- Aggregate the transformed trials to obtain one value per participant, per phase, and per stimulus.
- Report the analytic n separately for each channel (SCR, behavior, ratings) and for each task, because channel-specific loss makes these n diverge.
- Record every decision taken in steps 8.14.1–8.14.9 in a per-participant quality log containing: participant ID, task, counterbalancing condition, trace accepted or rejected (with reason), tonic level range, number and identity of artifact-rejected trials, percentage of artifact-rejected trials, non-responder status, and the final analytic n contribution for each channel.
- Store the quality log with the consolidated databases so that channel-specific data loss is auditable and reproducible.
NOTE: In the present sample, no participant met the non-responder criterion of step 8.14.3, and no participant exceeded the 25% artifact threshold of step 8.14.6; consequently, no participant was excluded from all channels of a task. The divergences in the analytic n are of two independent kinds: technical loss of the electrodermal channel, which leaves the behavioral and subjective records of that task intact, and incomplete behavioral or self-report records (a task not completed, or missing visual-analog responses), which are independent of electrodermal signal quality. The exact analytic n for every channel and every task is reported in the analytic sample paragraph of the Representative Results. Experiment 3 does not include an SCR channel, so its n reflects behavioral rather than electrodermal data loss. Reporting these criteria explicitly addresses the lack of harmonization in the operationalization and reporting of electrodermal outcomes highlighted by Ruge et al.1.
9. Databases
- Run the Python script Data_Bases.py to merge, for each participant, the physiological measurements obtained from the SCR recordings with the responses collected during the experimental task.
NOTE: The script integrates the information obtained from the physiological recordings processed through Ledalab, the CDA analysis outputs, and the PsychoPy response spreadsheets generated during the experiment. - After the script has run successfully, ensure a consolidated spreadsheet containing both physiological and behavioral information for a single participant is generated and stored in the Global_Data folder.
NOTE: Following the previous example, if Experiment_1 is selected for analysis, the Python script will automatically traverse the folders of all participants associated with that experiment, merge the CDA outputs with the corresponding behavioral data for each participant, and generate an individual spreadsheet file for every participant inside the Global_Data/Exp_1 folder. - Once the individual participant databases have been generated, use the Python script Completed_Bases_Per_Experiment.py to merge the data from all participants for each experimental task.
NOTE: The script combines the information from all participant folders into a unified database for each experiment, facilitating subsequent statistical analysis and data processing. If the procedure is completed successfully, three final spreadsheets will be generated, each corresponding to one of the three experiments:
One spreadsheet for Experiment_1
One spreadsheet for Experiment_2
One spreadsheet for Experiment_3 - Store the resulting complete databases in the Complete_Data_Bases folder.
Access restricted. Please log in or start a trial to view this content.
Results
Analytic sample
A total of 38 healthy adults completed the full experimental session and the self-report battery (CTQ-SF, BCE, PHQ-9, GAD-7, STAI). Per-analysis sample sizes varied slightly because of channel-specific data loss, not participant withdrawal. Sample sizes by analysis: Experiment 1 — SCR and rating ANOVAs (Pavlovian and operant phases), n = 37; operant button-press ANOVA, n = 38. Experiment 2 — rating analyses (acquisition, extinction, reacquisition) and acquisit...
Access restricted. Please log in or start a trial to view this content.
Discussion
The present results establish the technical and methodological viability of an integrated, single-session battery covering threat acquisition with instrumental control, safety learning, and return of fear, and probabilistic reward learning. In a sample of 35 to 38 healthy adults (analytic sample sizes differed slightly across experiments because of channel-specific signal loss, not participant withdrawal), every paradigm reproduced its canonical effect: differential subjective and — more weakly — autonomic co...
Access restricted. Please log in or start a trial to view this content.
Disclosures
The authors declare no competing financial or non-financial interests.
Acknowledgements
The authors thank all participants for their time and engagement, and the research assistants and laboratory team at Universidad de los Andes. This research was supported by Agencia Nacional de Investigacion y Desarrollo de Chile (ANID) through Fondecyt Iniciacion grant #11250037 (Principal Investigator: Maria Consuelo San Martin). R.C.V was supported by National Center for Artificial Intelligence CENIA FB210017, Basal ANID.
Access restricted. Please log in or start a trial to view this content.
Materials
| Name | Company | Catalog Number | Comments |
|---|---|---|---|
| AcqKnowledge software | BIOPAC Systems Inc. | ACK100W (Windows) / ACK100M (Mac) | Data acquisition and analysis software for physiological signals. RRID:SCR_014279 (verify with current SciCrunch entry). |
| afex (R package) | Singmann, Bolker, Westfall, Aust & Ben-Shachar | Version 1.5-1 | R package for factorial experiments. Used for all repeated-measures ANOVAs (Experiments 1-3) via aov_ez(). RRID:SCR_022761 (verify with current SciCrunch entry). |
| ARTool (R package) | Wobbrock, Findlater, Gergle & Higgins | Version 0.11.2 | Aligned Rank Transform for nonparametric factorial ANOVA. Used for the Phase x Stimulus ANOVA on skin conductance in Experiment 2, whose distribution is non-Gaussian. |
| Benevolent Childhood Experiences (BCE) scale | Narayan, Rivera, Bernstein, Harris & Lieberman (2018) | Public-domain instrument (10 items) | Spanish adaptation used. No RRID assigned to this instrument; cite original validation paper. |
| BioNomadix Wrist Strap (Transmitter) | BIOPAC Systems Inc. | BN-PPGED-T | Wearable transmitter for EDA and PPG signals. Used in pair with the BioNomadix receiver module. |
| Childhood Trauma Questionnaire - Short Form (CTQ-SF) | Bernstein et al. (2003) | Validated 28-item retrospective self-report | Five subscales (EA, PA, SA, EN, PN). No RRID; cite original validation paper. Used Spanish adaptation. |
| Conductor gel for EDA electrodes | BIOPAC Systems Inc. | GEL101A | Isotonic gel for skin conductance measurements. |
| Disposable Ag/AgCl EDA electrodes | BIOPAC Systems Inc. | EL507A | Disposable electrodes for skin conductance recording. |
| Generalized Anxiety Disorder Scale (GAD-7) | Spitzer, Kroenke, Williams & Löwe (2006) | 7-item self-report | Validated Spanish version used. No instrument RRID; cite original. |
| ggplot2 (R package) | Wickham | Version 4.0.3 | Grammar-of-graphics plotting system. RRID:SCR_014601 (verify with current SciCrunch entry). |
| Headphones (over-ear) | HyperX (HP Inc.) | Cloud III | Wired closed-back gaming headset; used to deliver the auditory unconditioned stimulus during fear conditioning. |
| Ledalab | Benedek & Kaernbach (2010) | Open-source MATLAB toolbox v3.2.5 | Continuous Decomposition Analysis (CDA) of skin conductance signals. RRID not assigned (cite original paper instead). |
| lme4 (R package) | Bates, Maechler, Bolker & Walker | Version 1.1-37 | Linear mixed-effects models. Used to estimate the per-participant learning-trajectory slopes in Experiment 3. RRID:SCR_015654 (verify with current SciCrunch entry). |
| MATLAB | MathWorks | R2025a | Used to run Ledalab and the SCR pre-processing pipeline. RRID:SCR_001622. |
| Patient Health Questionnaire-9 (PHQ-9) | Kroenke, Spitzer & Williams (2001) | 9-item self-report | Validated Spanish version used. No instrument RRID; cite original. |
| Physiological data acquisition unit (PsychoPy) | BIOPAC Systems Inc. | MP200 | Main physiological signal acquisition unit. Combined with BioNomadix wireless EDA module. |
| Python | Python Software Foundation | Version 3.12 | Used for the pre-processing pipeline that merges the Ledalab output with the PsychoPy behavioural records (Data_Bases.py, Completed_Bases_Per_Experiment.py). RRID:SCR_008394 (verify with current SciCrunch entry). |
| R (statistical computing environment) | R Foundation for Statistical Computing | Version 4.5.0 | Environment in which all statistical analyses were performed. Moderation models were estimated by ordinary least squares regression with the lm() function of the base stats package, with predictors z-standardized and the interaction term computed as their product; no specialized moderation package was used. RRID:SCR_001905 (verify with current SciCrunch entry). |
| State-Trait Anxiety Inventory (STAI) | Spielberger et al. (1983) | STAI Form Y (40 items, SAI + TAI) | Validated Spanish version used. No instrument RRID; cite original. |
| Stimulus presentation monitor | Samsung | LS22D300GALXZS (S22D300, 22-inch LED) | Display used for visual CS+ / CS- stimuli and rating scales. |
References
- Ruge J, et al. How adverse childhood experiences get under the skin: a systematic review, integration and methodological discussion on threat and reward learning mechanisms. eLife. 2024;13:e92700.
- Madigan S, et al. Adverse childhood experiences: a meta-analysis of prevalence and moderators among half a million adults in 206 studies. World Psychiatry. 2023;22(3):463-71.
- Teicher MH, Gordon JB, Nemeroff CB. Recognizing the importance of childhood maltreatment as a critical factor in psychiatric diagnoses, treatment, research, prevention, and education. Mol Psychiatry. 2022;27(3):1331-8.
- Smith KE, Pollak SD. Children's value-based decision making. Sci Rep. 2022;12:5953.
- Montague PR, Hyman SE, Cohen JD. Computational roles for dopamine in behavioural control. Nature. 2004;431(7010):760-7.
- Gerin MI, et al. A neurocomputational investigation of reinforcement-based decision making as a candidate latent vulnerability mechanism in maltreated children. Dev Psychopathol. 2017;29(5):1689-705.
- McCrory EJ, Viding E. The theory of latent vulnerability: reconceptualizing the link between childhood maltreatment and psychiatric disorder. Dev Psychopathol. 2015;27(2):493-505.
- Hanson JL, et al. Early adversity and learning: implications for typical and atypical behavioral development. J Child Psychol Psychiatry. 2017;58(7):770-8.
- van den Bos W, Güroğlu B, van den Bulk BG, Rombouts SARB, Crone EA. Better than expected or as bad as you thought? The neurocognitive development of probabilistic feedback processing. Front Hum Neurosci. 2009;3:52.
- Narayan AJ, Rivera LM, Bernstein RE, Harris WW, Lieberman AF. Positive childhood experiences predict less psychopathology and stress in pregnant women with childhood adversity. Child Abuse Negl. 2018;78:19-30.
- Dibbets P, Evers EAT. The influence of state anxiety on fear discrimination and extinction in females. Front Psychol. 2017;8:347.
- Sperl MFJ, Panitz C, Hermann C, Mueller EM. A pragmatic comparison of noise burst and electric shock unconditioned stimuli for fear conditioning research with many trials. Psychophysiology. 2016;53(7):1017-34.
- San Martín C, Jacobs B, Vervliet B. Further characterization of relief dynamics in the conditioning and generalization of avoidance: effects of distress tolerance and intolerance of uncertainty. Behav Res Ther. 2020;124:103526.
- McLaughlin KA, DeCross SN, Jovanovic T, Tottenham N. Mechanisms linking childhood adversity with psychopathology: learning as an intervention target. Behav Res Ther. 2019;118:101-9.
- Kroenke K, Spitzer RL, Williams JBW. The PHQ-9: validity of a brief depression severity measure. J Gen Intern Med. 2001;16(9):606-13.
- Spitzer RL, Kroenke K, Williams JBW, Löwe B. A brief measure for assessing generalized anxiety disorder: the GAD-7. Arch Intern Med. 2006;166(10):1092-7.
- Spielberger CD. Manual for the State-Trait Anxiety Inventory (Form Y). Consulting Psychologists Press; Palo Alto (CA); 1983.
- Bernstein DP, et al. Development and validation of a brief screening version of the Childhood Trauma Questionnaire. Child Abuse Negl. 2003;27(2):169-90.
- Peirce J, et al. PsychoPy2: experiments in behavior made easy. Behav Res Methods. 2019;51(1):195-203.
- Benedek M, Kaernbach C. A continuous measure of phasic electrodermal activity. J Neurosci Methods. 2010;190(1):80-91.
- Lonsdorf TB, et al. Don't fear "fear conditioning": methodological considerations for the design and analysis of studies on human fear acquisition, extinction, and return of fear. Neurosci Biobehav Rev. 2017;77:247-85.
- LeDoux JE, Moscarello J, Sears R, Campese V. The birth, death and resurrection of avoidance: a reconceptualization of a troubled paradigm. Mol Psychiatry. 2017;22(1):24-36.
- Wobbrock JO, Findlater L, Gergle D, Higgins JJ. The aligned rank transform for nonparametric factorial analyses using only ANOVA procedures. Presented at: Proceedings of the SIGCHI Conference on Human Factors in Computing Systems (CHI '11); New York (NY); 2011.
- Fritz MS, MacKinnon DP. Required sample size to detect the mediated effect. Psychol Sci. 2007;18(3):233-9.
- Bouton ME. Learning and behavior: a contemporary synthesis. Sinauer Associates; Sunderland (MA); 2007.
- Rescorla RA, Wagner AR. A theory of Pavlovian conditioning: variations in the effectiveness of reinforcement and nonreinforcement. In: Black AH, Prokasy WF, editors. Classical Conditioning II: Current Research and Theory. Appleton-Century-Crofts; New York (NY); 1972.
- McClelland GH, Judd CM. Statistical difficulties of detecting interactions and moderator effects. Psychol Bull. 1993;114(2):376-90.
- Maier SF, Seligman MEP. Learned helplessness at fifty: insights from neuroscience. Psychol Rev. 2016;123(4):349-67.
Access restricted. Please log in or start a trial to view this content.
Reprints and Permissions
This article has been published
Video Coming Soon