This protocol describes methods for evaluating the effects of paeoniflorin on oxidized low-density lipoprotein-induced dysfunction in RAW264.7 macrophages by assessing lipid metabolism, inflammatory responses, oxidative stress, apoptosis, and AMP-activated protein kinase-related signaling to support mechanistic studies of macrophage dysfunction.
Research Article
Paeoniflorin Attenuates Oxidized Low-Density Lipoprotein–Induced Dysfunction in RAW264.7 Cells with AMP-Activated Protein Kinase Involvement
* These authors contributed equally
In This Article
Summary
Abstract
This study describes a protocol integrating network pharmacology and in vitro experiments to evaluate the protective effects of Huangqin Tang (HQT) and one of its bioactive constituents, paeoniflorin (PF), against oxidized low-density lipoprotein (ox-LDL)-induced macrophage dysfunction and to investigate AMP-activated protein kinase (AMPK)-related signaling. Network pharmacology identified HQT targets and pathways associated with atherosclerosis (AS). An ox-LDL-induced RAW264.7 macrophage model was used to assess lipid accumulation, cholesterol efflux, adenosine triphosphate (ATP) levels, inflammatory responses, mitochondrial function, oxidative stress, apoptosis, and macrophage phenotypic markers. HQT and PF were compared at non-cytotoxic concentrations. AMPK involvement was evaluated using a cell thermal shift assay (CETSA), pharmacological inhibition, and small interfering RNA (siRNA)-mediated knockdown. ATP-binding cassette transporter A1 (ABCA1), liver X receptor alpha (LXRα), nuclear factor kappa B (NF-κB)-related proteins, and apoptosis-associated proteins were examined by western blotting. Network pharmacology identified 12 overlapping targets, including TNF, PPARG, and NOS3, enriched in pathways related to lipid metabolism, inflammation, AS, and AMPK signaling. Both PF and HQT increased AMPK phosphorylation, reduced ox-LDL-induced lipid accumulation and inflammatory cytokine secretion, and improved cholesterol efflux. PF restored ATP levels and mitochondrial membrane potential, reduced reactive oxygen species production and apoptosis, and increased ABCA1 expression. CETSA demonstrated enhanced AMPK thermal stability following PF treatment. Pharmacological inhibition or siRNA-mediated knockdown of AMPK attenuated PF-associated changes in ABCA1 expression, cholesterol efflux, lipid accumulation, LXRα activation, and NF-κB inhibition. PF reduced CD86⁺ macrophages and increased CD206⁺ macrophages, whereas AMPK silencing partially reversed these changes. NF-κB inhibition produced similar effects on cholesterol homeostasis and macrophage phenotypic markers. This protocol enables evaluation of PF- and HQT-mediated effects on ox-LDL-induced macrophage dysfunction and AMPK-related signaling. Under the tested conditions, PF protected RAW264.7 cells against ox-LDL-induced lipid metabolic dysfunction, inflammation, oxidative stress, mitochondrial dysfunction, and apoptosis, and PF and HQT produced directionally similar changes in macrophage-related endpoints.
Introduction
Cardiovascular diseases are a leading cause of morbidity and mortality worldwide, and atherosclerosis (AS) is a major pathological basis of many cardiovascular disorders1,2,3,4. AS is characterized by lipid accumulation5, chronic inflammation6, and the progressive formation of plaques within the arterial wall7. Its initiation and progression involve endothelial dysfunction, oxidative stress, dysregulated lipid metabolism, and sustained immune activation. Oxidized low-density lipoprotein (ox-LDL) promotes endothelial activation and the expression of adhesion molecules and chemokines, such as monocyte chemoattractant protein-1 (MCP-1), thereby facilitating monocyte recruitment into the arterial intima8. After differentiating into macrophages, these cells take up ox-LDL through scavenger receptors and gradually develop into lipid-laden foam cells9. This process is accompanied by increased production of reactive oxygen species (ROS) and pro-inflammatory cytokines10, which further aggravate vascular inflammation and oxidative injury. Among these inflammatory mediators, tumor necrosis factor-alpha (TNF-α) contributes to foam-cell formation and inflammatory signaling11, partly through activation of the nuclear factor kappa B (NF-κB) pathway. Under resting conditions, NF-κB is retained in the cytoplasm through its interaction with inhibitor of NF-κB alpha (IκB-α)12. Upon stimulation, IκB kinase (IKK) is activated, leading to the degradation of IκB-α and the subsequent translocation of NF-κB into the nucleus13, where it promotes the transcription of inflammatory genes, including TNF-α, interleukin-1 beta (IL-1β), and interleukin-6 (IL-6)14. Despite advances in lipid-lowering and anti-inflammatory therapies, substantial residual cardiovascular risk remains, highlighting the need to develop additional therapeutic strategies that simultaneously target multiple pathological processes involved in AS.
Traditional Chinese medicine (TCM) formulations contain multiple bioactive constituents that may exert therapeutic effects through interactions with diverse molecular targets and signaling pathways15,16. This multicomponent and multi-target mode of action may offer potential advantages for managing complex diseases such as AS. Huangqin Tang (HQT) is a classical TCM formula composed of four medicinal herbs: Scutellaria baicalensis (Huangqin), Paeonia lactiflora (Baishao), Glycyrrhiza uralensis (Gancao), and Ziziphus jujuba (Dazao)17,18. Bioactive constituents derived from these herbs have been reported to regulate lipid metabolism, alleviate inflammatory responses, and reduce oxidative stress19. However, the molecular targets and signaling pathways underlying the potential anti-atherosclerotic effects of HQT remain incompletely understood.
In the present study, network pharmacology was combined with in vitro experiments to establish a method for investigating the potential mechanisms underlying the protective effects of HQT and one of its bioactive constituents, paeoniflorin (PF), against ox-LDL-induced macrophage dysfunction. Network pharmacology analysis was first performed to identify candidate compounds, therapeutic targets, and signaling pathways associated with HQT and AS. Based on the predicted involvement of AMP-activated protein kinase (AMPK) signaling and previously published evidence, PF was selected for experimental validation. Its effects on lipid accumulation, cholesterol efflux, inflammatory responses, energy metabolism, mitochondrial function, oxidative stress, apoptosis, and macrophage phenotypic markers were evaluated in RAW264.7 cells. HQT and PF were also compared under non-cytotoxic conditions. Furthermore, pharmacological inhibition and small interfering RNA (siRNA)-mediated knockdown of AMPK were used to examine whether AMPK-dependent regulation of ATP-binding cassette transporter A1 (ABCA1) and liver X receptor alpha (LXRα)/NF-κB signaling contributed to the protective effects of PF. This integrated approach provides a framework for evaluating HQT- and PF-mediated effects on ox-LDL-induced macrophage dysfunction and determining whether this method is suitable for investigating AMPK-related mechanisms in similar in vitro models.
Protocol
GSE100927 was analyzed as a publicly accessible, non-identifiable secondary dataset. No participants were recruited, no new human specimens were collected, and no direct personal identifiers were accessed; therefore, additional institutional review board approval and informed consent were not required. The cell experiments used only an established murine macrophage cell line and did not involve live animals, primary animal tissues, human participants, or primary human materials; therefore, institutional human or animal ethics approval was not applicable.
Identification of HQT Bioactive Compounds and Targets
The Traditional Chinese Medicine Systems Pharmacology Database and Analysis Platform (TCMSP), PubMed, China National Knowledge Infrastructure (CNKI), and UniProt databases were accessed using the versions available on July 16, 2026. Scutellaria baicalensis Georgi, Paeonia lactiflora Pall., Glycyrrhiza uralensis Fisch., and Ziziphus jujuba Mill. were searched separately in the TCMSP database using their Latin, English, and Chinese medicinal names. Compounds with an oral bioavailability (OB) of ≥30% and a drug-likeness (DL) value of ≥0.18 were retained. Duplicate compounds identified in more than one botanical material were merged using the compound name and the corresponding TCMSP identifier.
PubMed was searched using the terms (“Huangqin Tang” OR “Huang-Qin-Tang” OR “Huang Qin Tang”) AND (constituent OR compound OR ingredient OR phytochemical OR target), and CNKI was searched using “Huangqin Tang” AND (“chemical constituents” OR “active ingredients” OR “pharmacological targets”). Articles published up to December 16, 2025 were screened. Compounds or targets were included only when their association with HQT or one of its four botanical components had been explicitly reported. Reviews lacking traceable primary evidence, unnamed compounds, and predicted targets without experimental or database support were excluded.
Protein targets were mapped using the identifier-mapping tool in the UniProt database, with the organism restricted to Homo sapiens (taxon identifier 9606). Approved human gene symbols were retained, whereas unmapped and duplicate entries were removed. The deduplicated compound–target edge list was imported into Cytoscape network visualization software (version 3.7.2), where the HQT compound–target network was constructed.
Identification and Bioinformatics Analysis of AS-Associated Targets
The GeneCards, Online Mendelian Inheritance in Man (OMIM), Comparative Toxicogenomics Database (CTD), and Gene Expression Omnibus (GEO) databases were accessed using the versions available on 16 July 2026. The term “atherosclerosis” was used to search GeneCards, OMIM, and CTD. Genes retrieved from GeneCards with a Relevance Score of ≥1.163, corresponding to the median score of all retrieved records, were retained. Only direct documented AS-associated genes from OMIM and CTD were included.
The GSE100927 series matrix, sample annotation file, and GPL17077 platform annotation file were downloaded from GEO. All 104 human peripheral artery samples were classified as AS or Control according to the repository phenotype metadata, and no samples were excluded based on arterial location.
Bioinformatics analyses were performed using R statistical software (version 4.3.2) with the limma package (version 3.58.1), ggplot2 package (version 3.4.4), ComplexHeatmap package (version 2.18.0), clusterProfiler package (version 4.10.1), and org.Hs.eg.db package (version 3.18.0). Probes were annotated using the GPL17077 platform annotation file, and probes lacking approved gene symbols were removed. Multiple probes mapping to the same gene were averaged using the avereps function. A log2(x + 1) transformation was applied only when the 99th percentile exceeded 100; otherwise, the supplied logarithmic values were retained. Arrays were normalized using the quantile method.
Samples were encoded as “Control” and “AS,” and a no-intercept design matrix was generated using model.matrix(~0 + group). Linear models were fitted using the lmFit, makeContrasts, contrasts.fit, and eBayes functions. All genes were extracted using topTable(number = Inf, adjust.method = “BH”). Differentially expressed genes were defined as those with an absolute log2 fold change greater than 1 and a nominal p value <0.05, while Benjamini–Hochberg-adjusted p values were retained in the complete output.
Volcano plots were generated using log2 fold-change values and −log₁₀ nominal p values. Heatmaps were constructed after row-wise z-score standardization of the selected genes. Identical preprocessing and visualization settings were applied to all samples.
Genes obtained from GeneCards, OMIM, CTD, and GEO were standardized using the UniProt database. Gene identifiers were converted to uppercase approved gene symbols, and blank, unmapped, and duplicate entries were removed within each data source. Consensus AS-associated targets were defined as genes identified in at least two of the four data sources. The intersect() function in R was used to identify genes shared with the standardized HQT target set.
The overlapping HQT-AS targets were submitted to the STRING database (version 12.0), accessed on 16 December 2025. The analysis was restricted to Homo sapiens, the minimum interaction score was set to 0.700, all evidence channels were retained, and no first- or second-shell interactors were added. The interaction table was exported and imported into Cytoscape as an undirected network. Self-loops and duplicate edges were removed, and degree, betweenness, and closeness centrality values were calculated using the CentiScaPe plugin (version 2.2). Hub genes were defined as those with all three centrality measures exceeding the corresponding network means.
Approved gene symbols were converted to Entrez identifiers using the bitr function. Unmapped and duplicated identifiers were removed, and all successfully mapped genes in the annotated dataset were used as the background. Gene Ontology enrichment analysis for all ontologies was performed using enrichGO (ont = “ALL”), and Kyoto Encyclopedia of Genes and Genomes pathway enrichment analysis was performed using enrichKEGG (organism = “hsa”). Benjamini–Hochberg correction was applied, and enriched terms with an adjusted p value <0.05 were retained.
The complete preprocessing, differential expression, visualization, and enrichment scripts were provided as TCMSP analysis.R and Transcriptome analysis.R. Based on the network analysis results and published evidence, paeoniflorin (PF), liquiritin, baicalin, wogonoside, and glycyrrhizic acid were identified as the major HQT constituents20. PF was selected as a representative compound because of its reported roles in regulating lipid metabolism and AMP-activated protein kinase signaling.
Preparation of the HQT Extract
Authenticated S. baicalensis Georgi, P. lactiflora Pall., G. uralensis Fisch., and Z. jujuba Mill. were combined at a dry-weight ratio of 3:2:2:3. Deionized water was added at a ratio of 1:10 (w/v), and the mixture was refluxed for 1 h. The extract was filtered while hot, and the residue was extracted a second time with deionized water at a ratio of 1:8 (w/v) for 1 h, as previously described19. The filtrates were combined, concentrated under reduced pressure at 60°C, and vacuum-dried to constant weight; the extraction yield was 36.34%. The dried extract was dissolved in sterile water at a concentration of 1 g/mL, filtered through a 0.22 µm membrane, aliquoted, and stored at −20°C until use. Experimental concentrations were expressed as micrograms of dried extract per milliliter of culture medium.
Cell Culture, Transfection, and Treatment
RAW264.7 murine macrophages were cultured in high-glucose Dulbecco's modified Eagle medium supplemented with 10% fetal bovine serum, 100 U/mL penicillin, and 100 µg/mL streptomycin at 37°C in a humidified incubator containing 5% CO2. Cells were subcultured at approximately 80% confluence, and only cells between passages 5 and 20 after thawing were used. Cell-line identity was verified against the repository certificate, and cell morphology, adherence, and growth characteristics were routinely monitored. Only mycoplasma-negative cultures were used. Cultures exhibiting contamination, abnormal growth, substantial vacuolization, extensive debris, marked detachment, or uneven cell distribution were discarded.
For AMPKα1 silencing, cells were seeded at 2 × 10⁵ cells per well in 2 mL of culture medium in 6-well plates and transfected at 50%–60% confluence. A total of 100 pmol of si-AMPKα1 or non-targeting siRNA was diluted in 125 µL of reduced-serum medium, while 5 µL of lipid-based transfection reagent was diluted separately in 125 µL of reduced-serum medium. After incubation for 15 min at room temperature, the two solutions were combined and added dropwise to the cells to achieve a final siRNA concentration of 50 nM. The si-AMPKα1 sequences were as follows: sense, 5′-CCCATCTTATAGTTCAACCAT-3′, and antisense, 5′-ATGGTTGAACTATAAGATGGG-3′. The culture medium was replaced after 6 h, and incubation was continued for a total of 48 h before ox-LDL and PF treatment. AMPKα1 knockdown was confirmed by qRT-PCR and western blotting, and only experiments demonstrating a significant reduction relative to the negative-control siRNA group were included in subsequent analyses.
PF, dorsomorphin, and BAY 11-7082 were prepared in dimethyl sulfoxide (DMSO), whereas HQT was prepared in sterile water. The final DMSO concentration was maintained at ≤0.1% in all treatment groups, and the corresponding vehicle was added to the control groups.
For concentration screening, cells were treated for 24 h with PF at 0, 1, 5, 10, 20, or 40 µM or HQT at 0, 12.5, 25, 50, 100, or 200 µg/mL. Cell viability and AMPK phosphorylation were subsequently assessed. Based on these results, 20 µM PF and 100 µg/mL HQT were selected for all subsequent experiments.
For comparison of PF and HQT, treatment groups included a control group, a 50 µg/mL ox-LDL group, an ox-LDL plus 20 µM PF group, and an ox-LDL plus 100 µg/mL HQT group. All groups were incubated for 24 h. For pharmacological inhibition of AMPK, the ox-LDL plus PF group was pretreated with 10 µM dorsomorphin for 1 h before the 24 h co-treatment21,22.
For genetic inhibition of AMPK, cells were transfected with si-NC or si-AMPKα1 for 48 h and then assigned to the Control, ox-LDL, PF, or si-AMPK plus PF groups. The PF and si-AMPK plus PF groups received 50 µg/mL ox-LDL together with 20 µM PF for 24 h. The ox-LDL group received ox-LDL alone, whereas the Control group received the corresponding vehicle.
To evaluate the involvement of NF-κB signaling, an additional treatment group was pretreated with 10 µM BAY 11-7082 for 1 h before exposure to 50 µg/mL ox-LDL for 24 h23,24,25. ABCA1 expression, cholesterol efflux, lipid accumulation, and the proportions of CD86⁺ and CD206⁺ macrophages were subsequently determined.
Unless otherwise specified, cells were seeded 12–16 h before treatment, and three replicate wells were used for each treatment group. Each assay was performed using three independently cultured cell preparations on different days (n = 3), except for the cell viability screening, which consisted of five independent experiments with five technical replicate wells per concentration. Technical replicates, duplicate measurements, and multiple microscopic fields were averaged hierarchically to obtain a single value for each independent experiment.
Only cultures that were evenly attached and approximately 60%–80% confluent, or 50%–60% confluent for transfection experiments, were used for treatment. Essential materials, software, and equipment are listed in the accompanying Table of Materials.
Cell Viability Assay and Quantitative Real-Time PCR
RAW264.7 cells were seeded at 5 × 10³ cells per well in 96-well plates and allowed to attach overnight. Cells were treated for 24 h with the PF and HQT concentrations described in Section 4. Cell viability was determined by replacing the culture medium with 100 µL of cell viability assay working solution, followed by incubation for 2 h at 37°C in the dark. Absorbance was measured at 450 nm.
Reagent-only blank wells were included, and their absorbance values were subtracted from all measurements. Absorbance values from five technical replicate wells for each concentration were averaged. Cell viability was calculated as (treated-group absorbance/control-group absorbance) × 100, with the untreated control defined as 100%. Five independent experiments were performed.
Total RNA was extracted using a phenol–guanidinium RNA extraction reagent, and only samples with A260/A280 values between 1.8 and 2.0 were used. One microgram of total RNA was reverse transcribed, and each 20 µL quantitative PCR (qPCR) reaction contained 10 µL of 2× SYBR Green master mix, 0.4 µL each of 10 µM forward and reverse primers, 2 µL of cDNA, and 7.2 µL of nuclease-free water.
Quantitative PCR was performed at 95°C for 30 s, followed by 40 cycles of 95°C for 10 s and 60°C for 30 s. A melting-curve analysis was subsequently performed from 65°C to 95°C. The primer sequences were as follows: Prkaa1 forward, 5′-ACCAGAAGCGGTGCCGGAAAGCTGG-3′; Prkaa1 reverse, 5′-TGTAGTCGGTTTATGCAGCAACGAG-3′; Gapdh forward, 5′-CGACTTCAACAGCAACTCCCACTCTTCC-3′; and Gapdh reverse, 5′-TGGGTGGTCCAGGGTTTCTTACTCCTT-3′.
Each sample was analyzed in technical triplicate, and no-template controls were included. Primer pairs were accepted only when a single melting peak was observed and no amplification was detected in the no-template controls. Relative Prkaa1 expression was calculated using the 2−ΔΔCt method with Gapdh as the reference gene, and expression in the si-NC group was normalized to 1.
Measurement of Lipid Accumulation, ATP Levels, and Cholesterol Efflux
For Oil Red O staining, RAW264.7 cells were seeded at 5 × 10⁴ cells per well in 500 µL of culture medium in 24-well plates. Following treatment, the cells were washed twice with 500 µL of phosphate-buffered saline (PBS), fixed with 500 µL of 10% neutral-buffered formalin for 20 min, washed twice with PBS, rinsed once with 500 µL of 60% isopropanol, and stained with 500 µL of freshly prepared Oil Red O working solution for 15 min at room temperature. The stained cells were washed with distilled water until the background was clear. Five microscopic fields were acquired from each well as described in Section 8, and the Oil Red O-positive area was calculated as the positive area divided by the total field area × 100 using a fixed color threshold. Staining results were accepted only when the control cells exhibited minimal staining, the ox-LDL-treated cells displayed discrete intracellular lipid droplets, and the extracellular background remained clear. Samples showing diffuse precipitates, uneven staining, or extensive cell detachment were excluded and the staining procedure was repeated.
For ATP measurement, cells were seeded at 5 × 10⁵ cells per well in 2 mL of culture medium in 6-well plates. Following treatment, the cells were washed twice with 1 mL of ice-cold PBS, lysed with 200 µL of ATP assay lysis buffer, and centrifuged at 12,000 × g for 5 min at 4°C. A 10 µL aliquot of the supernatant was mixed with 100 µL of ATP detection reagent, and chemiluminescence was measured. ATP concentrations were calculated from a standard curve. Each lysate was measured in duplicate, and three replicate wells were analyzed in each of three independent experiments.
For cholesterol efflux analysis, cells were seeded at 5 × 10⁴ cells per well in 500 µL of culture medium in 24-well plates. Following treatment, the cells were loaded with 1 µg/mL NBD-cholesterol for 24 h, washed three times with 500 µL of PBS, and incubated for 4 h in 500 µL of serum-free medium containing either 10 µg/mL apolipoprotein A-I or 50 µg/mL high-density lipoprotein. Culture supernatants were collected and centrifuged at 1,000 × g for 5 min. The cells were washed twice with PBS and lysed with 200 µL of lysis buffer. Fluorescence in the supernatants and lysates was measured in duplicate at excitation and emission wavelengths of 485 and 535 nm, respectively. Fluorescence values obtained from wells without NBD-cholesterol were subtracted, and cholesterol efflux was calculated as supernatant fluorescence divided by the sum of supernatant and lysate fluorescence × 100 for each cholesterol acceptor.
Measurement of Inflammatory Cytokines, Mitochondrial Membrane Potential, Reactive Oxygen Species, and Apoptosis
For enzyme-linked immunosorbent assay (ELISA), RAW264.7 cells were seeded at 5 × 10⁵ cells per well in 2 mL of culture medium in 6-well plates. Following 24 h of treatment, culture supernatants were collected, centrifuged at 1,000 × g for 10 min at 4°C, and either analyzed immediately or aliquoted and stored at −80°C until analysis. Repeated freeze-thaw cycles were avoided. Mouse TNF-α, IL-6, and IL-1β concentrations were measured using sandwich ELISA kits. All reagents were equilibrated to room temperature before use. Standards, blanks, and samples were loaded in duplicate at 100 µL per well. Wells were washed five times with 300 µL of wash buffer after each antibody incubation. Color development was achieved using tetramethylbenzidine substrate, the reaction was terminated according to the manufacturer's instructions, and absorbance was measured at 450 nm. Cytokine concentrations were calculated from four-parameter logistic standard curves and expressed as pg/mL. Measurements with duplicate coefficients of variation greater than 15% were repeated, and samples exceeding the assay range were diluted before reanalysis.
For mitochondrial membrane potential analysis, cells were seeded at 5 × 10⁴ cells per well in 500 µL of culture medium in 24-well plates. Following treatment, the cells were washed twice and incubated with 500 µL of JC-1 working solution for 20 min at 37°C in the dark. The cells were then washed twice with staining buffer, and red aggregate and green monomer fluorescence were acquired from identical microscopic fields at excitation/emission wavelengths of 525/590 nm and 490/530 nm, respectively. The background-subtracted green-to-red fluorescence ratio was subsequently calculated.
For intracellular reactive oxygen species (ROS) analysis, cells were seeded at 5 × 10⁴ cells per well in 24-well plates. Following treatment, the cells were washed twice with serum-free medium and incubated with 10 µL of 2′,7′-dichlorodihydrofluorescein diacetate diluted in 200 µL of culture medium for 2 h at 37°C in the dark. The plates were gently agitated every 5 min during incubation. The cells were then washed three times, and fluorescence was measured at excitation and emission wavelengths of 488 and 525 nm, respectively.
For apoptosis analysis, cells were seeded at 5 × 10⁴ cells per well in 24-well plates. Following treatment, the cells were washed twice, fixed with 4% paraformaldehyde for 20 min, washed three times, and permeabilized with 0.1% Triton X-100 in PBS for 10 min. A total of 250 µL of terminal deoxynucleotidyl transferase dUTP nick-end labeling (TUNEL) reaction mixture was added, and the cells were incubated for 60 min at 37°C in a humidified dark chamber. After three washes, nuclei were counterstained with 4′,6-diamidino-2-phenylindole (DAPI) for 5 min. A negative control lacking terminal deoxynucleotidyl transferase was included in each experiment.
Preserved mitochondrial membrane potential was indicated by predominantly punctate red JC-1 fluorescence, whereas membrane depolarization was indicated by increased diffuse green fluorescence. ROS images were accepted only when the green fluorescence was intracellular and free of precipitates or signal saturation. Apoptosis staining was accepted only when red fluorescence was predominantly nuclear and the enzyme-omitted control exhibited minimal background signal.
Image Acquisition and Quantitative Analysis
Bright-field and fluorescence images were acquired using an inverted fluorescence microscope equipped with a digital camera and a 20× objective. Five non-overlapping fields were collected from each well, including one central field and four peripheral fields. Areas containing scratches, well edges, detached cell sheets, or large debris were excluded before treatment identities were revealed. Automatic exposure and gain settings were disabled. Illumination intensity, exposure time, gain, objective, and image dimensions were established using representative Control and ox-LDL wells to ensure that the strongest fluorescence signal remained unsaturated. Identical image acquisition settings were maintained for all treatment groups within each independent experiment. Paired red and green fluorescence channels were acquired without repositioning the microscope stage. Unadjusted images were analyzed using ImageJ image analysis software while the investigator remained blinded to treatment allocation. Background signal from a cell-free region was subtracted, and image thresholds were established using representative Control and ox-LDL images. The same thresholds were applied throughout each experiment. Only uniform whole-image adjustments were applied for figure presentation. JC-1 results were expressed as the green-to-red fluorescence ratio. Reactive oxygen species and apoptosis signals were expressed as background-subtracted mean fluorescence normalized to the analyzed area, with the mean value of the Control group normalized to 1 for relative analyses. Five microscopic fields were averaged to obtain one value for each well, and the values from three wells were averaged to generate one value for each independent experiment.
Western Blot Analysis
RAW264.7 cells were seeded at 5 × 10⁵ cells per well in 2 mL of culture medium in 6-well plates, and one protein lysate was prepared from each well. For whole-cell protein extraction, the cells were washed twice with ice-cold PBS, lysed for 30 min on ice using radioimmunoprecipitation assay (RIPA) buffer supplemented with protease and phosphatase inhibitors, and centrifuged at 12,000 × g for 15 min at 4°C. For nuclear protein extraction, cells were suspended in a buffer containing 10 mM HEPES, 10 mM KCl, 1.5 mM MgCl2, 0.5 mM dithiothreitol, and protease/phosphatase inhibitors and incubated on ice for 15 min. A nonionic detergent was added to a final concentration of 0.5%, followed by brief vortexing and centrifugation at 700 × g for 5 min at 4°C. The nuclear pellet was extracted for 30 min on ice with intermittent mixing in a buffer containing 20 mM HEPES, 420 mM NaCl, 1.5 mM MgCl2, 0.2 mM EDTA, 25% glycerol, 0.5 mM dithiothreitol, and protease/phosphatase inhibitors. The extract was subsequently centrifuged at 14,000 × g for 15 min at 4°C.
Protein concentrations were determined using the bicinchoninic acid assay. Equal amounts of protein (25–30 µg) were loaded into each lane, heated at 95°C for 5 min, separated on 8%–12% sodium dodecyl sulfate–polyacrylamide gels, and transferred onto 0.45 µm polyvinylidene fluoride membranes at 100 V for 90 min under cooling conditions. Membranes containing total proteins were blocked with 5% non-fat milk, whereas membranes containing phosphorylated proteins were blocked with 5% bovine serum albumin prepared in Tris-buffered saline containing polysorbate 20 for 1 h. Membranes were incubated overnight at 4°C with primary antibodies against AMPK, phosphorylated AMPK, BAX, BCL-2, caspase-3, ABCA1, p65, phosphorylated p65, LXRα, IκB-α, phosphorylated IκB-α, and histone H3 at a dilution of 1:1,000, except for histone H3, which was used at a dilution of 1:2,000. GAPDH and β-actin antibodies were used at a dilution of 1:5,000. Following primary antibody incubation, membranes were washed three times for 10 min each and incubated for 1 h with horseradish peroxidase-conjugated goat anti-rabbit or goat anti-mouse secondary antibodies diluted 1:5,000. After additional washing, protein bands were detected using an enhanced chemiluminescence detection reagent. The shortest exposure producing unsaturated bands for all target proteins was selected, and identical exposure and image acquisition settings were maintained for all groups on the same membrane.
Protein bands were quantified using ImageJ image analysis software following local background subtraction. Total AMPK, ABCA1, BAX, BCL-2, caspase-3, IκB-α, and phosphorylated IκB-α were normalized to GAPDH or β-actin. Phosphorylated AMPK-to-total AMPK and phosphorylated p65-to-total p65 ratios were calculated. Nuclear LXRα, p65, and phosphorylated p65 levels were normalized to histone H3, and the mean value of the Control or si-NC group within each independent experiment was normalized to 1. Only blots showing discrete bands at the expected molecular weights, low background, unsaturated signals, and comparable loading controls were included in the analysis. Membranes exhibiting distorted lanes, incomplete protein transfer, excessive background, or signal saturation were reprocessed or excluded. Three independent experiments were performed using separately prepared protein lysates.
Cell Thermal Shift Assay
RAW264.7 cells were seeded at 3 × 10⁶ cells in 10 mL of culture medium in 100 mm culture dishes and incubated overnight. Cells were harvested, washed twice with ice-cold PBS, lysed for 30 min on ice in PBS containing 0.4% NP-40 and protease/phosphatase inhibitors, and centrifuged at 20,000 × g for 20 min at 4°C. The clarified lysates were adjusted to a protein concentration of 2 mg/mL. Equal volumes of clarified lysate were incubated with either 20 µM PF or 0.1% DMSO for 1 h at room temperature. Each sample was divided into 50 µL aliquots and heated for 3 min at 37°C, 41°C, 45°C, 49°C, 53°C, 57°C, 61°C, 65°C, 69°C, or 73°C. Samples were immediately cooled at 4°C for 3 min and centrifuged at 20,000 × g for 20 min at 4°C. Equal volumes of the soluble supernatants were analyzed by western blotting to detect AMPK and phosphorylated AMPK. The signal obtained at each temperature was normalized to the corresponding 37°C signal, which was defined as 100%. Soluble protein abundance was plotted as a function of temperature, and the complete assay was repeated three times using independently cultured cells. Only experiments showing a detectable 37°C reference band, progressive loss of soluble AMPK with increasing temperature, and the absence of severe lane distortion or anomalous increases in soluble protein at the highest temperatures were included in the analysis.
Flow Cytometry Analysis
RAW264.7 cells were seeded at 5 × 10⁵ cells per well in 2 mL of culture medium in 6-well plates. Following treatment, the cells were washed twice with ice-cold PBS and gently detached using a cell scraper in PBS containing 2% fetal bovine serum and 2 mM EDTA. Cell suspensions were centrifuged at 400 × g for 5 min at 4°C, washed twice with PBS, and adjusted to a concentration of approximately 1 × 10⁶ cells per sample. Cells were stained with a fixable amine-reactive viability dye for 20 min at room temperature in the dark. Following washing, Fc receptors were blocked with an anti-mouse CD16/32 antibody for 15 min at 4°C. Fluorochrome-conjugated antibodies against CD45, CD11b, F4/80, CD86, and CD206 were added at 5 µL per antibody for every 1 × 10⁶ cells, and the cells were incubated for 30 min at 4°C in the dark.
Following antibody staining, cells were washed twice, resuspended in 300 µL of staining buffer, and analyzed by flow cytometry. At least 50,000 total events and, whenever possible, at least 20,000 viable CD45⁺CD11b⁺F4/80⁺ events were acquired for each sample. Unstained controls, single-stained compensation controls, and fluorescence-minus-one controls for CD86 and CD206 were included. The same compensation matrix was applied to all treatment groups within each experiment. Debris was excluded on the basis of forward- and side-scatter characteristics, and doublets were excluded using forward-scatter area versus forward-scatter height. Viability dye-negative cells were identified, CD45⁺ cells were gated, and macrophages were defined as CD11b⁺F4/80⁺ cells. CD86⁺ and CD206⁺ cells were quantified within the macrophage gate using thresholds established from the corresponding fluorescence-minus-one controls. The same gating hierarchy was applied to all samples. One stained cell suspension was prepared from each of three replicate wells, and the percentages obtained from the three wells were averaged to generate one value for each independent experiment. The experiment was repeated three times using independently cultured cells.
Safety and Waste Disposal
All cell culture procedures, ox-LDL handling, and processing of cell-derived materials were performed in a Class II biological safety cabinet in accordance with biosafety level 2 practices. Laboratory coats, gloves, and eye protection were worn throughout all procedures. Work surfaces and equipment were decontaminated after use. Formaldehyde and paraformaldehyde were handled with appropriate precautions because of their toxicity and potential carcinogenicity. Fixatives, Oil Red O solutions, DMSO-containing solutions, and fluorescent staining solutions were handled using appropriate personal protective equipment and adequate ventilation. Fixatives, staining solutions, DMSO-containing solutions, and ox-LDL-containing culture media were collected separately and disposed of as hazardous chemical waste in accordance with institutional regulations. Cell-containing culture media, contaminated consumables, and flow cytometry samples were treated as biological waste. Liquid biological waste was disinfected with freshly prepared 10% sodium hypochlorite for at least 30 min, and solid biological waste was autoclaved before disposal in accordance with institutional biosafety procedures.
Statistical Analysis
All statistical analyses were performed using GraphPad Prism statistical software (version 10.1.2). Data are presented as the mean ± standard deviation. The value of n represented the number of independent experiments rather than the number of technical replicate wells, instrument measurements, or microscopic fields. Hierarchically averaged values obtained from each independent experiment, as described in the preceding sections, were used for all statistical analyses. Comparisons between two groups were performed using an unpaired two-tailed Student's t-test. Comparisons among three or more groups were performed using one-way analysis of variance followed by Tukey's multiple-comparisons test. All statistical tests were two-sided, and a p value <0.05 was considered statistically significant.
Results
Active compounds of HQT and their targets
A total of 137 candidate bioactive compounds were identified from HQT through screening and integration of data obtained from the TCM Systems Pharmacology database. After duplicate entries were removed, 391 unique putative targets associated with these compounds were retained. An HQT–compound–target interaction network was subsequently constructed using Cytoscape version 3.7.2, as shown in Figure 1.
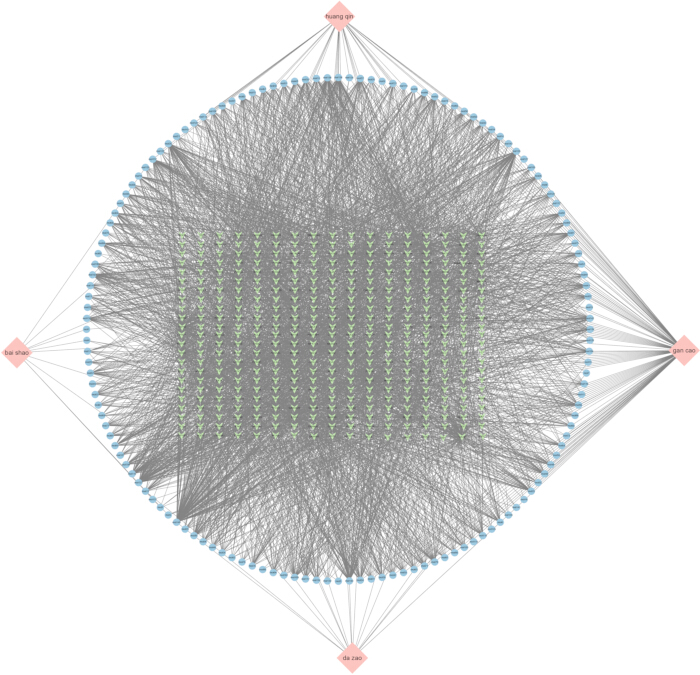
Figure 1. Predicted interaction network of Huangqin Tang constituents and putative targets. Network showing predicted interactions among the four herbal components of Huangqin Tang (HQT), candidate bioactive constituents, and putative molecular targets. Pink diamond-shaped nodes represent the four herbal components, blue circular nodes represent candidate compounds, and green nodes represent predicted targets. Edges indicate predicted herb–compound or compound–target associations. Please click here to view a larger version of this figure.
Identification of targets associated with HQT intervention in AS
Gene expression data from the GSE100927 dataset were obtained from the Gene Expression Omnibus database. Differential expression analysis identified 1,513 significantly upregulated genes and 922 significantly downregulated genes in atherosclerotic arterial samples compared with control arterial samples. The corresponding volcano plot and heatmap are shown in Figure 2A and Figure 2B, respectively. AS-related targets were subsequently retrieved from the GeneCards, Online Mendelian Inheritance in Man, and Comparative Toxicogenomics databases. Using a relevance score threshold of ≥1.163, 600 potential targets were obtained from GeneCards, whereas 188 and 64 targets were retrieved from the Online Mendelian Inheritance in Man and Comparative Toxicogenomics databases, respectively, as summarized in Figure 2C. Integration of the database-derived targets with the differentially expressed genes identified 29 AS-associated targets supported by at least two data sources. These targets were then compared with the predicted targets of HQT, yielding 12 overlapping targets that were considered candidate targets through which HQT may exert its effects on AS (Figure 2D).
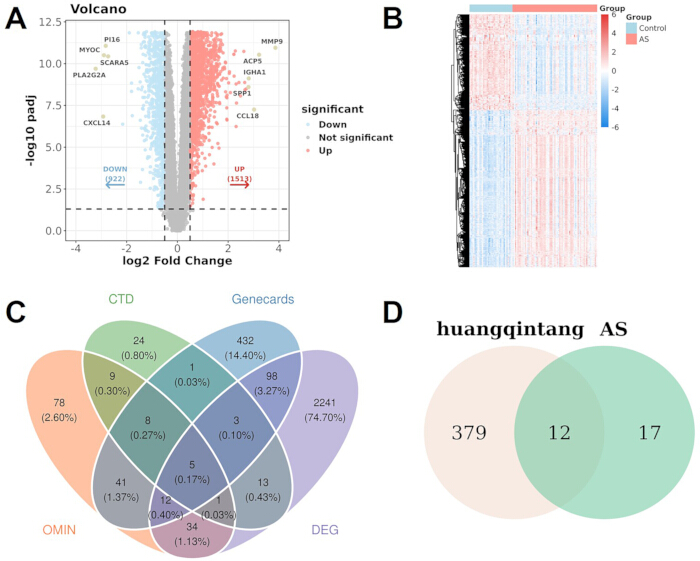
Figure 2. Identification of atherosclerosis-associated genes and their overlap with predicted Huangqin Tang targets. (A) Volcano plot showing differentially expressed genes (DEGs) between atherosclerosis (AS) and control arterial samples in the GSE100927 dataset. Red and blue points represent upregulated and downregulated genes, respectively, and gray points represent genes that were not significantly differentially expressed. (B) Heatmap showing the expression patterns of DEGs in control and AS samples. (C) Venn diagram showing the overlap among AS-associated genes obtained from the Comparative Toxicogenomics Database, GeneCards, Online Mendelian Inheritance in Man, and the GSE100927 DEG analysis. (D) Venn diagram showing the overlap between predicted HQT targets and AS-associated targets retained from at least two sources in panel C. Please click here to view a larger version of this figure.
Protein–protein interaction network and functional enrichment analyses of the candidate targets
To characterize the interactions and biological relevance of the 12 overlapping targets, a protein–protein interaction (PPI) network was constructed using the STRING database and subsequently visualized and analyzed in Cytoscape. The network contained several targets closely associated with lipid metabolism, vascular inflammation, and AS, including NOS3, OLR1, ALOX5, SPP1, ESR1, IL10, TNF, and VCAM1 (Figure 3A). Larger and darker nodes represented targets with greater topological importance within the network, suggesting that these proteins may occupy relatively central positions in the potential target network of HQT against AS. To further characterize the biological functions and signaling pathways associated with these targets, Gene Ontology (GO) and Kyoto Encyclopedia of Genes and Genomes (KEGG) enrichment analyses were performed. GO biological process (BP) analysis showed that the targets were mainly associated with steroid metabolic processes, responses to steroid hormones and nutrient levels, and the regulation of lipid homeostasis (Figure 3B). GO cellular component (CC) analysis indicated predominant enrichment in membrane rafts and related membrane microdomains (Figure 3C), whereas GO molecular function (MF) analysis revealed enrichment in low-density lipoprotein particle receptor activity, lipoprotein particle receptor activity, protease binding, cytokine activity, nuclear receptor activity, ligand-modulated transcription factor activity, cargo receptor activity, transcription coregulator binding, nuclear receptor binding, and integrin binding (Figure 3D). KEGG pathway analysis further demonstrated significant enrichment in pathways related to lipid metabolism, AS, and metabolic regulation, including the Lipid and Atherosclerosis pathway, the advanced glycation end product–receptor for advanced glycation end product (AGE–RAGE) signaling pathway in diabetic complications, and the AMPK signaling pathway (Figure 3E). Collectively, the PPI network and enrichment analyses indicated that the candidate targets may participate in the regulation of lipid homeostasis, inflammatory signaling, and energy metabolism. In particular, enrichment of the AMPK signaling pathway provided a rationale for subsequently examining AMPK-related effects of PF in vitro.
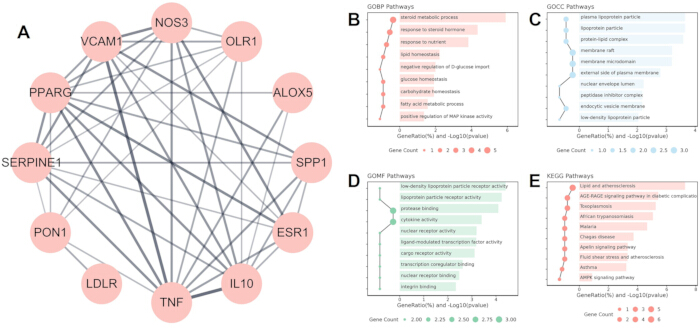
Figure 3. Protein–protein interaction network and functional enrichment analysis of overlapping Huangqin Tang and atherosclerosis targets. (A) Protein–protein interaction network of the overlapping targets between HQT and AS. Nodes represent proteins, and edges represent predicted or documented protein–protein associations. (B) Gene Ontology biological process enrichment analysis. (C) Gene Ontology cellular component enrichment analysis. (D) Gene Ontology molecular function enrichment analysis. (E) Kyoto Encyclopedia of Genes and Genomes pathway enrichment analysis. Point size represents the number of enriched genes, and the horizontal bars represent the corresponding enrichment significance and gene ratio, as indicated on the axes. Please click here to view a larger version of this figure.
PF and HQT activate AMPK and exert protective effects against ox-LDL-induced macrophage dysfunction
To determine suitable concentrations for subsequent experiments, the effects of PF and HQT on RAW264.7 cell viability were first evaluated. Treatment with PF at concentrations ranging from 1 to 40 µM did not markedly affect cell viability compared with the untreated control group (Figure 4A). Similarly, HQT at concentrations ranging from 12.5 to 200 µg/mL did not induce an evident reduction in cell viability (Figure 4B). These results indicated that the tested concentrations of PF and HQT were generally well tolerated by RAW264.7 macrophages. Western blot analysis was subsequently performed to assess the effects of PF and HQT on AMPK activation. Total AMPK expression remained relatively stable among the different treatment groups, whereas PF increased the p-AMPK/AMPK ratio in a concentration-related manner. HQT treatment also enhanced AMPK phosphorylation at the tested concentrations (Figure 4C). Based on the preservation of cell viability and the observed activation of AMPK, 20 µM PF and 100 µg/mL HQT were selected for subsequent comparative experiments. Oil Red O staining showed that ox-LDL exposure markedly increased intracellular lipid accumulation in RAW264.7 cells. Treatment with either PF or HQT significantly reduced the Oil Red O-positive area compared with the ox-LDL group (Figure 4D). In parallel, ox-LDL exposure impaired both ApoA-I-mediated and HDL-mediated cholesterol efflux. PF treatment significantly restored both forms of cholesterol efflux, and HQT produced a similar improvement in cellular cholesterol export (Figure 4E,F). Ox-LDL exposure also markedly increased the secretion of the pro-inflammatory cytokines TNF-α, IL-6, and IL-1β. Treatment with PF significantly reduced the concentrations of all three cytokines in the culture supernatant. HQT treatment similarly attenuated ox-LDL-induced cytokine secretion (Figure 4G). Collectively, these results indicate that PF reproduces several protective effects observed with the complete HQT preparation, including AMPK activation, reduced lipid accumulation, enhanced cholesterol efflux, and suppression of inflammatory responses. These findings support the selection of PF as a bioactive constituent of HQT for subsequent mechanistic investigation.
A cellular thermal shift assay (CETSA) was further performed to assess whether PF affected the thermal stability of AMPK. As the incubation temperature increased, the detectable levels of AMPK and phosphorylated AMPK gradually decreased in both vehicle- and PF-treated samples. However, PF treatment increased the retention of AMPK and p-AMPK at several temperatures compared with the corresponding vehicle-treated samples (Figure 4H,I). These findings suggest that PF enhances the thermal stability of AMPK and are consistent with potential target engagement between PF and AMPK. On the basis of these results, subsequent experiments investigated whether pharmacological or genetic inhibition of AMPK attenuated the protective effects of PF in ox-LDL-treated macrophages.
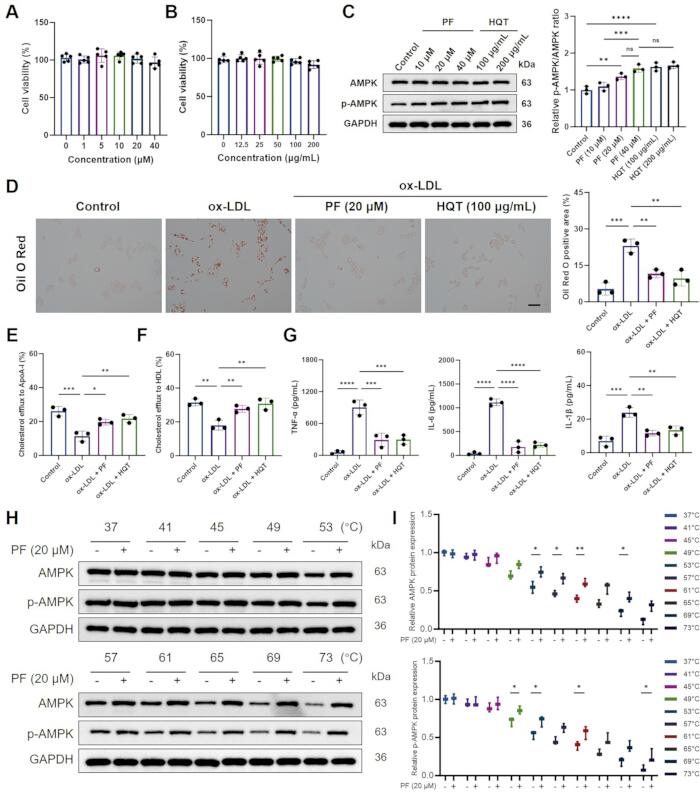
Figure 4. Paeoniflorin and Huangqin Tang activate AMPK and alleviate oxidized low-density lipoprotein-induced macrophage dysfunction. (A) RAW264.7 cell viability following treatment with the indicated concentrations of paeoniflorin (PF; n = 5). (B) Cell viability following treatment with the indicated concentrations of HQT extract (n = 5). (C) Representative western blots of AMPK and phosphorylated AMPK and quantification of the p-AMPK/AMPK ratio following PF or HQT treatment (n = 3). GAPDH was used as the loading control. (D) Representative Oil Red O staining images and quantification of intracellular lipid accumulation (n = 3). Scale bar = 100 µm. (E) Apolipoprotein A-I-mediated cholesterol efflux (n = 3). (F) High-density lipoprotein-mediated cholesterol efflux (n = 3). (G) TNF-α, IL-6, and IL-1β concentrations in culture supernatants measured by ELISA (n = 3). (H) Representative cellular thermal shift assay blots of AMPK and p-AMPK following incubation at the indicated temperatures in the absence or presence of PF. GAPDH was used as the loading control. (I) Quantification of the thermal stability of AMPK and p-AMPK (n = 3). Data are presented as the mean ± SD. Statistical significance is indicated as *P < 0.05, **P < 0.01, ***P < 0.001, and ****P < 0.0001. Horizontal bars identify the tested pairwise comparisons. In panel C, the indicated comparisons were Control versus PF (20 µM), PF (10 µM) versus PF (40 µM), PF (20 µM) versus PF (40 µM), Control versus HQT (100 µg/mL), and PF (40 µM) versus HQT (200 µg/mL). In panels D–G, the indicated comparisons were Control versus ox-LDL, ox-LDL versus ox-LDL + PF, and ox-LDL versus ox-LDL + HQT. In panel I, vehicle- and PF-treated samples were compared at each temperature indicated by a horizontal bar. Please click here to view a larger version of this figure.
PF reduces lipid accumulation and inflammatory cytokine release and restores intracellular ATP in ox-LDL-treated RAW264.7 cells
Oil Red O staining showed that ox-LDL treatment induced marked intracellular lipid accumulation and foam-cell formation in RAW264.7 cells, as evidenced by numerous intensely stained lipid droplets compared with the control group (Figure 5A,B). PF treatment significantly reduced both the number and stained area of lipid droplets relative to the ox-LDL group. Consistent with this improvement in lipid accumulation, PF also attenuated the ox-LDL-induced inflammatory response. The levels of TNF-α, IL-6, and IL-1β in the culture supernatants were significantly increased following ox-LDL exposure but were markedly reduced by PF treatment (Figure 5C–E). In addition, ox-LDL significantly decreased intracellular ATP levels, whereas PF partially restored ATP content, indicating an improvement in cellular energy status (Figure 5F). Ox-LDL also impaired ApoA-I-mediated and HDL-mediated cholesterol efflux, whereas PF significantly enhanced both forms of cholesterol efflux relative to the ox-LDL group (Figure 5G,H). Co-treatment with the AMPK inhibitor dorsomorphin partially attenuated each of these effects of PF, resulting in increased lipid accumulation and pro-inflammatory cytokine levels, together with reduced ATP content and cholesterol efflux, compared with PF treatment alone (Figure 5B–H). Collectively, these findings indicate that PF alleviates ox-LDL-induced disturbances in lipid handling, inflammatory responses, and cellular energy homeostasis in RAW264.7 cells, with AMPK signaling potentially contributing to these coordinated protective effects.
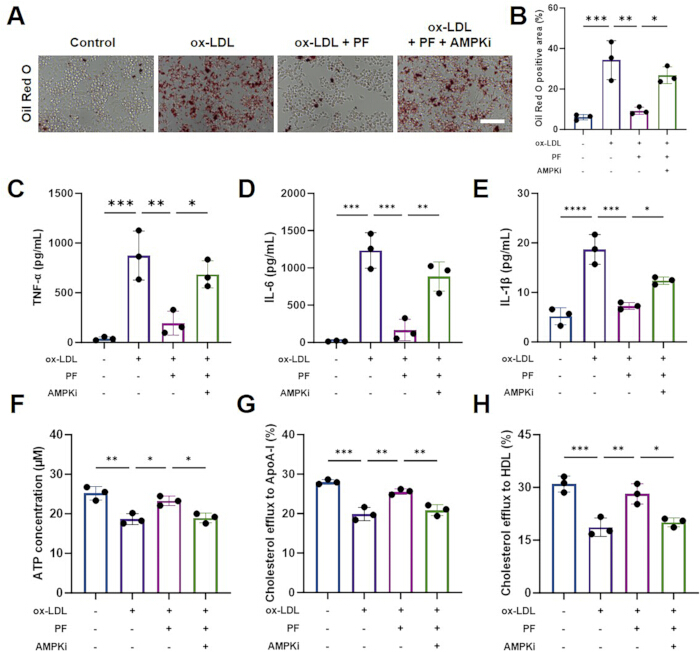
Figure 5. AMPK inhibition attenuates paeoniflorin-mediated reductions in inflammation and lipid accumulation and improvements in ATP content and cholesterol efflux. (A) Representative Oil Red O staining images of RAW264.7 cells. Scale bar = 100 µm. (B) Quantification of the Oil Red O-positive area (n = 3). (C–E) TNF-α, IL-6, and IL-1β concentrations, respectively, in culture supernatants measured by ELISA (n = 3). (F) Intracellular ATP concentration (n = 3). (G) Apolipoprotein A-I-mediated cholesterol efflux (n = 3). (H) High-density lipoprotein-mediated cholesterol efflux (n = 3). AMPKi denotes the AMPK inhibitor dorsomorphin. Data are presented as the mean ± SD of three independent experiments. Statistical significance is indicated as *P < 0.05, **P < 0.01, ***P < 0.001, and ****P < 0.0001. Horizontal bars identify the tested pairwise comparisons. In panels B–H, the indicated comparisons were Control versus ox-LDL, ox-LDL versus ox-LDL + PF, and ox-LDL + PF versus ox-LDL + PF + AMPKi. Please click here to view a larger version of this figure.
PF attenuates ox-LDL-induced mitochondrial dysfunction, oxidative stress, and apoptosis
TUNEL staining showed that ox-LDL markedly increased TUNEL fluorescence in RAW264.7 cells, indicating enhanced apoptosis, whereas PF treatment significantly reduced ox-LDL-induced TUNEL fluorescence. Co-treatment with the AMPK inhibitor dorsomorphin partially reversed the anti-apoptotic effect of PF (Figure 6A,B). Consistently, ox-LDL markedly increased intracellular ROS levels, as indicated by enhanced DCFH-DA fluorescence, whereas PF significantly reduced ROS accumulation; this antioxidant effect was partially reversed by dorsomorphin (Figure 6C,D). JC-1 staining further showed that ox-LDL treatment decreased red JC-1 aggregate fluorescence and increased green JC-1 monomer fluorescence, resulting in a significantly increased green-to-red fluorescence ratio, indicative of mitochondrial membrane depolarization. PF treatment markedly reduced the green-to-red fluorescence ratio, whereas co-treatment with dorsomorphin partially reversed this effect (Figure 6E,F). Collectively, these findings indicate that PF alleviates ox-LDL-induced mitochondrial membrane depolarization, excessive ROS production, and apoptosis in RAW264.7 cells, with AMPK signaling potentially contributing to these protective effects.
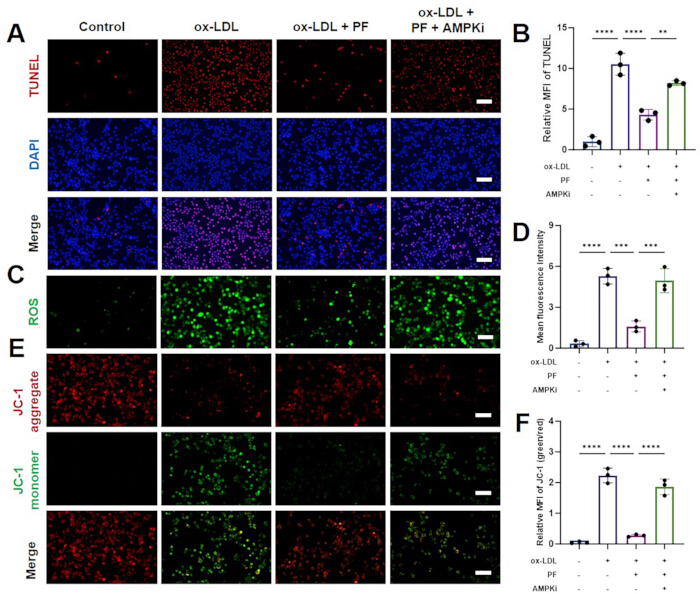
Figure 6. AMPK inhibition attenuates the effects of paeoniflorin on oxidized low-density lipoprotein-induced apoptosis, oxidative stress, and mitochondrial membrane potential loss. (A) TUNEL assay for apoptosis in RAW264.7 cells (scale bar = 100 µm) and (B) Corresponding quantitative analysis (n = 3). (C) ROS staining of RAW264.7 cells (scale bar = 100 μm) and (D) Quantitative results (n = 3). (E) JC-1 staining of RAW264.7 cells (scale bar = 100 μm) and (F) Corresponding quantitative analysis (n = 3). Data are presented as the mean ± SD of three independent experiments. Statistical significance is indicated as *P < 0.05, **P < 0.01, ***P < 0.001, and ****P < 0.0001. Horizontal bars identify the tested pairwise comparisons. In panels B, D, and F, the indicated comparisons were Control versus ox-LDL, ox-LDL versus ox-LDL + PF, and ox-LDL + PF versus ox-LDL + PF + AMPKi. Please click here to view a larger version of this figure.
AMPK inhibition attenuates PF-associated changes in ABCA1 and apoptosis-related proteins
Western blot analysis showed that total AMPK protein abundance remained relatively stable across the treatment groups, whereas ox-LDL significantly increased the p-AMPK/AMPK ratio and decreased ABCA1 expression compared with the control group. PF treatment further increased the p-AMPK/AMPK ratio and restored ABCA1 expression relative to the ox-LDL group. Co-treatment with the AMPK inhibitor dorsomorphin significantly attenuated these PF-associated changes, resulting in a lower p-AMPK/AMPK ratio and reduced ABCA1 expression than those observed in the ox-LDL + PF group (Figure 7A,B). Analysis of apoptosis-related proteins showed that ox-LDL significantly increased total caspase-3 expression and decreased the BCL-2/BAX ratio compared with the control group. PF treatment significantly reduced total caspase-3 expression and increased the BCL-2/BAX ratio relative to the ox-LDL group. Dorsomorphin co-treatment reversed these PF-associated changes, resulting in increased total caspase-3 expression and a reduced BCL-2/BAX ratio compared with the ox-LDL + PF group (Figure 7C,D). These findings indicate that AMPK inhibition attenuates the effects of PF on ABCA1 expression and apoptosis-related protein profiles in ox-LDL-treated RAW264.7 cells.
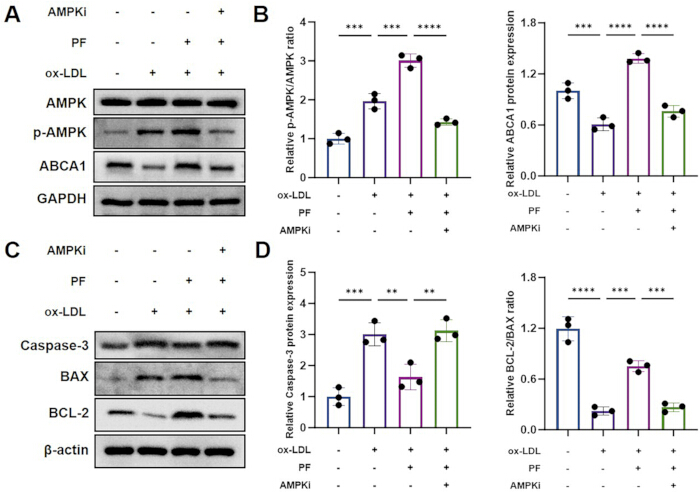
Figure 7. AMPK inhibition attenuates paeoniflorin-associated changes in AMPK phosphorylation, ABCA1 expression, and apoptosis-related proteins. (A) Representative western blots of AMPK, p-AMPK, and ATP-binding cassette transporter A1 (ABCA1). GAPDH was used as the loading control. (B) Quantification of the p-AMPK/AMPK ratio and relative ABCA1 protein expression (n = 3). (C) Representative western blots of total caspase-3, BAX, and BCL-2. β-Actin was used as the loading control. (D) Quantification of relative total caspase-3 expression and the BCL-2/BAX ratio (n = 3). AMPKi denotes the AMPK inhibitor dorsomorphin. Data are presented as the mean ± SD of three independent experiments. Statistical significance is indicated as *P < 0.05, **P < 0.01, ***P < 0.001, and ****P < 0.0001. Horizontal bars identify the tested pairwise comparisons. For both quantitative outcomes in panels B and D, the indicated comparisons were Control versus ox-LDL, ox-LDL versus ox-LDL + PF, and ox-LDL + PF versus ox-LDL + PF + AMPKi. Please click here to view a larger version of this figure.
AMPK silencing attenuates PF-associated increases in nuclear LXRα abundance and inhibition of NF-κB signaling in ox-LDL-treated RAW264.7 cells
To further determine the involvement of AMPK in the effects of PF, AMPK expression was silenced using siRNA. Both AMPK mRNA and protein levels were significantly reduced in si-AMPK-transfected cells compared with the si-NC group, confirming effective knockdown (Figure 8A,B). PF increased nuclear LXRα expression and reduced the nuclear p-p65/p65 ratio in ox-LDL-treated cells, whereas AMPK knockdown significantly attenuated these effects (Figure 8C,D). Consistently, ox-LDL markedly increased the whole-cell p-p65/p65 ratio, which was suppressed by PF but partially restored following AMPK knockdown (Figure 8E). PF also reversed the ox-LDL-induced decrease in IκB-α expression and increase in p-IκB-α expression, whereas these effects were attenuated by si-AMPK (Figure 8F). Collectively, these results suggest that AMPK contributes to the PF-mediated increase in nuclear LXRα abundance and inhibition of NF-κB signaling.
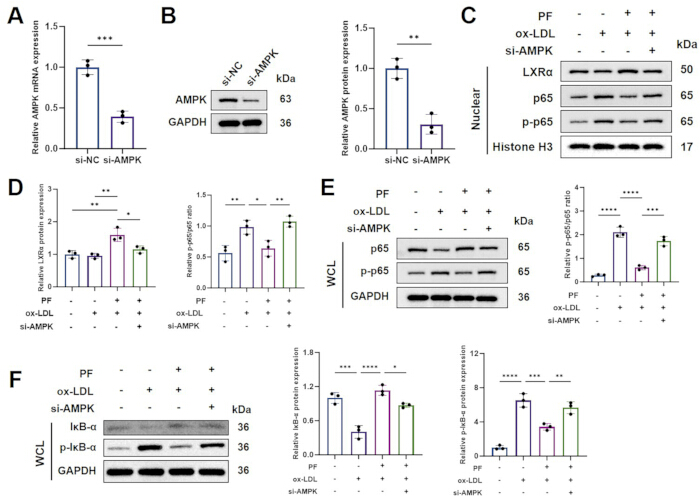
Figure 8. AMPK silencing attenuates paeoniflorin-mediated increases in nuclear LXRα abundance and inhibition of NF-κB signaling. (A) Relative AMPK mRNA expression following transfection with negative-control siRNA or AMPK-targeting siRNA (n = 3). (B) Representative western blot and quantification of AMPK protein expression following siRNA transfection (n = 3). GAPDH was used as the loading control. (C) Representative western blots of nuclear LXRα, p65, and p-p65. Histone H3 was used as the nuclear loading control. (D) Quantification of relative nuclear LXRα expression and the nuclear p-p65/p65 ratio (n = 3). (E) Representative western blots of whole-cell p65 and p-p65 and quantification of the p-p65/p65 ratio (n = 3). GAPDH was used as the loading control. (F) Representative western blots of whole-cell IκB-α and p-IκB-α and corresponding quantitative analyses (n = 3). GAPDH was used as the loading control. Data are presented as the mean ± SD of three independent experiments. Statistical significance is indicated as *P < 0.05, **P < 0.01, *** P < 0.001, and **** P < 0.0001. Horizontal bars identify the tested pairwise comparisons. In panels A and B, si-NC was compared with si-AMPK. For nuclear LXRα expression in panel D, the indicated comparisons were Control versus ox-LDL + PF, ox-LDL versus ox-LDL + PF, and ox-LDL + PF versus ox-LDL + PF + si-AMPK. For the nuclear p-p65/p65 ratio in panel D and the quantitative analyses in panels E and F, the indicated comparisons were Control versus ox-LDL, ox-LDL versus ox-LDL + PF, and ox-LDL + PF versus ox-LDL + PF + si-AMPK. Please click here to view a larger version of this figure.
AMPK silencing attenuates PF-mediated cholesterol efflux and macrophage phenotype modulation
To determine whether pharmacological inhibition of NF-κB produced functional changes similar to those associated with PF, ABCA1 expression, cholesterol efflux, lipid accumulation, and macrophage phenotypic markers were evaluated. PF restored ABCA1 expression and enhanced ApoA-I-mediated and HDL-mediated cholesterol efflux in ox-LDL-treated cells, whereas AMPK silencing significantly attenuated these effects (Figure 9A–C). Consistently, PF reduced intracellular lipid accumulation, whereas si-AMPK partially reversed this effect (Figure 9D,E). Treatment with BAY 11-7082 produced changes similar to those induced by PF, including increased ABCA1 expression and cholesterol efflux and decreased intracellular lipid accumulation (Figure 9A–E). Flow-cytometric analysis was performed using the gating strategy shown in Figure 9F. Ox-LDL markedly increased the proportion of CD86-positive macrophages, whereas PF reduced this population; this effect was attenuated by AMPK silencing (Figure 9G,H). In contrast, PF increased the proportion of CD206-positive macrophages, which was partially reversed by si-AMPK (Figure 9I,J). BAY 11-7082 similarly decreased the proportion of CD86-positive macrophages and increased the proportion of CD206-positive macrophages (Figure 9G–J). These findings indicate that AMPK contributes to the effects of PF on cholesterol homeostasis and macrophage phenotypic modulation, potentially through regulation of NF-κB signaling.
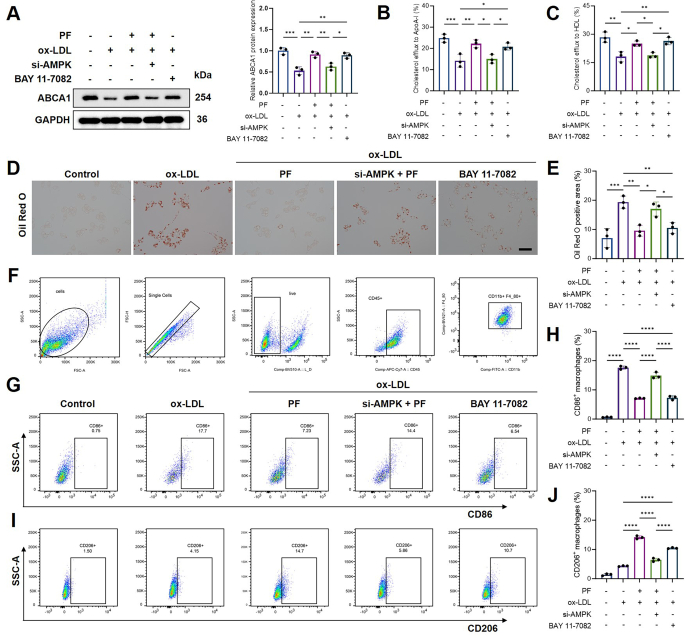
Figure 9. AMPK silencing and NF-κB inhibition modulate paeoniflorin-associated cholesterol efflux, lipid accumulation, and macrophage phenotype. (A) Representative western blot and quantification of ABCA1 expression (n = 3). GAPDH was used as the loading control. (B) Apolipoprotein A-I-mediated cholesterol efflux (n = 3). (C) High-density lipoprotein-mediated cholesterol efflux (n = 3). (D) Representative Oil Red O staining images. Scale bar = 100 µm. (E) Quantification of the Oil Red O-positive area (n = 3). (F) Sequential flow-cytometry gating strategy used to identify cells, singlets, viable CD45-positive cells, and CD11b-positive/F4/80-positive macrophages. (G) Representative flow-cytometry plots of CD86-positive macrophages. (H) Quantification of CD86-positive macrophages (n = 3). (I) Representative flow-cytometry plots of CD206-positive macrophages. (J) Quantification of CD206-positive macrophages (n = 3). BAY 11-7082 was used as an NF-κB inhibitor. Data are presented as the mean ± SD of three independent experiments. Statistical significance is indicated as *P < 0.05, **P < 0.01, ***P < 0.001, and ****P < 0.0001. Horizontal bars identify the tested pairwise comparisons. In panels A–C, E, and H, the indicated comparisons were Control versus ox-LDL, ox-LDL versus ox-LDL + PF, ox-LDL + PF versus ox-LDL + PF + si-AMPK, ox-LDL + PF + si-AMPK versus ox-LDL + BAY 11-7082, and ox-LDL versus ox-LDL + BAY 11-7082. In panel J, the indicated comparisons were ox-LDL versus ox-LDL + PF, ox-LDL + PF versus ox-LDL + PF + si-AMPK, ox-LDL + PF + si-AMPK versus ox-LDL + BAY 11-7082, and ox-LDL versus ox-LDL + BAY 11-7082. Please click here to view a larger version of this figure.
Data Availability:
The publicly available microarray dataset analyzed in this study is available through the National Center for Biotechnology Information Gene Expression Omnibus (GEO) under accession number GSE100927. All raw and processed data generated in this study are provided with this article as supplementary files and will be publicly available without restriction upon publication. Supplementary Data 1 contains the source numerical data underlying Figures 4–9 and the corresponding statistical analyses. Supplementary Data 2 contains the original uncropped western blot and CETSA images. Supplementary Data 3 contains the original full-resolution microscopy images used for quantitative analysis. Supplementary Data 4 contains the raw flow cytometry FCS files, control files, compensation information, gating records, and FlowJo workspace. Supplementary Data 5 contains the complete R scripts used for the network pharmacology and transcriptomic analyses, including data preprocessing, differential expression analysis, visualization, target integration, and enrichment analysis.
Supplementary Data 1. Source numerical data and statistical analyses. Excel workbook containing the source numerical data and corresponding statistical analyses underlying Figures 4–9, organized by figure into separate worksheets. The workbook includes the quantitative data used for graph generation and statistical comparisons.Please click here to download this file.
Supplementary Data 2. Original uncropped western blot and CETSA images. PDF containing the original uncropped images for all western blot and CETSA experiments presented in the manuscript, organized by figure and panel to document the source data used for image preparation and quantification.Please click here to download this file.
Supplementary Data 3. Original full-resolution microscopy images. PDF containing the original full-resolution microscopy images used for qualitative presentation and quantitative analyses, including representative images corresponding to the figures shown in the manuscript.Please click here to download this file.
Supplementary Data 4. Raw flow cytometry data. Raw FCS files, control files, compensation information, gating records, and the FlowJo workspace used for the flow cytometry analyses. The complete dataset is available via Microsoft OneDrive: https://1drv.ms/f/c/8d1d81159583ae0f/IgA367Hi90R5CfjDR5uwoGARiUYsefUFv0_OKSUWT5jGY?e=caEpxo. A PDF summary of the flow cytometry analyses is also provided as a backup.Please click here to download this file.
Supplementary Data 5. R scripts for network pharmacology and transcriptomic analyses. Two R script files containing the complete computational workflow used for the network pharmacology and transcriptomic analyses. The scripts include package loading and installation, data preprocessing, differential expression analysis, target integration, functional enrichment analyses, data visualization, and generation of the reported analytical results.Please click here to download this file.
Discussion
Macrophage foam-cell formation is driven not only by excessive uptake of modified lipoproteins but also by impaired cholesterol export and persistent inflammatory activation. The present study links these processes by identifying AMPK-related signaling as a potential mechanism through which PF was associated with concurrent changes in lipid handling, inflammatory responses, and cellular stress, several of which were attenuated by AMPK inhibition or silencing. The broadly consistent effects of PF and HQT further indicate that PF is a biologically relevant constituent of the formula. Nevertheless, because HQT contains multiple active compounds that may act additively or synergistically, these findings support PF as a representative constituent rather than establishing it as the principal active substance of HQT.
AMPK functions as a metabolic checkpoint that can restrain macrophage inflammatory activation. Previous studies have shown that AMPK activation limits IκB degradation, reduces inflammatory mediator production, and favors a less inflammatory macrophage phenotype. AMPK activation has also been reported to suppress ox-LDL uptake through regulation of the PP2A/NF-κB/LOX-1 pathway26,27. The present pharmacological and genetic findings extend these observations by showing that AMPK was required for several PF-associated effects on cholesterol export and inflammatory signaling. Thus, AMPK may not simply mediate an isolated response to PF but may integrate its metabolic and immunomodulatory actions in macrophages. The relationship between AMPK, LXRα, and ABCA1 provides a plausible explanation for the observed improvement in cholesterol efflux. LXRα is a central transcriptional regulator of ABCA1, and activation of the LXRα–ABCA1 pathway promotes the removal of excess cholesterol from macrophages28. Studies in human macrophages have further shown that AMPK can regulate LXRα and its downstream cholesterol transporters, whereas LXR-stimulated cholesterol efflux is strongly dependent on ABCA129,30. In the present study, AMPK silencing attenuated the effects of PF on nuclear LXRα abundance, ABCA1 expression, and ApoA-I-mediated and HDL-mediated cholesterol efflux. These observations are consistent with a model in which LXRα/ABCA1-related regulation occurs downstream of AMPK. However, because ABCA1 was not directly silenced, the data support—but do not fully establish—an AMPK–LXRα–ABCA1 causal sequence.
The findings also suggest reciprocal regulation between cholesterol homeostasis and inflammatory signaling. Inflammation can suppress ABCA1 expression and cholesterol efflux, thereby facilitating lipid retention in macrophages. Conversely, inhibition of NF-κB has been shown to restore ABCA1 expression and cholesterol export in inflammatory macrophages31. The similar effects produced by PF and BAY 11-7082 in the present study support such crosstalk: suppression of NF-κB signaling was accompanied by increased ABCA1 expression, enhanced cholesterol efflux, and reduced lipid accumulation. AMPK silencing weakened both the metabolic and inflammatory effects of PF, suggesting that AMPK may coordinate these two interconnected processes rather than regulating them independently. Previous work has demonstrated that PF can suppress pro-inflammatory macrophage activation by inhibiting NF-κB signaling. PF-containing treatments have also been reported to enhance ABCA1/ABCG1-associated cholesterol export and reduce foam-cell formation32,33. The current study provides additional mechanistic context by linking these previously described lipid-regulatory and anti-inflammatory properties to AMPK. Moreover, comparison with the complete HQT preparation distinguishes the present work from studies examining PF in isolation and suggests that PF and HQT produced partially overlapping effects in the selected macrophage assays.
AMPK-associated mechanisms may contribute to the effects of PF on oxidative stress and mitochondrial integrity. Ox-LDL-induced lipid loading places substantial energetic and oxidative stress on macrophages, which can promote mitochondrial depolarization and apoptosis. The simultaneous restoration of ATP levels, mitochondrial membrane potential, and antioxidant capacity observed following PF treatment is therefore consistent with coordinated metabolic protection rather than several unrelated effects. A previous macrophage study similarly found that PF reduced ROS accumulation, preserved mitochondrial membrane potential, and altered the inflammatory phenotype through regulation of mitochondrial quality control34. These findings suggest that preservation of mitochondrial function may contribute to the anti-inflammatory and anti-apoptotic actions of PF, although the specific downstream effectors of AMPK remain to be identified. The CETSA findings provide an additional line of evidence connecting PF with AMPK. CETSA was developed to evaluate intracellular drug-target engagement by detecting ligand-associated changes in protein thermal stability35. The lysate-based CETSA results are compatible with PF-associated stabilization of AMPK or an AMPK-containing protein complex in cell lysates. However, thermal stabilization alone cannot distinguish direct ligand binding from indirect stabilization resulting from altered phosphorylation, protein interactions, or the cellular context. Direct PF–AMPK binding would require confirmation using purified-protein or other biophysical approaches.
PF also decreased the proportion of CD86-positive cells and increased the proportion of CD206-positive cells, and these changes were attenuated by AMPK silencing. These findings are consistent with previous evidence that PF can alter the macrophage inflammatory phenotype32,34. Nevertheless, macrophage activation exists along a multidimensional spectrum rather than as two fixed M1 and M2 states36. CD86 and CD206 should therefore be interpreted as phenotypic markers associated with inflammatory and reparative programs, respectively, rather than as definitive evidence of complete M1-to-M2 conversion. Additional transcriptional, secretory, and functional markers would be necessary to characterize the macrophage phenotype more comprehensively. Several limitations should be acknowledged. First, the experiments were confined to RAW264.7 cells, and the findings require validation in primary or human macrophages and in vivo AS models. Second, although the selected PF concentration was non-cytotoxic and increased AMPK phosphorylation, a complete concentration-response relationship for the principal functional outcomes was not established. Third, ABCA1-specific loss-of-function and rescue experiments were not performed, and the proposed AMPK–LXRα–ABCA1 pathway should therefore be regarded as a supported mechanistic model rather than a fully established linear cascade. Fourth, PF and HQT were compared using different concentration units, and the PF content and phytochemical consistency of the HQT preparation were not quantitatively evaluated. Finally, the CETSA results indicate potential intracellular target engagement but do not independently demonstrate direct molecular binding.
In conclusion, the present findings suggest that PF alleviates ox-LDL-induced macrophage dysfunction by coordinating cholesterol export, inflammatory signaling, energy metabolism, and mitochondrial homeostasis. Pharmacological inhibition and siRNA-mediated AMPK silencing attenuated several PF-mediated protective effects and were accompanied by changes in nuclear LXRα abundance, ABCA1 expression, cholesterol efflux, and NF-κB signaling. PF exhibited macrophage-protective effects that overlapped with several of those observed following HQT treatment under the tested conditions. The contribution of PF to the overall activity of HQT remains unresolved.
Disclosures
Conflict of Interest:
The authors declare that they have no competing interests.
Acknowledgements
None.
Author Contributions:
Yunjie Zeng: Conceptualization, Methodology, Investigation, Formal analysis, Data curation, Visualization, and Writing – original draft.
Huaying Wang: Methodology, Investigation, Formal analysis, Validation, Data curation, Visualization, and Writing – original draft.
Dong Liu: Methodology, Investigation, and Validation.
Yunlu Jiang: Investigation, Data curation, and Formal analysis.
Pengcheng Ren: Investigation, Formal analysis, and Visualization.
Wenxin Song: Resources, Validation, and Writing – review & editing.
Guopeng Huang: Conceptualization, Methodology, Supervision, Project administration, Funding acquisition, and Writing – review & editing.
Xiaojiao He: Conceptualization, Resources, Supervision, Project administration, Funding acquisition, and Writing – review & editing.
Yunjie Zeng and Huaying Wang contributed equally to this work and share first authorship. Guopeng Huang and Xiaojiao He are co-corresponding authors. All authors reviewed and approved the final manuscript.
Materials
| Name | Company | Catalog Number | Comments |
|---|---|---|---|
| Chemiluminescence imaging system | Thermo Fisher Scientific | iBright Imaging System | |
| Flow cytometer | BD Biosciences | FACSCanto II | |
| Inverted fluorescence microscope | Olympus | IX73 | |
| Microplate reader | PerkinElmer | VICTOR X3 | |
| Real-time PCR system | Bio-Rad | CFX Opus 96 | |
| Spectrophotometer | Thermo Fisher Scientific | NanoDrop 8000 |
References
- Zysman M et al. Risk of cardiovascular events according to the severity of an exacerbation of chronic obstructive pulmonary disease. Eur J Prev Cardiol. 2025;32(15):1436-1444. doi:10.1093/eurjpc/zwaf086.
- Zvintzou E et al. Context-dependent effects of apolipoprotein A2 on lipid metabolism and atherogenesis. FASEB J. 2026;40(12):e72032. doi:10.1096/fj.202600765R.
- Zuriaga MA et al. Colchicine prevents accelerated atherosclerosis in TET2-mutant clonal haematopoiesis. Eur Heart J. 2024;45(43):4601-4615. doi:10.1093/eurheartj/ehae546.
- Zhang Y et al. Effects and mechanisms of Zhizi Chuanxiong herb pair against atherosclerosis: an integration of network pharmacology, molecular docking, and experimental validation. Chin Med. 2024;19(1):8. doi:10.1186/s13020-023-00874-x.
- Zysset D et al. TREM-1 links dyslipidemia to inflammation and lipid deposition in atherosclerosis. Nat Commun. 2016;7:13151. doi:10.1038/ncomms13151.
- Zou Z et al. Recent advances in nanozymes for the treatment of atherosclerosis. Int J Nanomedicine. 2025;20:9447-9472. doi:10.2147/IJN.S540010.
- Zoubdane N et al. High tyrosol and hydroxytyrosol intake reduces arterial inflammation and atherosclerotic lesion microcalcification in healthy older populations. Antioxidants (Basel). 2024;13(1):130. doi:10.3390/antiox13010130.
- Zhong T et al. Adaptation of endothelial cells to shear stress under atheroprone conditions by modulating internalization of vascular endothelial cadherin and vinculin. Ann Transl Med. 2020;8(21):1423. doi:10.21037/atm-20-3426.
- Zhuo S et al. Inflammatory corpuscle AIM2 facilitates macrophage foam cell formation by inhibiting cholesterol efflux protein ABCA1. Sci Rep. 2024;14(1):10782. doi:10.1038/s41598-024-61495-4.
- Zheng H et al. Lp-PLA2 silencing protects against ox-LDL-induced oxidative stress and cell apoptosis via Akt/mTOR signaling pathway in human THP-1 macrophages. Biochem Biophys Res Commun. 2016;477(4):1017-1023. doi:10.1016/j.bbrc.2016.07.022.
- Zhou Y et al. Asperlin inhibits LPS-evoked foam cell formation and prevents atherosclerosis in ApoE(-/-) mice. Mar Drugs. 2017;15(11):358. doi:10.3390/md15110358.
- Zhong Y, Liu C, Feng J, Li JF, Fan ZC. Curcumin affects ox-LDL-induced IL-6, TNF-α, MCP-1 secretion and cholesterol efflux in THP-1 cells by suppressing the TLR4/NF-κB/miR33a signaling pathway. Exp Ther Med. 2020;20(3):1856-1870. doi:10.3892/etm.2020.8915.
- Zhu C et al. TRIM64 promotes ox-LDL-induced foam cell formation, pyroptosis, and inflammation in THP-1-derived macrophages by activating a feedback loop with NF-κB via IκBα ubiquitination. Cell Biol Toxicol. 2023;39(3):607-620. doi:10.1007/s10565-022-09768-4.
- Zhang G et al. OxLDL/β2GPI/anti-β2GPI Ab complex induces inflammatory activation via the TLR4/NF-κB pathway in HUVECs. Mol Med Rep. 2021;23(2):148. doi:10.3892/mmr.2020.11787.
- Zu YX et al. Jiang Gui Fang activated interscapular brown adipose tissue and induced epididymal white adipose tissue browning through the PPARγ/SIRT1-PGC1α pathway. J Ethnopharmacol. 2020;248:112271. doi:10.1016/j.jep.2019.112271.
- Zu X et al. Antidepressant-like effect of Bacopaside I in mice exposed to chronic unpredictable mild stress by modulating the hypothalamic-pituitary-adrenal axis function and activating BDNF signaling pathway. Neurochem Res. 2017;42(11):3233-3244. doi:10.1007/s11064-017-2360-3.
- Zong K et al. Explorating the mechanism of Huangqin Tang against skin lipid accumulation through network pharmacology and experimental validation. J Ethnopharmacol. 2023;313:116581. doi:10.1016/j.jep.2023.116581.
- Zou Y et al. Huangqin Tang ameliorates dextran sodium sulphate-induced colitis by regulating intestinal epithelial cell homeostasis, inflammation and immune response. Sci Rep. 2016;6:39299. doi:10.1038/srep39299.
- Zou Y et al. Huangqin Tang ameliorates TNBS-induced colitis by regulating effector and regulatory CD4(+) T cells. Biomed Res Int. 2015;2015:102021. doi:10.1155/2015/102021.
- Wang D et al. Huangqin tang alleviates colitis-associated colorectal cancer via amino acid homeostasis and PI3K/AKT/mTOR pathway modulation. J Ethnopharmacol. 2024;334:118597. doi:10.1016/j.jep.2024.118597.
- Zhu X, Zhou Y, Cai W, Sun H, Qiu L. Salusin-β mediates high glucose-induced endothelial injury via disruption of AMPK signaling pathway. Biochem Biophys Res Commun. 2017;491(2):515-521. doi:10.1016/j.bbrc.2017.06.126.
- Zhu J, Chen H, Guo J, Zha C, Lu D. Sodium tanshinone IIA sulfonate inhibits vascular endothelial cell pyroptosis via the AMPK signaling pathway in atherosclerosis. J Inflamm Res. 2022;15:6293-6306. doi:10.2147/JIR.S386470.
- Kim J et al. Inhibition of Toll-like receptors alters macrophage cholesterol efflux and foam cell formation. Int J Mol Sci. 2024;25(12):6808. doi:10.3390/ijms25126808.
- Zuo J, Guo S, Qin X. Bisdemethoxycurcumin suppresses the progression of atherosclerosis and VSMC-derived foam cell formation by promoting lipophagy. Naunyn Schmiedebergs Arch Pharmacol. 2023;396(12):3659-3670. doi:10.1007/s00210-023-02558-7.
- Zong P et al. TRPM2 deficiency in mice protects against atherosclerosis by inhibiting TRPM2-CD36 inflammatory axis in macrophages. Nat Cardiovasc Res. 2022;1(4):344-360. doi:10.1038/s44161-022-00027-7.
- Sag D, Carling D, Stout RD, Suttles J. Adenosine 5'-monophosphate-activated protein kinase promotes macrophage polarization to an anti-inflammatory functional phenotype. J Immunol. 2008;181(12):8633-8641. doi:10.4049/jimmunol.181.12.8633.
- Chen B, Li J, Zhu H. AMP-activated protein kinase attenuates oxLDL uptake in macrophages through PP2A/NF-κB/LOX-1 pathway. Vascul Pharmacol. 2016;85:1-10. doi:10.1016/j.vph.2015.08.012.
- Chawla A et al. A PPARγ-LXR-ABCA1 pathway in macrophages is involved in cholesterol efflux and atherogenesis. Mol Cell. 2001;7(1):161-171. doi:10.1016/S1097-2765(01)00164-2.
- Saenz J et al. Grapefruit flavonoid naringenin regulates the expression of LXRα in THP-1 macrophages by modulating AMP-activated protein kinase. Mol Pharm. 2018;15(5):1735-1745. doi:10.1021/acs.molpharmaceut.7b00797.
- Larrede S et al. Stimulation of cholesterol efflux by LXR agonists in cholesterol-loaded human macrophages is ABCA1-dependent but ABCG1-independent. Arterioscler Thromb Vasc Biol. 2009;29(11):1930-1936. doi:10.1161/ATVBAHA.109.194548.
- Zhao GJ et al. Antagonism of betulinic acid on LPS-mediated inhibition of ABCA1 and cholesterol efflux through inhibiting nuclear factor-kappaB signaling pathway and miR-33 expression. PLoS One. 2013;8(9):e74782. doi:10.1371/journal.pone.0074782.
- Zhai T et al. Unique immunomodulatory effect of paeoniflorin on type I and II macrophages activities. J Pharmacol Sci. 2016;130(3):143-150. doi:10.1016/j.jphs.2015.12.007.
- Mei J et al. Tetramethylpyrazine and Paeoniflorin Synergistically Attenuate Cholesterol Efflux in Macrophage Cells via Enhancing ABCA1 and ABCG1 Expression. Evid Based Complement Alternat Med. 2022;2022:4304790. doi:10.1155/2022/4304790.
- Cao Y et al. Paeoniflorin suppresses kidney inflammation by regulating macrophage polarization via KLF4-mediated mitophagy. Phytomedicine. 2023;116:154901. doi:10.1016/j.phymed.2023.154901.
- Martinez Molina D et al. Monitoring drug target engagement in cells and tissues using the cellular thermal shift assay. Science. 2013;341(6141):84-87. doi:10.1126/science.1233606.
- Xue J et al. Transcriptome-based network analysis reveals a spectrum model of human macrophage activation. Immunity. 2014;40(2):274-288. doi:10.1016/j.immuni.2014.01.006.