A modified approach for extracting the first mandibular molar in mice is described and compared with the conventional approach to evaluate procedural efficiency and reproducibility. The modified approach improves procedural consistency and reduces technical challenges in establishing a murine mandibular tooth socket healing model.
Method Article
A Modified Tooth Extraction Approach for Improving Procedural Efficiency and Consistency in a Murine Mandibular Tooth Socket Healing Model
In This Article
Summary
Abstract
The tooth socket healing model (TSHM) is a widely used animal model for investigating the molecular mechanisms underlying bone regeneration. Although the murine mandibular TSHM is valuable for studying mandibular-specific pathological processes, establishing this model remains technically challenging because of the anatomical and biomechanical characteristics of the mandibular molar region. This protocol describes a modified approach for mandibular first molar extraction in mice and compares its performance with the conventional technique to improve procedural efficiency and reproducibility. Under controlled experimental conditions, the modified approach significantly reduced the average extraction time from 29 to 10 min. In addition, the modified group exhibited fewer extraction-related complications, including root and alveolar bone fractures, indicating improved procedural consistency. Micro-computed tomography (μCT) analysis further demonstrated improved preservation of extraction socket architecture during early healing. These findings indicate that the modified extraction approach improves procedural efficiency and reproducibility while reducing the technical challenges associated with murine mandibular tooth extraction. This protocol may facilitate more consistent establishment of murine mandibular tooth socket healing models, particularly for researchers with limited microsurgical experience.
Introduction
The tooth socket healing model (TSHM) is a classic model for studying bone regeneration1. This model creates a challenging yet subcritical injury within the alveolar bone, enabling favorable natural healing without additional intervention1. Mice are widely used as model organisms because of their genetic background, similarities in bone metabolism to humans, relatively low breeding costs, and ease of maintenance2. Over the past few decades, rapid advances in gene-editing technology have made mice indispensable for investigating the molecular mechanisms underlying bone regeneration3. Consequently, extraction of molars in transgenic mice has been widely used to establish TSHM for investigating the regulatory mechanisms of bone regeneration4,5,6.
Most previous studies have established murine TSHM using the maxilla4,5,6, because the mandible is mechanically stiffer and less compliant than the maxilla7, increasing the technical difficulty of tooth extraction. In addition, the surgical field for maxillary molar extraction is relatively more accessible, and the maxilla is easier to stabilize than the mandible, making the procedure technically less demanding. Despite these challenges, the curved and enlarged apical root morphology of the mouse mandibular first molar increases mechanical retention within the surrounding alveolar bone8,9, further complicating extraction (Figure 1). Nevertheless, mandibular extraction models remain indispensable for investigating mandibular-specific pathological processes, including osteomyelitis, medication-related osteonecrosis of the jaw, implant osseointegration, and bone regeneration using biomaterials10,11,12. Therefore, a reproducible and reliable method for extracting mandibular molars in mice is important for studies requiring mandibular-specific tooth socket healing models.
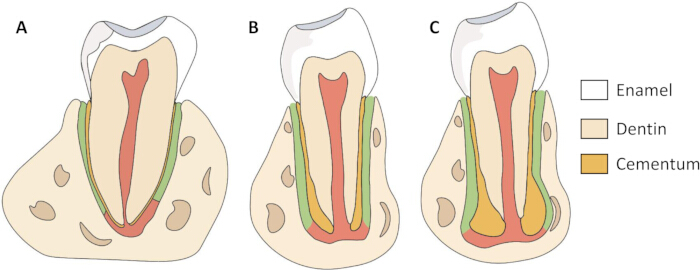
Figure 1. Schematic comparison of tooth morphology in humans and mice.
(A) Schematic illustration of an adult human tooth. (B) Schematic illustration of an adolescent mouse mandibular first molar. (C) Schematic illustration of an adult mouse mandibular first molar. The diagrams highlight differences in root morphology and cementum distribution that contribute to the increased mechanical retention of adult mouse mandibular first molars within the alveolar bone. Enamel, dentin, and cementum are indicated by the corresponding colors shown in the key. Anatomical features are based on published descriptions8,9,15. Please click here to view a larger version of this figure.
A previously developed tooth extraction technique from our research group utilizes syringes modified into dental elevators13. Although this method enables successful extraction of the right mandibular first molar in mice, it requires a high level of technical precision and has a steep learning curve that demands extensive practice. Inexperienced operators may inadvertently cause injuries to adjacent anatomical structures. In addition, extraction of the left mandibular first molar requires additional “mirror-image” training to achieve procedural proficiency. These challenges may compromise extraction socket integrity, reduce the consistency of healing outcomes among animals, and limit the accessibility of the model for researchers with limited microsurgical experience.
This protocol describes a modified approach for extracting the mandibular first molar in mice to improve procedural accessibility and reproducibility. The protocol was validated in 8-week-old male C57BL/6 mice for establishing a mandibular first molar TSHM. The modified approach was systematically compared with the conventional technique to evaluate procedural efficiency, extraction success, and procedure-related complications. In addition, common technical failure modes encountered during method acquisition were analyzed to provide practical guidance for researchers establishing murine mandibular TSHM.
Protocol
All procedures were approved by the Ethical Committee of the West China School of Stomatology, Sichuan University (WCHSIRB-D-2025-188), and were performed in accordance with institutional animal-care guidelines.
NOTE: Use 8-week-old male C57BL/6 mice weighing 22–29 g. Maintain the animals on a standard chow diet with water provided ad libitum under standard housing conditions (21°C–24°C, 40%–60% humidity, and a 12-h light-dark cycle). Use the materials and instruments listed in the Table of Materials. Use 24 mice for the comparative evaluation and presentation of failed cases. Use additional mice for operator training before the comparative experiment.
1. Presurgical preparation
- Instrument preparation
- Prepare 25 G syringe needles for use as elevators (optional). Bend the beveled tip of each needle to approximately 20°–40°13.
- Prepare toothed ophthalmic tweezers for use as dental forceps. Inspect the toothed tip under magnification to confirm that the teeth are properly aligned and free of deformation.
- Assemble a mouth retractor using one rubber band and four 25 G syringe needles. Prepare a foam board or cardboard as the operating platform, tape for securing the mouse limbs, and a headlamp to illuminate the surgical field.
- Prepare a heating pad for postoperative recovery and preheat it to approximately 38°C before surgery. Prepare cotton balls for hemostasis and an appropriate amount of saline solution for cleaning the oral cavity.
- Prepare a finger sleeve to cover the thumb and protect the operator during the extraction procedure.
- Place sterile non-woven fabric over the operating surface and heating pad to maintain a sterile field.
- Anesthesia preparation
- Disinfect the mouse abdomen using a cotton ball soaked in povidone–iodine antiseptic solution. Administer 1% pentobarbital sodium (50 mg/kg) intraperitoneally14. Assess the depth of anesthesia using the toe-pinch test and administer supplemental anesthesia as needed.
NOTE: If the toe-pinch reflex returns or the procedure approaches the expected anesthetic duration, discontinue the procedure and administer supplemental anesthesia according to the approved institutional veterinary protocol. - Apply veterinary ophthalmic ointment to both eyes immediately after anesthesia to prevent corneal drying.
- Disinfect the mouse abdomen using a cotton ball soaked in povidone–iodine antiseptic solution. Administer 1% pentobarbital sodium (50 mg/kg) intraperitoneally14. Assess the depth of anesthesia using the toe-pinch test and administer supplemental anesthesia as needed.
- Disinfection and sterilization preparation
- Disinfect the surgical platform, heating pad, tape, finger sleeve, and surrounding work area with 75% ethanol. Use new sterile cotton swabs, non-woven fabric, rubber bands, and needles for each mouse. Sterilize the toothed tweezers and saline solution using the standard institutional steam sterilization protocol before use.
CAUTION: 75% ethanol is flammable. Use it in a well-ventilated area away from heat, sparks, open flames, and other ignition sources. Wear appropriate personal protective equipment. Allow ethanol-treated instruments and surfaces to dry completely before beginning the procedure. - Perform hand hygiene before beginning the procedure. Wear clean surgical scrubs, a sterile surgical cap, a surgical mask, and sterile gloves.
- Disinfect the surgical platform, heating pad, tape, finger sleeve, and surrounding work area with 75% ethanol. Use new sterile cotton swabs, non-woven fabric, rubber bands, and needles for each mouse. Sterilize the toothed tweezers and saline solution using the standard institutional steam sterilization protocol before use.
2. Surgical process
- Fixation and cleaning of the mouse
- Place the mouse in a supine position on the fixation plate and secure the limbs with tape. Insert two 25 G needles into the foam board at the level of the orbital-ear plane and insert two additional 25 G needles below the mandible.
- Place the rubber band over the needles and across the incisors to hold the mouth open. Gently retract the tongue and position it on the side opposite the extraction site to prevent obstruction of the surgical field. Use the right mandibular first molar as the representative example throughout this protocol.
- Remove food debris and other foreign material from the oral cavity using a small cotton ball moistened with saline solution.
NOTE: Thoroughly squeeze the cotton ball to remove excess saline and prevent liquid from entering the oral cavity, which may cause suffocation.
- Eliminating distal and mesial resistance (optional)
- Use tweezers with the left hand to retract the right corner of the mouth and fully expose the right mandibular first molar and the surrounding buccal and lingual soft tissues.
- Hold the tweezers with the right hand. Then, hold a 25 G needle with the left hand and carefully insert the needle into the buccal periodontal ligament adjacent to the distal root to create a periodontal ligament space.
- Advance the needle slowly toward the periapical region while rotating it mesially and lingually toward the molar to loosen the root from the alveolar socket.
- Insert a 25 G needle into the root furcation from the buccal side and elevate it occlusally with the left hand. Insert a second 25 G needle into the lingual periodontal ligament adjacent to the mesial root with the right hand to create a periodontal ligament space, then rotate the needle distally and buccally.
- Withdraw both needles from the surgical field after completing periodontal ligament pre-loosening.
NOTE: Perform periodontal ligament pre-loosening only when the tooth exhibits minimal mobility and marked resistance after initial swinging with the forceps.
- Swinging and extraction
- Stabilize the mouse head using the index and middle fingers of the left hand. Place the thumb, covered with a finger sleeve, against the mandibular incisors for support while holding the tweezers with the right hand.
- Hold the tweezer tips perpendicular to the occlusal plane and parallel to the long axis of the tooth. Position the serrated tips within the root furcation to obtain stable traction.
NOTE: Do not grasp the tooth root directly with the tweezers because this may cause root fracture. - Grasp the crown with the tweezers and apply gentle buccolingual swinging movements. Limit the buccal swing angle to 30° and the lingual swing angle to 50°. Perform one swinging movement every 1–1.5 s.
- Maintain traction along the long axis of the molar from the apex toward the crown while applying steady counter-support against the mandibular incisors with the left thumb pad to stabilize the mandible.
NOTE: Maintain continuous, stable counter-support while avoiding excessive compression or displacement of the incisors and adjacent soft tissues. - Continue the swinging movements until the tooth gradually becomes mobile and the occlusal surface is visibly elevated above the adjacent molars. Maintain the tweezer tips parallel to the long axis of the tooth throughout the procedure, then extract the tooth once sufficient mobility has been achieved.
NOTE: Before applying the final extraction force, assess tooth mobility by gently swinging the crown in the buccolingual direction. Proceed with extraction only when the crown can be displaced with minimal resistance and the buccolingual movement amplitude reaches approximately half the crown width. Reassess the depth of anesthesia immediately before complete extraction. Administer supplemental anesthesia if necessary (Figure 2).
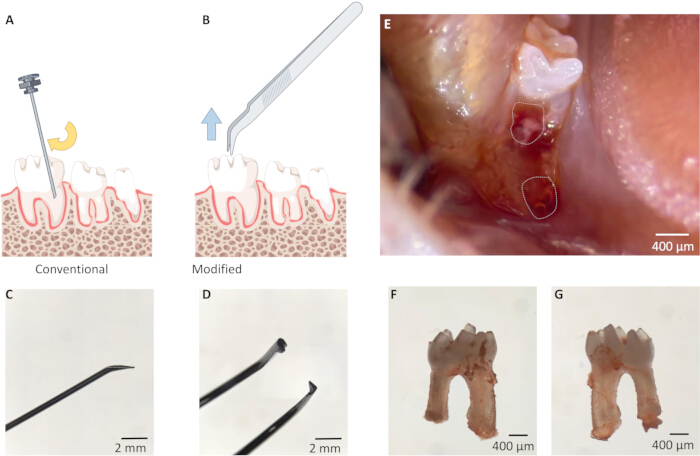
Figure 2. Comparison of the conventional and modified murine mandibular first molar extraction methods.
(A) Schematic illustration of the conventional extraction method, in which a bent 25 G needle is inserted into the periodontal ligament and used as a lever to luxate the tooth. (B) Schematic illustration of the modified extraction method, in which toothed ophthalmic tweezers engage the crown and apply traction parallel to the long axis of the tooth. (C) Representative image of the bent tip of the 25 G needle used as the elevator. (D) Representative image of the toothed ophthalmic tweezers used as micro-extraction forceps. (E) Representative intraoperative image showing the extraction socket immediately after mandibular first molar extraction; dashed outlines indicate the extraction sockets. (F) Buccal view of a successfully extracted mandibular first molar. (G) Lingual view of the same extracted mandibular first molar. Scale bars = 2 mm (C,D) and 400 µm (E–G). Please click here to view a larger version of this figure.
3. Examining the extracted teeth and extraction sockets
- Inspect the extracted tooth to confirm complete removal and structural integrity. Confirm that the root morphology is preserved, with a longer mesial root, a shorter distal root, and apical enlargement15. Verify that no alveolar bone fragments remain attached to the extracted tooth.
- Inspect the extraction socket to confirm that it is clean and free of residual root fragments (Figure 2).
NOTE: If a retained or fractured root is suspected during extraction, avoid repeated manipulation because excessive attempts may exacerbate socket defects. Inspect the extraction site under magnification to confirm the presence of residual root fragments. Record cases with retained or fractured roots as failed extractions and exclude them from subsequent model evaluation. Handle these animals according to the approved animal protocol.
4. Postoperative care
- Apply dry cotton to achieve hemostasis. Clean the oral cavity using a small cotton ball moistened with saline solution, and then reposition the tongue.
NOTE: Moisten the cotton ball with the minimum volume of sterile saline required to dampen its surface without producing free liquid. - Administer carprofen (5 mg/kg, subcutaneously) after surgery for postoperative analgesia.
- Place the animal on a heating pad and monitor continuously until it regains consciousness.
- After recovery from anesthesia, provide softened standard chow or a gel diet on the cage floor for 3 days, with water available ad libitum. Resume the standard chow diet after normal feeding behavior has been confirmed.
- Monitor food intake, body weight, activity, grooming behavior, facial swelling, oral bleeding, and signs of pain or distress at predefined intervals.
5. Training of operators
- Randomly assign two operators, neither of whom has previous experience with mouse hard tissue regeneration models, to either the conventional or modified extraction group. Train the operators separately under the supervision of the same instructor, who is proficient in both the conventional and modified extraction approaches.
- During the first week, instruct each operator to practice the assigned extraction procedure on mouse cadavers to become familiar with the surgical workflow.
- During the second week, supervise training on live mice to evaluate and refine the practical application of each technique. Monitor each procedure to ensure adequate anesthesia and to prevent unintended surgical complications, including accidental injury to the surrounding soft tissues caused by improper instrument manipulation or damage to the alveolar structures. Confirm operator competency when the operator can independently perform three consecutive successful extractions. After completing the supervised training, proceed to the comparative extraction experiments.
6. Specimen preparation
- Euthanize the mice by cervical dislocation. Dissect the mandibles from the head and remove the adhering soft tissue.
- Fix the mandibles in 4% paraformaldehyde solution for 48 h. Store the specimens in PBS before µCT scanning.
7. µCT and analyses
- Scan the mandibles using a µCT scanner. Set the scanning parameters to 80 kV, 500 µA, 10 µm voxel resolution, and layer-by-layer scanning.
- Calibrate the µCT system using a hydroxyapatite phantom. Scan the phantom and export the reconstructed images using DataViewer.
- Analyze the phantom images using CTAn. Establish a calibration curve by correlating the measured CT attenuation values of the phantom inserts with their known mineral densities to convert attenuation values into BMD.
- Apply identical scanning and reconstruction parameters to all samples.
- Reconstruct all datasets using the standardized reconstruction workflow in CTAn associated with the µCT system. Apply identical reconstruction settings, ROI definition, and quantitative analysis criteria to all samples. Perform three-dimensional reconstruction separately using Mimics Research for representative visualization, following the same ROI definition used for the CTAn quantitative analysis.
- Define the region of interest (ROI) by selecting the distal root region of the extracted mandibular first molar. Collect 100 consecutive transverse slices extending apically from the cementoenamel junction of the adjacent second molar.
- Manually outline the ROI in each slice along the boundary of the newly formed alveolar bone surrounding the extraction socket. Perform subsequent image processing and quantitative analysis using CTAn with identical analysis parameters for all samples.
- Perform three-dimensional reconstruction using Mimics Research. Calculate the incidence of root fracture and socket wall defects as the proportion of mandibular samples exhibiting each condition relative to the total number of mandibular samples.
- Perform all statistical analyses and generate graphs using GraphPad Prism v10.1.2. Assess the normality of continuous variables using the Shapiro–Wilk test.
- Define the individual mouse and its corresponding extraction socket as the experimental unit for all analyses.
- Compare extraction time, BMD, and BV/TV between groups using an unpaired two-tailed Student’s t test. Compare the incidence of root fracture and socket wall defects using Fisher’s exact test.
- Denote statistical significance as follows: *, p < 0.05; **, p < 0.01; and ***, p < 0.001. Use “ns” to indicate no statistically significant difference between the two groups.
Results
The anatomical features relevant to mandibular first molar extraction are illustrated in Figure 1, and the conventional and modified extraction approaches are shown schematically in Figure 2A,B. Representative images of the prepared needle and toothed ophthalmic tweezers, the fresh extraction sockets, and the extracted mandibular first molar are shown in Figure 2C–G. The complete procedural workflow is summarized in Figure 3. To compare the procedural efficiency and consistency of the two approaches, two operators with equivalent experience in mouse handling were randomly assigned to perform mandibular first molar extraction using either the conventional or modified method. All mice were 8-week-old male C57BL/6 mice. Extraction time and procedure-related complications were recorded immediately after extraction, whereas extraction sockets were evaluated by µCT after 2 weeks of healing. Extraction time was recorded during the procedure and therefore could not be assessed blindly; extracted teeth and µCT datasets were coded before evaluation so that the assessor was blinded to the extraction method.
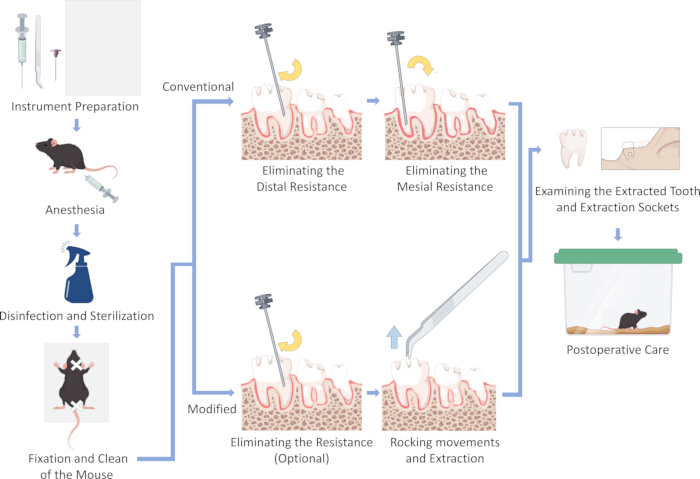
Figure 3. Workflow of the conventional and modified murine mandibular first molar extraction procedures.
The workflow begins with instrument preparation, anesthesia, disinfection and sterilization, and fixation of the mouse. The protocol then diverges into the conventional and modified extraction approaches. The conventional approach includes sequential elimination of distal and mesial resistance before tooth extraction, whereas the modified approach includes optional periodontal ligament pre-loosening followed by rocking movements and tooth extraction using toothed ophthalmic tweezers. Both approaches conclude with examination of the extracted tooth and extraction socket, followed by postoperative care. Please click here to view a larger version of this figure.
Representative µCT images obtained immediately after extraction and after 2 weeks of healing are shown in Figure 4A–D. The modified approach significantly reduced the mean extraction time compared with the conventional approach (10 min vs. 29 min, p = 0.0006; Figure 4E). Root fracture occurred in 2/6 mice (33.3%) in the modified group and 4/6 mice (66.7%) in the conventional group, with no statistically significant difference between the groups (p = 0.5455; Figure 4F). Socket wall defects were observed in 0/6 mice in the modified group and 4/6 mice (66.7%) in the conventional group; this difference was not statistically significant (p = 0.0606; Figure 4G). After 2 weeks of healing, µCT analysis showed significantly higher BMD and BV/TV values in the modified group than in the conventional group (p = 0.0188 and p = 0.0253, respectively; Figure 4H,I). These results demonstrate shorter extraction times with the modified approach and suggest improved extraction consistency under the experimental conditions tested.
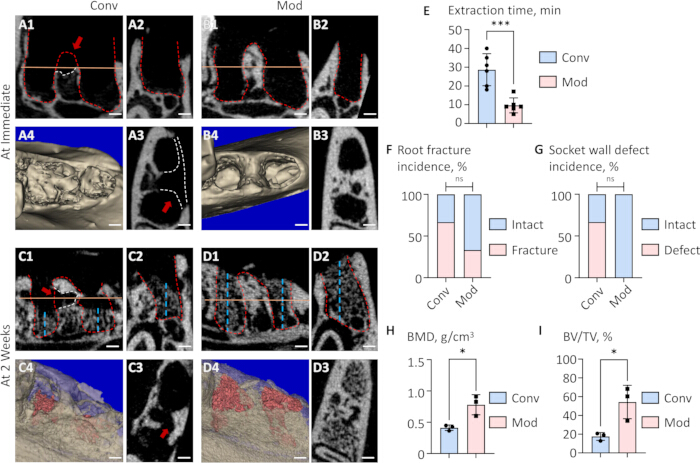
Figure 4. Comparison of the conventional and modified approaches for murine mandibular first molar extraction and subsequent tooth socket healing.
(A–D) Representative micro-computed tomography (µCT) images of extraction sockets immediately after extraction (A,B) and 2 weeks after extraction (C,D) using the conventional (A,C) or modified (B,D) approach. Panels 1–3 show sagittal, coronal, and transverse views, respectively, and panel 4 shows the corresponding three-dimensional reconstruction. Red dashed lines outline the original root contours. White dashed lines and red arrows indicate socket wall defects. Solid orange lines in A1, B1, C1, and D1 indicate the corresponding positions of the cross-sectional views. Blue dashed lines in C1, C2, D1, and D2 indicate the extent of newly formed bone within the extraction socket. Newly formed bone is highlighted in red in the three-dimensional reconstructions (C4,D4). (E–I) Quantitative comparison of extraction performance and early socket healing, including extraction time (E), root fracture incidence (F), socket wall defect incidence (G), bone mineral density (BMD; H), and bone volume fraction/tissue volume (BV/TV; I). For procedural outcomes (E–G), n = 6 mice per group; for µCT analysis of socket healing (H,I), n = 3 mice per group. The individual mouse and corresponding extraction socket were considered the experimental unit. Continuous outcomes in E, H, and I are presented as mean ± SD and were compared using an unpaired two-tailed Student’s t test. Categorical outcomes in F and G are presented as raw counts and percentages and were compared using Fisher’s exact test. Root fracture occurred in 4/6 mice (66.7%) in the conventional group and 2/6 mice (33.3%) in the modified group. Socket wall defects occurred in 4/6 mice (66.7%) in the conventional group and 0/6 mice in the modified group. Statistical significance: *, p < 0.05; ***, p < 0.001. Please click here to view a larger version of this figure.
Successful extraction was defined as complete removal of the mandibular first molar without residual root fragments while preserving the alveolar socket architecture for subsequent healing evaluation, as illustrated in Figure 4A–D. An extraction was considered unsuccessful when incomplete tooth removal or procedure-related damage compromised subsequent evaluation of socket healing. Representative unsuccessful outcomes are shown in Figure 5A–F. Crown fracture is shown in Figure 5A, distal root fracture in Figure 5B, and a mesial root defect in Figure 5C. Residual root fragments and root tip fracture are shown in Figure 5D,E, respectively. Structural damage near the inferior alveolar nerve canal region is shown in Figure 5F. These unsuccessful outcomes were associated with improper control of the needle insertion angle or depth, inappropriate extraction trajectories, excessive force application, or excessive manipulation. The inclusion of both successful and suboptimal outcomes demonstrates the range of results that may occur during implementation of the protocol and provides criteria for interpreting extraction success and failure.
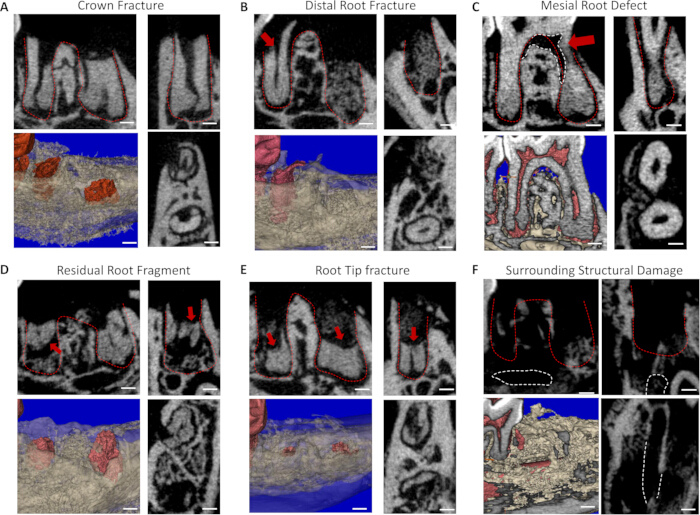
Figure 5. Representative examples of failed murine mandibular first molar extractions.
(A–F) Representative µCT images and three-dimensional reconstructions illustrating common extraction-related complications. (A) Crown fracture. (B) Distal root fracture. (C) Mesial root defect. (D) Residual root fragment. (E) Root tip fracture. (F) Damage to surrounding anatomical structures. Red dashed lines outline the original root contours. White dashed lines outline bony defects or adjacent anatomical structures. Red arrows indicate the sites of injury or retained root fragments. Fractured roots and adjacent teeth are highlighted in red in the three-dimensional reconstructions shown in panels A, B, D, and E. Panels C and F include representative cross-sectional views of the three-dimensional reconstructions. All specimens were collected 2 weeks after tooth extraction. Scale bars = 200 µm. Abbreviation: µCT, micro-computed tomography. Please click here to view a larger version of this figure.
Discussion
Successful establishment of the TSHM requires complete tooth removal while preserving the surrounding alveolar architecture, as extraction-related injury may compromise subsequent bone regeneration16. Therefore, the reproducibility of the extraction procedure represents a critical determinant of model reliability17. In this study, a modified forceps-based mandibular first molar extraction approach was systematically compared with a conventional lever-based technique under standardized training conditions. The modified method demonstrated improved procedural efficiency and reproducibility, as reflected by a significantly shorter extraction time and fewer extraction-related complications. Specifically, after the same two-week training period, the average extraction time was reduced from 29 min using the conventional approach to 10 min using the modified approach. Moreover, no alveolar socket wall defects were observed in the modified group, whereas this complication occurred frequently in the conventional group. Although the incidence of root fracture did not differ significantly between groups, the lower frequency observed with the modified method suggests improved procedural consistency under the present experimental conditions. In addition, improved preservation of the extraction socket architecture was associated with enhanced early bone healing after two weeks. Collectively, these findings indicate that the modified technique may reduce operator-dependent variability during model establishment.
Direct inspection of the extracted tooth and socket is sufficient for routine identification of obvious root fractures and major socket defects. In this comparative study, µCT was used as an objective validation tool to identify retained root fragments and subtle socket wall defects and to quantify early socket-healing outcomes. The improved performance of the modified approach may be attributed to differences in the mechanical strategy used for tooth extraction. Conventional extraction techniques for murine mandibular TSHM generally rely on luxation procedures13,18, in which mechanical force is introduced through instruments inserted around the molar and gradually applied to mobilize the tooth. However, because murine mandibular first molars have enlarged apical root morphology and limited surgical accessibility9, such procedures may generate localized mechanical stress at the insertion site and surrounding alveolar structures. In contrast, the modified approach transfers the primary force application point from the root region to the more stable crown. By applying controlled traction parallel to the long axis of the tooth while simultaneously stabilizing the mandible, this strategy may facilitate gradual expansion of the extraction socket and reduce uncontrolled stress concentration. Importantly, this modification also simplifies the principal force-control step during extraction, potentially lowering the technical barrier for researchers with limited microsurgical experience.
Despite these advantages, several technical considerations remain important for successful implementation of this protocol because the outcome remains dependent on operator technique. First, maintain the direction of the applied force parallel to the long axis of the tooth to improve crown grip and minimize unnecessary stress concentration and root fracture associated with off-axis force application. Second, avoid excessive insertion depth of the toothed tweezers or excessive manipulation, as either may compromise the integrity of the extraction socket. Third, during the optional periodontal ligament pre-loosening step, insert the needle parallel to the long axis of the tooth root to minimize injury to the surrounding alveolar bone, consistent with the authors’ previous report13. Therefore, although the modified approach improves procedural accessibility, adequate training and standardized handling remain essential for achieving consistent results.
Several limitations should be considered when interpreting these findings. First, the sample size for µCT evaluation was relatively limited. Therefore, the observed differences in early bone healing should be interpreted as supportive evidence of improved model establishment rather than definitive evidence of enhanced healing. Second, only two operators were included in this study. Consequently, the assessment of inter-operator variability was limited and may have introduced operator-related bias. Third, the protocol was validated only in right mandibular first molars of 8-week-old male mice. Quantitative comparisons of extraction success, procedure-related complications, and socket healing across different age groups were not performed. Accordingly, whether the observed advantages can be generalized to animals of different ages or sexes requires further investigation.
In summary, this study presents an optimized approach for mouse mandibular first molar extraction and validates its performance through direct comparison with the conventional technique. The modified method facilitates more reproducible establishment of murine mandibular TSHM while lowering the initial technical barrier for beginners. These findings provide practical guidance for researchers establishing mandibular tooth socket healing models.
Disclosures
The authors declare no conflicts of interest.
Acknowledgements
This work was supported by the National Natural Science Foundation of China (Grant No. 82571084) and the Sichuan Province Science and Technology Program (Grant No. 2024JDKXJ0001).
Materials
| Name | Company | Catalog Number | Comments |
|---|---|---|---|
| 25 G syringe needles | Beyotime | FS802-30pcs | Disposable syringe needles used for the mouth retractor and optional periodontal ligament pre-loosening |
| 4% paraformaldehyde solution | Solarbio | P1110 | 4% paraformaldehyde solution used for specimen fixation |
| 75% ethanol | Ouse Medical Devices Store | N/A | 75% medical-grade ethanol used for surface disinfection |
| C57BL/6 mice | Charles River | 213 | 8-week-old male C57BL/6 mice weighing 22–29 g |
| Carprofen | Solarbio | C5350 | Postoperative analgesic administered subcutaneously at 5 mg/kg |
| Cotton balls | Ouning Medical Devices | N/A | Sterile cotton balls used for oral cleaning and hemostasis |
| CTAn v1.18.4.0+ | SkyScan | N/A | Software used for μCT image analysis |
| DataViewer v1.5.6.2 | SkyScan | N/A | Software used for viewing and exporting reconstructed μCT images |
| Finger sleeves | LeSu Office | MEKU-1/2/3B | Finger sleeves used for thumb protection during extraction |
| Foam board | Dongguan Lijianglong Industrial Co., Ltd. | N/A | Foam board used as the operating and fixation platform |
| Gel diet | ReadyDietech | J10001 | Postoperative diet provided on the cage floor for 3 days, when used |
| GraphPad Prism v10.1.2 | GraphPad | RRID: SCR_002798 | Software used for statistical analysis and graph generation |
| Headlamp | Bazhou Pengen Protective Equipment Factory | N/A | Headlamp used to illuminate the surgical field |
| Heating pad | Shijiazhuang Jianuan Electrical Appliances Co., Ltd. | N/A | Heating pad preheated to approximately 38 °C for postoperative recovery |
| Hydroxyapatite phantom | QRM | QRM-70127 | Calibration phantom used to convert CT attenuation values into bone mineral density |
| Magnification device | Olympus Corporation | SZX10 | Device used to inspect the toothed tweezer tips and extraction socket under magnification |
| Mask | Senlun Medical Devices Specialty Store | N/A | Surgical mask |
| Micro-computed tomography scanner | Bruker SkyScan | SkyScan 1276 | μCT scanner used at 80 kV, 500 μA, and 10 μm voxel resolution |
| Mimics Research v21.0 | Materialise | RRID: SCR_015802 | Software used for three-dimensional reconstruction |
| Pentobarbital sodium | Sigma-Aldrich | P3761 | Pentobarbital sodium salt used as a 1% anesthetic solution |
| Phosphate-buffered saline solution | Solarbio | P1010 | 0.01 M phosphate-buffered saline powder, pH 7.2–7.4 |
| Povidone-iodine antiseptic solution | Belkon Pharmacy Flagship Store | N/A | Povidone-iodine solution used for abdominal disinfection |
| Rubber bands | Foshan Puli Rubber Products Factory | N/A | Rubber bands used to assemble the mouth retractor |
| Saline solution | Thermo Fisher | BR0053G | Saline tablets used to prepare the solution for oral cleaning |
| Standard chow diet | Jiangsu Xietong Pharmaceutical and Biotechnology Engineering Co., Ltd. | XTC01WC-001 | Standard chow used for routine housing and softened for postoperative feeding |
| Steam sterilizer | Institutional facility | N/A | Equipment used to sterilize the toothed tweezers and saline solution |
| Sterile cotton swabs | Kangbailai Medical Devices Store | N/A | Single-use sterile cotton swabs |
| Sterile gloves | Senlun Medical Devices Specialty Store | N/A | Sterile latex gloves |
| Sterile non-woven fabric | Shandong Xinhua Infection Control Supplies Hangzhou Store | N/A | Sterile non-woven fabric used to cover the operating surface and heating pad |
| Sterile surgical cap | Senlun Medical Devices Specialty Store | N/A | Sterile surgical cap |
| Surgical scrubs | Senlun Medical Devices Specialty Store | N/A | Clean surgical scrubs worn during the procedure |
| Tape | Thermo Fisher | 15947 | Adhesive tape used to secure the mouse limbs |
| Toothed ophthalmic tweezers | Beyotime | FS229 | Toothed ophthalmic forceps used as dental forceps |
| Veterinary ophthalmic ointment | Dechra Veterinary Products | 143-16 | Ophthalmic ointment applied after anesthesia to prevent corneal drying |
References
- Chavez MB, et al. Bone sialoprotein is critical for alveolar bone healing in mice. J Dent Res. 2023;102(2):187-196.
- Guan B, Liu L, Liu Y. Application and characterisation of four genetically engineered animal models (mouse/zebrafish/rhesus monkey/drosophila) in acute myeloid leukemia. Gene. 2025;963:149607.
- Varshney GK, Burgess SM. Crispr-based functional genomics tools in vertebrate models. Exp Mol Med. 2025;57(7):1355-1372.
- Phanrungsuwan A, Donnelly B, Millán JL, Foster BL. Targeted alkaline phosphatase therapy enhances alveolar bone healing in X-linked hypophosphatemia in mice. J Periodontal Res. 2026;61(3):309-322. doi:10.1111/jre.70044.
- Mohamed FF, et al. Dentoalveolar defects and impaired alveolar bone healing in a neural crest-directed conditional knockout mouse model of hypophosphatasia. Bone. 2025;198:117538.
- Oka H, et al. Subset of the periodontal ligament expressing leptin receptor contributes to part of hard tissue-forming cells. Sci Rep. 2023;13(1):3442.
- Chen S, Rittel D, Shemtov Yona K. The normal stiffness of the edentulous alveolar process. Bone Rep. 2021;14:101066.
- Lungová V, et al. Tooth-bone morphogenesis during postnatal stages of mouse first molar development. J Anat. 2011;218(6):699-716.
- Iwama H, et al. Acellular extrinsic fiber cementum is invariably present in the superficial layer of apical cementum in mouse molar. J Histochem Cytochem. 2024;72(2):109-120.
- Hadad H, et al. Rodents as an animal model for studying tooth extraction-related medication-related osteonecrosis of the jaw: Assessment of outcomes. Arch Oral Biol. 2024;159:105875.
- Mouraret S, et al. A pre-clinical murine model of oral implant osseointegration. Bone. 2014;58:177-184.
- Yu F, Liu L, Xia L, Fang B. Establishment of a C57BL/6 mandibular critical-size bone defect model. J Craniofac Surg. 2021;32(7):2562-2565.
- Yu C, Yu F, Li F, Ye L. The establishment of a murine mandibular molar extraction socket healing model. J Vis Exp. 2023;(191). doi:10.3791/64855.
- University of Michigan Unit for Laboratory Animal Medicine. Guidelines on anesthesia and analgesia in mice. Updated January 23, 2026. Available at: https://az.research.umich.edu/animalcare/guidelines/guidelines-anesthesia-and-analgesia-mice/. Accessed August 5, 2026.
- Qiu Y, et al. Investigation of the furcation morphology of permanent mandibular first molars by using micro-computed tomography. BMC Oral Health. 2024;24(1):1150.
- Vieira AE, et al. Intramembranous bone healing process subsequent to tooth extraction in mice: Micro-computed tomography, histomorphometric and molecular characterization. PLoS One. 2015;10(5):e0128021.
- Jiang J, Mou J, Wang S, Liu J. Protocol for establishing a mouse model of bilateral maxillary first molar extraction to study alveolar bone healing. STAR Protoc. 2026;7(1):104366.
- Liang B, Zhang W, Xue Y. Observation and analysis of tooth extraction wound healing process of maxillary first molars in C57BL/6 mice. Chin J Pract Stomatol. 2019;12(232):e6.
Reprints and Permissions
This article has been published
Video Coming Soon