This single-center retrospective study analyzes de-duplicated Pseudomonas aeruginosa (PA) isolates from 2023 to 2025 and examines resistance trends before and after a four-component antimicrobial stewardship intervention in the Resp-TB.
Research Article
Trends in Pseudomonas aeruginosa Resistance After a Four-Dimensional Antimicrobial Stewardship Intervention
* These authors contributed equally
In This Article
Summary
Abstract
This single-center retrospective study analyzed de-duplicated Pseudomonas aeruginosa isolates collected at Huaian Municipal Infectious Diseases Hospital from 2023 to 2025. A total of 121 unique isolates were included, of which 83.5% were from sputum. Antimicrobial susceptibility testing (AST) was performed using an automated microbiology system, and minimum inhibitory concentration (MIC) results were interpreted according to CLSI M100, 33rd edition. In early 2024, a four-dimensional linkage-targeted antimicrobial stewardship intervention was implemented in the Respiratory and Tuberculosis Department (Resp-TB) (n = 97), comprising: (1) dynamic antimicrobial resistance surveillance with quarterly feedback; (2) risk-stratified antimicrobial prescribing based on local susceptibility data; (3) standardized specimen collection protocols; and (4) enhanced infection prevention and control measures. In the Resp-TB, the overall resistance rates were 74.19% in 2023, 81.63% in 2024, and 82.93% in 2025, with no significant reduction after the intervention (p ≈ 0.37). By 2025, resistance to tobramycin was 0/41 (0.00%), cefepime was 1/41 (2.44%), and piperacillin-tazobactam was 0/41 (0.00%); levofloxacin resistance reached 15/41 (36.59%). Trimethoprim-sulfamethoxazole resistance remained high across the study period. These findings show persistent antimicrobial resistance in the Resp-TB after implementation of the intervention, while resistance to selected agents, including tobramycin, cefepime, and piperacillin-tazobactam, remained low in 2025.
Introduction
Pseudomonas aeruginosa (PA) is a major cause of hospital-acquired infections and is one of the most commonly isolated Gram-negative non-fermenting bacilli in clinical practice1. Its intrinsic and acquired resistance to multiple antimicrobials is associated with low outer-membrane permeability, efflux pump overexpression, and the production of drug-degrading enzymes. Under antibiotic selection pressure, PA can readily acquire new resistant phenotypes2,3. In recent years, the increasing occurrence of multidrug-resistant (MDR) and extensively drug-resistant (XDR) PA strains has reduced treatment options and has been associated with prolonged hospitalization and increased mortality4,5,6,7. The One Health approach, which recognizes the interconnectedness of human, animal, and environmental health, is increasingly advocated as an important framework for the prevention and control of antimicrobial resistance4,6. In this context, local antimicrobial resistance surveillance data, such as the PA resistance trends reported here, can help inform antimicrobial stewardship and infection-control strategies.
These challenges are particularly relevant in specialized infectious-disease hospitals. Patients with tuberculosis often receive long-term anti-tuberculosis treatment that may include fluoroquinolones, increasing the risk of cross-resistance to agents such as levofloxacin and complicating the management of PA co-isolates8,9. In addition, immunocompromised status and prolonged hospital stays in this patient population may increase susceptibility to MDR-PA isolates and poorer clinical outcomes10,11.
Many previous surveillance studies have used total isolate counts without accounting for potential bias caused by repeated sampling from the same patient. Both the World Health Organization Global Antimicrobial Resistance Surveillance System (WHO GLASS) and the Clinical and Laboratory Standards Institute (CLSI) recommend de-duplication strategies to improve data accuracy, such as retaining only the first isolate per patient per infection episode12.
Although PA antimicrobial resistance is a well-recognized global concern, evidence on targeted antimicrobial stewardship interventions in specialized Resp-TBs remains limited. Most existing studies focus on intensive care units or general respiratory wards, leaving a gap in understanding how structured, multi-component interventions perform in settings with high tuberculosis prevalence and complex antibiotic exposure histories. This single-center retrospective study analyzed de-duplicated PA isolates collected at Huaian Municipal Infectious Diseases Hospital from 2023 to 2025, with particular attention to the Resp-TB. We hypothesized that changes in PA antimicrobial resistance patterns would be observed after implementation of a four-dimensional linkage-targeted antimicrobial stewardship intervention comprising dynamic surveillance, risk-stratified prescribing, standardized specimen collection, and enhanced infection prevention and control. The study aimed to describe local resistance trends and to evaluate whether these data could support antimicrobial stewardship and infection control practices in this hospital.
Protocol
Specimen information for Pseudomonas aeruginosa isolates collected between 2023 and 2025 was obtained from the laboratory database of Huai’an No. 4 People’s Hospital. All samples were de-identified before analysis and processed in compliance with approved protocols from the Ethics Committee of Huai’an No. 4 People’s Hospital (Approval No. HASY2024011).
Study subjects and inclusion criteria
This single-center retrospective study included clinical Pseudomonas aeruginosa (PA) isolates collected by the Microbiology Laboratory of Huaian Infectious Diseases Hospital between January 2023 and December 2025. Isolates were eligible if they were definitively identified as PA using an automated microbiology system with a GN identification card and had complete, readable antimicrobial susceptibility testing (AST) results. Specimens were primarily from respiratory sources, including sputum and bronchoalveolar lavage fluid, but isolates from other sites were also included.
The de-duplication procedure followed a strict “one patient–one isolate per calendar year” principle and was applied in two steps. First, within each calendar year, when multiple PA isolates were identified from the same patient, matched by name, only the first clinically significant isolate was retained for that year’s analysis. Second, across different calendar years, a patient with separate admissions and corresponding PA isolates in more than one year was treated as an independent observation in each annual cohort. Thus, the same patient could theoretically be included in more than one annual cohort. This rule is consistent with the WHO GLASS/CLSI de-duplication principle13.
Exclusion criteria were repeated isolates from the same patient within the same calendar year, incomplete patient information, and technically unreadable AST results, such as abnormal growth in positive control wells. Isolates with incomplete antimicrobial susceptibility panels were excluded from the corresponding antibiotic-specific analyses, and the actual number of tested isolates (n) was reported for each antibiotic. A total of 121 patients with 121 PA isolates were included: 31 in 2023, 49 in 2024, and 41 in 2025. Figure 1 shows the study design schematic.
For respiratory specimens, standard laboratory quality assessment was applied. Sputum samples were evaluated using the Murray–Washington criteria, requiring <10 squamous epithelial cells and >25 polymorphonuclear leukocytes per low-power field to ensure specimen validity. All isolates were derived from clinical specimens submitted for routine diagnostic purposes from patients with suspected infection. However, because of the retrospective study design and the lack of systematic clinical correlation data, including signs and symptoms, radiographic findings, inflammatory markers, and treatment response, a formal distinction between true infection and colonization was not made for individual isolates. Therefore, the neutral term “clinical isolates” is used throughout to denote microorganisms with potential clinical significance, without asserting that every isolate necessarily represented a true infection.
Data grouping
Data were stratified by year, department, and specimen source. For longitudinal comparison, isolates were grouped by year: 2023, 2024, and 2025. For departmental analysis, isolates were grouped as follows: Resp-TB (n = 97/121, 80.17%), Digestive and Hepatology Department (n = 12/121, 9.92%), Infectious Diseases Department (n = 5/121, 4.13%), and other departments (n = 7/121, 5.79%). The Resp-TB was the primary observation cohort. Specimen sources were grouped as sputum, bronchoalveolar lavage fluid, and other sources to quantify the contribution of respiratory specimens.
Microbial culture, identification, and antimicrobial susceptibility testing
Isolates were cultured on 5% sheep blood agar, MacConkey agar, and tryptic soy agar with bacitracin at 35–37 °C for 18–24 h. Presumptive identification was based on colony morphology and a positive oxidase test. Definitive identification and antimicrobial susceptibility testing (AST) were performed using an automated microbiology system with GN identification and AST-N399 cards. Bacterial suspensions were prepared to a 0.50–0.63 McFarland standard in sterile saline according to the manufacturer’s instructions. A total of 10 antimicrobial agents were tested: tobramycin, cefepime, piperacillin-tazobactam, amikacin, meropenem, imipenem, gentamicin, cefazolin, levofloxacin, and trimethoprim-sulfamethoxazole. These agents were selected based on the routine laboratory AST panel, agents commonly used for P. aeruginosa infections at the institution, and agents considered in the four-dimensional antimicrobial stewardship intervention. Results were interpreted according to the CLSI M100 guidelines, 33rd edition14. Intermediate results were categorized as resistant when resistance rates were calculated.
Quality control
To ensure reproducibility and accuracy, daily quality control of AST was performed using the reference strain Pseudomonas aeruginosa ATCC 27853. The strain was tested against the same antimicrobial panel to confirm that minimum inhibitory concentrations (MICs) were within CLSI-recommended ranges. If quality-control results fell outside acceptable limits, the test batch was rejected and repeated only after recalibration of the automated microbiology system and verification of reagent integrity.
Four-dimensional linkage-targeted intervention in the Resp-TB
Starting in January 2024, a targeted antimicrobial stewardship intervention, termed “Four-Dimensional Linkage,” was implemented in the Resp-TB. The intervention was coordinated by the department director, infectious disease physicians, clinical pharmacists, and dedicated infection prevention and control (IPC) personnel. It comprised four components.
First, dynamic antimicrobial resistance surveillance and feedback were implemented. A departmental early-warning system for PA resistance was established, and changes in resistance patterns were summarized in quarterly reports to inform antimicrobial stewardship decisions. Second, risk-stratified antimicrobial stewardship was implemented based on local susceptibility data. The tiered prescribing pathway favored agents with consistently low resistance rates, including tobramycin and cefepime, as empirical options; used caution with agents showing rising or high resistance, such as levofloxacin; and avoided trimethoprim-sulfamethoxazole, which has intrinsically poor activity against PA. These measures were informed by local AST data and institutional antimicrobial stewardship policies and did not constitute formal clinical guidelines.
Third, respiratory specimen collection was standardized. Patients were instructed to take a deep breath, clear their throats, and collect sputum according to the laboratory protocol. This procedure was intended to reduce oropharyngeal contamination and improve the reliability of susceptibility testing for lower respiratory tract specimens. Fourth, infection prevention and control measures were strengthened. These included regular checks of hand hygiene compliance before and after patient contact, strict handling and disposal procedures for respiratory secretions, and scheduled environmental disinfection to reduce the potential for in-hospital spread of PA. For evaluation, the study period was divided into a preintervention period (January 2023 to December 2023) and a postintervention period (January 2024 to December 2025).
Statistical analysis
Data were double-entered and verified. Resistance rates were expressed as percentages with 95% confidence intervals (CIs). Annual, departmental, and pre- versus post-intervention comparisons were analyzed using Pearson’s χ2 test; Fisher’s exact test was used when expected frequencies were <5. The Cochran-Armitage χ2 test was used for trend analysis. Adjusted p-values are reported where applicable. For the primary comparison of 2023 versus 2025 across the 10 antibiotics, Bonferroni correction was applied to adjust the significance threshold (α = 0.05/10 = 0.005). A two-tailed p < 0.05 was considered statistically significant for unadjusted comparisons; adjusted p-values are reported where applicable. Software details are provided in the Table of Materials.
Results
Overall distribution of strains and patients
Based on the study criteria and grouping strategy described above, a total of 121 non-duplicate PA isolates from 121 patients were included in the analysis (Figure 1). The annual distribution was 31 isolates in 2023, 49 in 2024, and 41 in 2025 (Table 1). Sputum was the main specimen source, accounting for 83.5% of all samples (Figure 2). The Resp-TB contributed the largest proportion of isolates (n = 97/121, 80.17%), followed by the Digestive and Hepatology Department (n = 12/121, 9.92%), the Infectious Diseases Department (n = 5/121, 4.13%), and other departments (n = 7/121, 5.79%) (Table 2 and Figure 2).
The proportion of sputum specimens remained relatively stable across the study period: 82.9% in 2023, 83.5% in 2024, and 83.0% in 2025. Bronchoalveolar lavage fluid and protected specimen brush samples together accounted for approximately 7.6% of specimens, while blood, urine, and other sample types accounted for the remaining 8.9%. These findings indicate that PA isolates in this hospital were concentrated mainly in respiratory specimens.
Overall, PA isolates were concentrated among patients from the Resp-TB and among respiratory specimens. This distribution supported selecting the Resp-TB as the primary cohort for evaluating the targeted intervention described above.
Annual trends in antimicrobial resistance of Pseudomonas aeruginosa across the hospital
Based on the AST protocol described above, annual antimicrobial resistance patterns for PA are summarized in Table 1 and Figure 3. Because susceptibility and intermediate rates in Table 1 are weighted summary measures, formal comparisons were performed at the individual-antimicrobial level. The resulting p-values are presented in Table 3 for the 2023 versus 2025 comparison. Pearson’s χ2 test or Fisher’s exact test showed no statistically significant differences after Bonferroni correction (all adjusted p > 0.05; Table 3).
The weighted resistance rate was 4.25 percentage points lower in 2025 than in 2023, while the weighted susceptibility rate increased by 4.25 percentage points over the same period. However, these summary measures should be interpreted descriptively because they aggregate results across multiple antimicrobial agents. Antibiotic-specific trends are therefore reported separately in Table 3.
The intermediate rate increased slightly in 2025 after a lower value in 2024. This change should be interpreted cautiously because intermediate results may vary by antimicrobial agent and were categorized as resistant for resistance-rate calculations. Overall, PA resistance remained a surveillance concern throughout the study period, underscoring the need for ongoing antimicrobial stewardship and infection prevention and control.
Resistance profiles of major antibiotics
Building on the AST data described above, divergent resistance patterns among the 10 tested antimicrobial agents were observed over the three-year period, as detailed in Table 3 and illustrated in Figure 4 and Figure 5. Four descriptive resistance patterns were identified.
First, resistance to tobramycin, cefepime, and piperacillin-tazobactam decreased over the study period. Tobramycin resistance decreased from 3.23% in 2023 to 0.00% in 2025, cefepime resistance decreased from 12.90% to 2.44%, and piperacillin-tazobactam resistance decreased from 9.68% to 0.00%. By 2025, all three agents showed low resistance rates in this dataset (Figure 4). Second, amikacin resistance remained low, fluctuating between 0.00% and 4.08% over the three years. Third, carbapenem resistance increased in 2024 and then decreased in 2025. Meropenem resistance increased from 9.68% in 2023 to 18.37% in 2024, then decreased to 12.20% in 2025. Imipenem resistance increased from 12.90% to 24.49%, then decreased to 17.07%. These findings indicate a transient peak in carbapenem resistance in 2024. Fourth, fluoroquinolone resistance remained a concern. Ciprofloxacin resistance remained high throughout the study period, and levofloxacin resistance increased from 16.13% in 2023 to 36.59% in 2025. Trimethoprim-sulfamethoxazole resistance remained consistently high (>79%) across all three years. Annual comparisons of resistance rates for individual antibiotics are illustrated in Figure 5.
Overall, these findings show heterogeneous antibiotic-specific resistance patterns in PA isolates at this institution. The increase in levofloxacin resistance and the persistently high trimethoprim-sulfamethoxazole resistance support continued antimicrobial stewardship monitoring.
Comparative analysis of antimicrobial resistance rates across three key departments
Based on the departmental stratification described above, resistance rates across the three main departments are summarized in Table 2 and Figure 6. The Resp-TB was the primary target of the intervention and had a high resistance rate throughout the study period: 74.19% in 2023 (23/31, 95% CI: 55.39–85.78%), 81.63% in 2024 (40/49, 95% CI: 67.98–89.76%), and 82.93% in 2025 (34/41, 95% CI: 67.94–91.18%). No statistically significant reduction was observed (Cochran–Armitage linear trend test, Z = 0.89, p ≈ 0.37; Fisher’s exact test for 2023 versus 2025, p ≈ 0.37). These findings do not support a clear temporal association between the intervention and a reduction in departmental resistance.
The Infectious Diseases Department had a few isolates across the study period (n = 5). The corresponding rates were 6.45% in 2023 (2/31), 4.08% in 2024 (2/49), and 2.44% in 2025 (1/41). Because of the small number of isolates, these results should be interpreted cautiously and are not suitable for robust trend analysis.
The Digestive and Hepatology Department also had a small number of isolates (n = 12). The reported rates were 0.00% in 2023, 55.56% in 2024, and 0.00% in 2025. This fluctuation likely reflects the small annual sample sizes, in which a small number of resistant isolates can strongly influence percentage estimates.
Overall, the Resp-TB accounted for most PA isolates and maintained high rates of resistance throughout the study period. The smaller departmental groups had limited sample sizes, reducing the reliability of cross-departmental comparisons. Annual departmental trends are shown in Figure 6.
Targeted intervention in the Resp-TB
Following implementation of the four-dimensional linkage-targeted intervention in January 2024, the departmental proportion reported for the Resp-TB did not decline as hypothesized (Figure 6). The reported value was 74.19% in 2023, 81.63% in 2024, and 82.93% in 2025, with no statistically significant reduction (Cochran–Armitage linear trend test, Z = 0.89, p ≈ 0.37; Fisher’s exact test for 2023 versus 2025, p ≈ 0.37; Table 2 and Figure 6). For descriptive context, the annual departmental values were plotted alongside Chinese multicenter and international reference values from previous surveillance reports (Figure 7)15,16. These external reference values are presented solely to provide contextual information and are not directly comparable with the present dataset because the studies differed in their definitions of resistance, patient populations, sampling strategies, isolate de-duplication procedures, and antimicrobial panels. Therefore, Figure 7 should not be interpreted as demonstrating a significant reduction, cumulative reduction, convergence toward an external benchmark, achievement of a target, or effectiveness of the intervention.
Antibiotic-specific patterns varied. Tobramycin resistance remained low, with no resistant isolates detected in 2025. Cefepime resistance decreased from 12.90% in 2023 to 2.44% in 2025. In contrast, levofloxacin resistance increased from 5/31 (16.13%) in 2023 to 11/49 (22.45%) in 2024 and 15/41 (36.59%) in 2025, despite the restriction of levofloxacin use as part of the intervention. This increase may reflect cross-selective pressure from fluoroquinolone-containing antituberculosis regimens, although the absence of prescription data limits direct assessment of the intervention’s effect on prescribing behavior. Trimethoprim-sulfamethoxazole resistance remained consistently high: 96.77% in 2023, 79.59% in 2024, and 92.68% in 2025.
Overall, the annual departmental proportion in the Resp-TB remained high throughout the study period, and the available data did not demonstrate a clear intervention-associated reduction. Nevertheless, the antibiotic-specific findings—including the low resistance to tobramycin and cefepime and the increasing resistance to levofloxacin—may inform continued local antimicrobial resistance surveillance and stewardship monitoring. Because this study lacked patient-level antimicrobial consumption data, contemporaneous control departments, and adjustment for changes in patient case mix, no causal relationship between the four-dimensional intervention and the observed resistance patterns should be inferred.
Summary of findings in relation to the study hypothesis
This study hypothesized that implementation of the four-dimensional linkage-targeted antimicrobial stewardship intervention would be associated with reduced Pseudomonas aeruginosa resistance in the Resp-TB. However, the departmental resistance rate did not decline after intervention: 74.19% in 2023, 81.63% in 2024, and 82.93% in 2025, with no statistically significant reduction (Cochran–Armitage linear trend test, Z = 0.89,p ≈ 0.37; Table 2 and Figure 6). These findings do not support the study hypothesis at the departmental level. Antibiotic-specific trends varied, with low resistance to tobramycin, cefepime, and piperacillin-tazobactam by 2025, while levofloxacin resistance increased to 36.59% (Table 3, Figure 4, and Figure 5).
DATA AVAILABILITY:
The raw datasets underlying all figures and tables in this article are provided as Supplemental Table S1, Supplemental Table S2, and Supplemental Table S3.
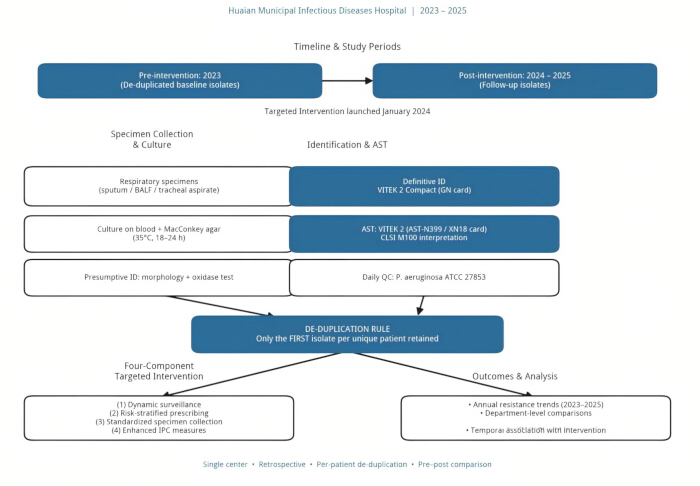
Figure 1. Overall study design schematic. The schematic summarizes specimen collection, culture, bacterial identification, antimicrobial susceptibility testing, quality control, de-duplication, intervention timing, and outcome assessment in this single-center retrospective surveillance study. Respiratory and other clinical specimens were cultured, presumptive identification was based on colony morphology and oxidase testing, and definitive identification and AST were performed using an automated microbiology system. MIC results were interpreted according to CLSI M100, 33rd edition. Daily quality control used Pseudomonas aeruginosa ATCC 27853. A one-patient–one-isolate-per-calendar-year deduplication rule was applied. The pre-intervention period was 2023, and the post-intervention period was 2024–2025. Abbreviations: AST = antimicrobial susceptibility testing; CLSI = Clinical and Laboratory Standards Institute; MIC = minimum inhibitory concentration. Please click here to view a larger version of this figure.
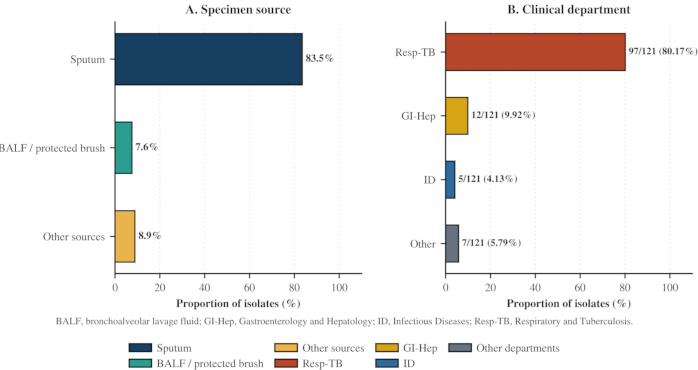
Figure 2. Composition of Pseudomonas aeruginosa isolates by specimen type and department, 2023–2025. The figure shows the distribution of isolates by specimen source and clinical department. (A) Number and proportion of isolates by specimen source, including sputum, BALF, blood, urine, and other sources. (B) Number and proportion of isolates by clinical department. Abbreviations: BALF = bronchoalveolar lavage fluid; GI-Hep = Digestive and Hepatology Department; ID = Infectious Diseases Department; Resp-TB = Respiratory and Tuberculosis Department. Please click here to view a larger version of this figure.
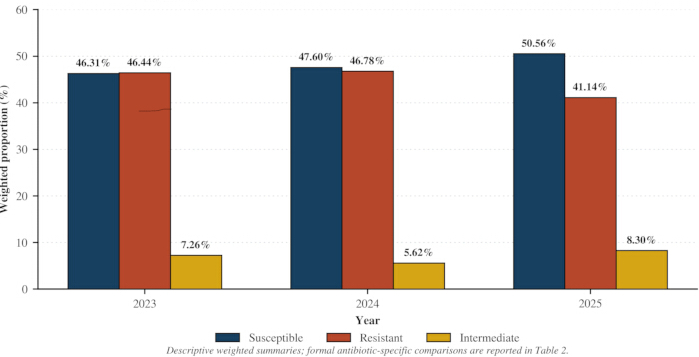
Figure 3. Annual antimicrobial susceptibility profile of Pseudomonas aeruginosa isolates, 2023–2025. Bars show the annual proportions of resistant, susceptible, and intermediate results across the tested antimicrobial agents. Formal antibiotic-specific statistical comparisons are provided in Table 2. Abbreviations: I = intermediate; R = resistant; S = susceptible. Please click here to view a larger version of this figure.
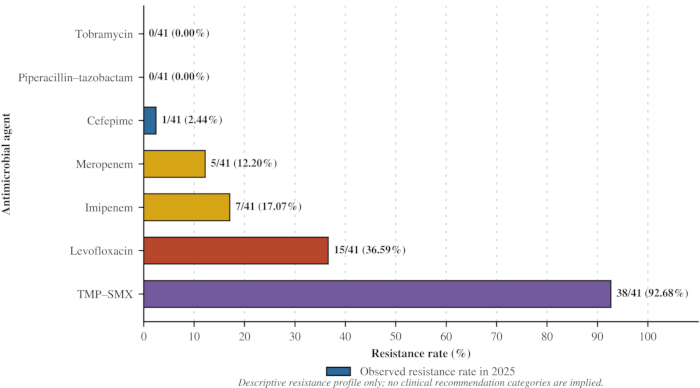
Figure 4. Resistance rates of Pseudomonas aeruginosa to major antimicrobial agents in 2025. Antibiotics are ranked by resistance rate in 2025. The dashed reference line indicates the weighted summary resistance rate for the tested antimicrobial agents. No clinical recommendation categories are implied. Please click here to view a larger version of this figure.
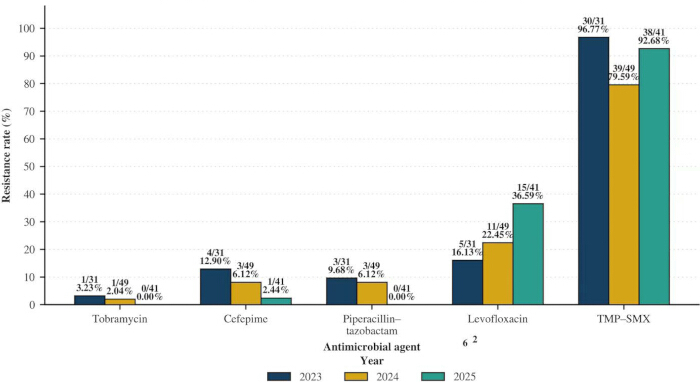
Figure 5. Annual resistance rates of Pseudomonas aeruginosa to five selected antimicrobial agents, 2023–2025. Bars show annual resistance rates for tobramycin, cefepime, piperacillin-tazobactam, levofloxacin, and trimethoprim-sulfamethoxazole. Formal statistical comparisons are provided in Table 2 and described in the Results section. Abbreviation: PA = Pseudomonas aeruginosa. Please click here to view a larger version of this figure.
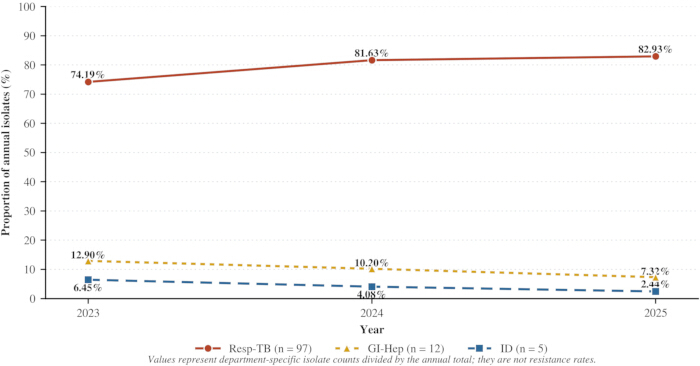
Figure 6. Annual departmental distribution of Pseudomonas aeruginosa isolates, 2023–2025. The figure compares the annual proportion of isolates contributed by three clinical departments. The red solid line denotes the Resp-TB, the intervention target department. The blue dashed line denotes the Infectious Diseases Department. The yellow dotted line denotes the Digestive and Hepatology Department. Abbreviations: ID = Infectious Diseases Department; Resp-TB = Respiratory and Tuberculosis Department. Please click here to view a larger version of this figure.
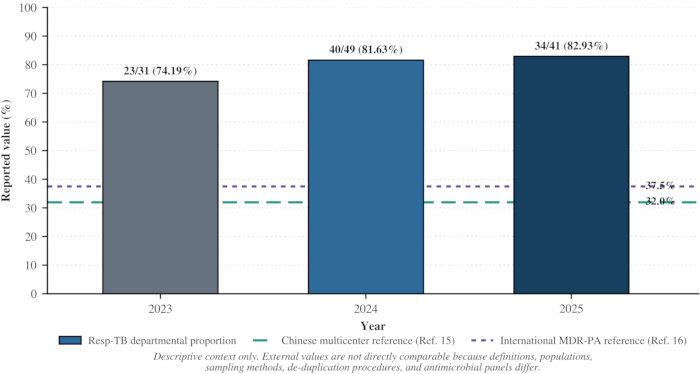
Figure 7. Descriptive presentation of annual departmental values alongside external antimicrobial-resistance reference values. The figure descriptively presents the annual values reported for the Resp-TB together with reference values from a Chinese multicenter surveillance study and an international tertiary-hospital study15,16. The red solid line denotes the annual value for the Resp-TB. The gray bar represents 2023, whereas the blue bars represent 2024 and 2025. The green dashed line denotes the Chinese multicenter reference value, and the purple dotted line denotes the international reference value. These external reference values are presented solely for descriptive context and are not directly comparable with the present data because the underlying studies differed in their definitions of resistance, study populations, sampling strategies, isolate de-duplication procedures, and antimicrobial panels. Accordingly, the figure should not be interpreted as demonstrating a statistically significant reduction, cumulative reduction, convergence toward an external benchmark, achievement of a predetermined target, or effectiveness of the intervention. Abbreviations: PA = Pseudomonas aeruginosa; Resp-TB = Respiratory and Tuberculosis Department. Please click here to view a larger version of this figure.
| Indicator | 2023 (n=31) | 2024 (n=49) | 2025 (n=41) | Trend |
| Numbers of patients/isolates | 31/31 | 49/49 | 41/41 | Initial increase followed by a decrease |
| Overall susceptibility rate (%) | 46.31 | 47.6 | 50.56 | Continuously increase |
| Intermediate rate (%) | 7.26 | 5.62 | 8.3 | Slight fluctuation |
| Resistant rate (%) | 46.44% | 46.78% | 41.14% | Slight fluctuation |
Table 1: Overall antimicrobial susceptibility profile of non-duplicate Pseudomonas aeruginosa isolates, 2023–2025. The table summarizes annual weighted percentages of resistant, susceptible, and intermediate AST results across the tested antimicrobial agents. These summary percentages are descriptive and are not derived from a single binomial denominator; therefore, Pearson’s χ2 p-values are not applicable at this summary level. Antibiotic-specific statistical comparisons are provided in Table 2. Abbreviations: AST = antimicrobial susceptibility testing; I = intermediate; R = resistant; S = susceptible. These are descriptive weighted summary measures, not patient-level resistance rates.
| Department | 2023 (N=31) | 2024 (N=49) | 2025 (N=41) | Total (N=121) |
| Respiratory-TB Department | 23/31 (74.19%) | 40/49 (81.63%) | 34/41 (82.93%) | 97 (80.17%) |
| Digestive & Hepatology Dept. | 4/31 (12.90%) | 5/49 (10.20%) | 3/41 (7.32%) | 12 (9.92%) |
| Infectious Diseases Department | 2/31 (6.45%) | 2/49 (4.08%) | 1/41 (2.44%) | 5 (4.13%) |
| Others | 2/31 (6.45%) | 2/49 (4.08%) | 3/41 (7.32%) | 7 (5.79%) |
| Total | 31/31 (100.00%) | 49/49 (100.00%) | 41/41 (100.00%) | 121 (100.00%) |
Table 2: Distribution of Pseudomonas aeruginosa isolates by department, 2023–2025. Values are presented as n/N (%), where n is the number of isolates from the specified department and year, and N is the total number of isolates that year. The unit of analysis is the isolate after application of the one-patient–one-isolate-per-calendar-year deduplication rule. The Resp-TB was the primary observation cohort for the four-dimensional linkage-targeted intervention. Abbreviations: GI-Hep = Digestive and Hepatology Department; ID = Infectious Diseases Department; PA = Pseudomonas aeruginosa; Resp-TB = Respiratory and Tuberculosis Department.
| Antimicrobial agent | 2023 (N=31) | 2024 (N=49) | 2025 (N=41) | P value* |
| Tobramycin | 1/31 (3.23) | 1/49 (2.04) | 0/41 (0.00) | ns |
| Cefepime | 4/31 (12.90) | 3/49 (6.12) | 1/41 (2.44) | ns |
| Piperacillin/Tazobactam | 3/31 (9.68) | 3/49 (6.12) | 0/41 (0.00) | ns |
| Levofloxacin | 5/31 (16.13) | 11/49 (22.45) | 15/41 (36.59) | ns |
| Trimethoprim/Sulfamethoxazole | 30/31 (96.77) | 39/49 (79.59) | 38/41 (92.68) | ns |
| Meropenem | 3/31 (9.68) | 9/49 (18.37) | 5/41 (12.20) | ns |
| Imipenem | 4/31 (12.90) | 12/49 (24.49) | 7/41 (17.07) | ns |
| Gentamicin | 2/31 (6.45) | 6/49 (12.24) | 2/41 (4.88) | ns |
| Amikacin | 0/31 (0.00) | 2/49 (4.08) | 1/41 (2.44) | ns |
| Cefazolin | 6/31 (19.35) | 10/49 (20.41) | 4/41 (9.76) | ns |
Table 3: Annual resistance rates of Pseudomonas aeruginosa to 10 antimicrobial agents, 2023–2025. Values are presented as R/n (%), where R is the number of resistant isolates and n is the number of tested isolates for each antimicrobial agent and year. p-values compare 2023 versus 2025 using Fisher’s exact test. The Bonferroni-adjusted significance threshold was α = 0.005. The 95% confidence intervals were calculated using the Clopper–Pearson exact method. Denominators reflect the annual de-duplicated isolate counts unless incomplete antimicrobial panels require antibiotic-specific denominators. De-duplication was performed using a one-patient–one-isolate-per-calendar-year rule, with the first isolate retained. Abbreviations: CI = confidence interval; TMP-SMX = trimethoprim-sulfamethoxazole. ns = not significant.
Supplemental Table S1: Analysis of microbiological bacterial specimen data; reporting period: January 01, 2023 00:00:00 – December 31, 2023 23:59:59. Please click here to download this file.
Supplemental Table S2: Analysis of microbiological bacterial specimen data; reporting period: January 01, 2024 00:00:00 – December 31, 2024 23:59:59. Please click here to download this file.
Supplemental Table S3: Analysis of microbiological bacterial specimen data; reporting period: January 01, 2025 00:00:00 – December 31, 2025 23:59:59. Please click here to download this file.
Discussion
Antimicrobial stewardship based on surveillance data quality
Traditional isolate-count methods may overestimate antimicrobial resistance because of repeated sampling from the same patient, particularly in units where patients commonly experience prolonged hospitalization. The use of a first-isolate-per-patient de-duplication strategy is consistent with WHO GLASS recommendations and helps reduce this potential bias17,18. In the present study, the “one patient–one isolate per calendar year” approach enabled annual PA resistance patterns to be evaluated using a patient-centered dataset rather than an accumulation of repeated isolates. Nevertheless, because the same patient could theoretically be included in more than one annual cohort, the data should be interpreted as annual isolate-level surveillance rather than as a longitudinal patient cohort.
After de-duplication, the antimicrobial resistance patterns of PA were analyzed across the hospital and compared descriptively across the three study years. The hospital-wide weighted resistance profile showed only modest changes from 2023 to 2025, and the available data did not demonstrate a significant reduction in resistance following implementation of the four-dimensional intervention. Therefore, the present findings should not be interpreted as evidence of intervention effectiveness. A delayed effect of antimicrobial stewardship remains possible because changes in prescribing behavior, antimicrobial consumption, and selective pressure may require more than one clinical cycle to become measurable19,20. Previous studies have reported gradual reductions in PA resistance following combined antimicrobial stewardship and infection-prevention interventions21,22. However, those studies were conducted in different healthcare environments and used different patient populations, intervention components, resistance definitions, observation periods, and outcome measures. Their findings should therefore be compared cautiously with those of the present single-center retrospective study.
External surveillance reports were used solely to provide descriptive context for the resistance patterns observed in this hospital. CHINET surveillance data from China reported declining resistance of PA to imipenem and meropenem by 2024, while other multicenter and regional studies also described changes in PA resistance over time23,24,25,26. In contrast, the present study was conducted in a specialized infectious-disease hospital in which most PA isolates originated from the Resp-TB. Patients in this department may have experienced prolonged hospitalization, complex infection histories, structural lung disease, and repeated antimicrobial exposure, all of which could have influenced the observed resistance patterns. A Saudi tertiary-hospital study reported an MDR-PA rate of approximately 37.5%16, but this value cannot be directly compared with the present findings because of differences in study design, patient characteristics, sampling methods, de-duplication procedures, definitions of resistance, and antimicrobial panels. Similar caution is required when comparing the present data with longitudinal studies from other regions27. Accordingly, the external reference values shown in Figure 7 are descriptive only and should not be interpreted as evidence of a significant reduction, cumulative improvement, convergence toward a benchmark, target achievement, or intervention effectiveness.
The transient increase in carbapenem resistance in 2024 should also be interpreted cautiously. Meropenem resistance increased from 9.68% in 2023 to 18.37% in 2024 and subsequently decreased to 12.20% in 2025. Similarly, imipenem resistance increased from 12.90% to 24.49% and then decreased to 17.07%. These fluctuations may reflect changes in antimicrobial selection pressure, patient case mix, empirical carbapenem use, or potential transmission dynamics. However, clonal spread, carbapenemase production, porin alterations, efflux-pump expression, and other molecular resistance mechanisms were not directly investigated. Therefore, these mechanisms should be regarded as possible explanations derived from previous reports28,29,30,31,32, rather than as conclusions supported by the present dataset. The relatively small number of annual isolates may also have amplified apparent year-to-year changes in resistance percentages.
The resistance trajectories of the 10 evaluated antimicrobial agents showed heterogeneous antibiotic-specific patterns. Resistance to tobramycin, cefepime, and piperacillin–tazobactam decreased over the study period and remained low by 2025. Tobramycin and piperacillin–tazobactam resistance both reached 0.00% in 2025, while cefepime resistance decreased to 2.44%. Amikacin resistance also remained low throughout the study period, fluctuating between 0.00% and 4.08%. These findings may reflect local prescribing practices, antimicrobial stewardship measures, differences in antimicrobial exposure, and changes in selective pressure33,34. However, patient-level prescription data, defined daily doses, days of therapy, treatment indications, dosage regimens, and treatment durations were unavailable. Consequently, the observed antibiotic-specific changes cannot be causally attributed to the four-dimensional intervention.
Carbapenem resistance peaked in 2024 and subsequently decreased in 2025. This pattern may have been associated with empirical carbapenem use among more severely ill patients, changes in the clinical characteristics of admitted patients, selective antimicrobial pressure, or unmeasured infection-control factors. Biofilm-associated tolerance and other adaptive mechanisms have been described in previous studies of PA35,36. Nevertheless, the present study did not include biofilm testing, carbapenemase detection, molecular resistance analysis, whole-genome sequencing, or assessment of clonal transmission. These explanations therefore remain literature-based possibilities and should not be regarded as mechanisms demonstrated in the present cohort.
Levofloxacin resistance increased progressively from 16.13% in 2023 to 22.45% in 2024 and 36.59% in 2025. In the Resp-TB, patients may receive prolonged or repeated exposure to fluoroquinolone-containing antituberculosis regimens, including moxifloxacin and levofloxacin. Such exposure may exert cross-selective pressure on PA and other bacterial pathogens37,38. However, the present study did not collect patient-level data on antituberculosis regimens, previous fluoroquinolone exposure, cumulative antimicrobial doses, duration of treatment, or treatment adherence. Therefore, a direct association between fluoroquinolone-containing antituberculosis therapy and the increase in levofloxacin resistance could not be tested. The observed trend should be treated as a surveillance signal requiring further investigation rather than as evidence of a confirmed causal relationship.
Trimethoprim–sulfamethoxazole resistance remained consistently high throughout the study period, with rates of 96.77% in 2023, 79.59% in 2024, and 92.68% in 2025. PA is intrinsically poorly susceptible to trimethoprim–sulfamethoxazole; therefore, these results should not be interpreted in the same manner as acquired resistance to routinely active antipseudomonal agents. Instead, the findings reinforce the limited value of trimethoprim–sulfamethoxazole for PA-directed treatment and the importance of interpreting AST results within the context of intrinsic resistance characteristics and current susceptibility-testing standards.
The Resp-TB was selected as the primary target of PA surveillance and intervention because it contributed the largest proportion of isolates during the study period. Patients with pulmonary tuberculosis may have structural lung damage, prolonged hospitalization, repeated exposure to antimicrobial agents, impaired immune responses, and multiple underlying diseases, all of which may increase susceptibility to PA colonization or infection39,40,41,42,43,44,45. Moreover, tuberculosis wards frequently involve the collection and handling of respiratory specimens and secretions, as well as close contact among patients, caregivers, and healthcare personnel. These circumstances may create opportunities for environmental contamination and nosocomial transmission46,47. The high concentration of PA isolates in this department therefore supports continued resistance surveillance, standardized respiratory specimen collection, environmental cleaning, secretion management, and reinforcement of hand-hygiene practices.
Within the limitations of this single-center retrospective design, the annual departmental proportion reported for the Resp-TB did not decline after implementation of the intervention. The reported values were 74.19% in 2023, 81.63% in 2024, and 82.93% in 2025, with no statistically significant reduction (Cochran–Armitage linear trend test, Z = 0.89, p ≈ 0.37). These values describe the annual departmental distribution of PA isolates and should not be interpreted as a direct antibiotic-specific resistance rate. Accordingly, the findings do not demonstrate a clear intervention-associated reduction in PA resistance at the departmental level. Nevertheless, the four-component framework—dynamic resistance monitoring, risk-stratified prescribing, standardized specimen collection, and enhanced infection prevention and control—may provide a practical structure for coordinating antimicrobial stewardship, microbiological diagnostics, and infection-control activities around local surveillance data.
The absence of a statistically significant reduction does not necessarily indicate that every component of the intervention lacked value. Standardized specimen collection may have improved the quality and representativeness of respiratory specimens, while quarterly surveillance reports may have increased clinicians’ awareness of local resistance patterns. Enhanced hand hygiene and environmental disinfection may also have supported routine infection-prevention practices. However, the present retrospective dataset did not include process indicators, such as antimicrobial consumption, appropriateness of empirical prescriptions, compliance with specimen-collection protocols, hand-hygiene adherence, environmental culture results, or time to appropriate therapy. Therefore, the implementation fidelity and independent effects of the four intervention components could not be evaluated.
Several directions should be prioritized in future research. First, multicenter prospective studies with larger sample sizes and contemporaneous control departments are needed to validate the observed resistance trends and determine whether similar stewardship frameworks are applicable across different healthcare settings. Second, patient-level clinical information should be incorporated, including diagnoses, infection severity, comorbidities, antimicrobial exposure, treatment duration, clinical outcomes, and the distinction between infection and colonization. Third, antimicrobial consumption should be quantified using standardized measures, such as defined daily doses or days of therapy, to assess the relationship between prescribing practices and subsequent resistance.
Future studies should also incorporate molecular epidemiological methods. Whole-genome sequencing, carbapenemase-gene detection, analysis of OprD alterations, and assessment of efflux-pump expression would help clarify the mechanisms underlying carbapenem resistance and determine whether temporal changes are related to independent resistance acquisition or clonal transmission. Longitudinal follow-up is needed to assess the sustainability of targeted interventions in high-burden settings such as respiratory and tuberculosis wards. In addition, a One Health framework incorporating environmental surveillance of hospital wastewater, high-contact surfaces, respiratory-care equipment, and regional antimicrobial resistance data could help clarify the broader public health implications of local PA resistance.
In conclusion, this single-center retrospective study used a one-patient–one-isolate-per-calendar-year de-duplication approach to describe the antimicrobial resistance patterns of PA clinical isolates collected from 2023 to 2025. The annual departmental proportion reported for the Resp-TB did not decline after implementation of the four-dimensional linkage-targeted intervention, and the available data did not demonstrate an intervention-associated reduction in antimicrobial resistance. External reference values were used only for descriptive context and were not directly comparable because of differences in resistance definitions, sampling methods, patient populations, de-duplication procedures, and antimicrobial panels. Antibiotic-specific patterns were heterogeneous: resistance to tobramycin, cefepime, and piperacillin–tazobactam remained low by 2025, whereas levofloxacin resistance increased and trimethoprim–sulfamethoxazole resistance remained consistently high. These findings support continued local resistance surveillance and stewardship monitoring, particularly in the Resp-TB, which contributed most of the PA isolates.
This study has several limitations. First, the single-center retrospective design and relatively small sample size (n = 121) limited statistical power and generalizability, particularly for departments with few isolates. Second, detailed clinical data were not systematically available. Therefore, the isolates are described as “clinical isolates” rather than confirmed infections, and a formal distinction between infection and colonization could not be made. Third, patient-level antimicrobial prescription and consumption data were unavailable, limiting assessment of the relationship between the stewardship intervention, antimicrobial use, and resistance patterns.
Fourth, the study lacked a contemporaneous control department and did not use an interrupted time-series design. Therefore, temporal changes could not be distinguished from secular trends, changes in patient case mix, or other concurrent infection-control activities. Fifth, molecular resistance mechanisms—including carbapenemase genes, OprD alterations, efflux-pump expression, biofilm-associated tolerance, and clonal transmission—were not investigated. Sixth, de-duplication relied on patient names and a one-patient–one-isolate-per-calendar-year rule. Misclassification and repeated inclusion of the same patient across different years therefore cannot be excluded.
Finally, MDR and XDR phenotypes were not systematically classified in this retrospective dataset, and the study focused on antibiotic-specific resistance rates rather than composite resistance phenotypes. Process indicators reflecting intervention fidelity, including antimicrobial consumption, appropriateness of empirical therapy, hand-hygiene compliance, specimen-quality rejection rates, and environmental disinfection performance, were also unavailable. Future multicenter prospective studies should use robust patient identifiers, standardized MDR/XDR definitions, prescription-level data, contemporaneous controls, molecular testing, and sufficiently long observation periods to validate these findings and determine the long-term value of targeted antimicrobial stewardship interventions.
Disclosures
The authors have no conflicts of interest to disclose.
Acknowledgements
Thank you to the team members for their support and contribution to this experiment. This work was supported by the Huaian Science and Technology Bureau Project (Grant No. HAB2024030).
Materials
| Name | Company | Catalog Number | Comments |
|---|---|---|---|
| 0.5 McFarland Standard | bioMérieux, France | 21182 | Inoculum standardization |
| 5% Sheep Blood Agar | Thermo Fisher Scientific, USA | PKR01200 | Culture of clinical specimens |
| AST-N399 Card | bioMérieux, France | REF 423701 | Antimicrobial susceptibility testing for the antimicrobial panel |
| CLSI M100 (33rd Ed.) | CLSI, USA | M100-ED33 | Breakpoint interpretation |
| GN Identification Card | bioMérieux, France | 21341 | Definitive identification of Gram-negative isolates |
| GraphPad Prism | GraphPad Software, USA | Version 9.0 | Figure generation |
| MacConkey Agar | Thermo Fisher Scientific, USA | R01552 | Differentiation of Gram-negative bacteria |
| P. aeruginosa ATCC 27853 | ATCC, USA | ATCC 27853 | Daily quality-control reference strain |
| SPSS Statistics | IBM Corp., USA | Version 26.0 | Statistical analysis |
| Tryptic Soy Agar w/ Bacitracin | BD, USA | ICN1010617 | Selective culture |
| VITEK 2 Compact System | bioMérieux, France | V2COMPACT | Automated ID/AST |
References
- Elfadadny A et al. Antimicrobial resistance of Pseudomonas aeruginosa: navigating clinical impacts, current resistance trends, and innovations in breaking therapies. Front Microbiol. 2024;15:1374466.
- Algammal AM et al. Multidrug resistant Pseudomonas aeruginosa: pathogenesis, resistance mechanisms, and novel therapeutic strategies. Microb Pathog. 2024;195:106913.
- Zhao Y et al. Multidrug resistance in Pseudomonas aeruginosa: genetic control mechanisms and therapeutic advances. Mol Biomed. 2024;5(1):62.
- Naghavi M et al. Global burden of bacterial antimicrobial resistance 1990-2021: a systematic analysis with forecasts to 2050. Lancet. 2024;404(10459):1199-226.
- Murray CJL et al. Global burden of bacterial antimicrobial resistance in 2019: a systematic analysis. Lancet. 2022;399(10325):629-55.
- World Health Organization. WHO bacterial priority pathogens list, 2024. Geneva: World Health Organization; 2024.
- Pipitò L et al. Antimicrobial resistance in ESKAPE pathogens: a retrospective epidemiological study at the University Hospital of Palermo, Italy. Antibiotics (Basel). 2025;14(2):186.
- Sinha S et al. Prevalence of co-infection of culture-proven bacterial pathogens in microbiologically confirmed pulmonary tuberculosis patients from a tertiary care center. Cureus. 2024;16(8):e67423.
- Kawa DE et al. Characterization of beta-lactamase and fluoroquinolone resistance determinants in Escherichia coli, Klebsiella pneumoniae, and Pseudomonas aeruginosa isolates from a tertiary hospital in Yolo, Nigeria. Trop Med Infect Dis. 2023;8(11):500.
- Hernandez-Jimenez P et al. Risk factors and outcomes for multidrug resistant Pseudomonas aeruginosa infection in immunocompromised patients. Antibiotics (Basel). 2022;11(11):1459.
- Tumbarello M et al. Multidrug-resistant Pseudomonas aeruginosa bloodstream infections: risk factors and mortality. Epidemiol Infect. 2011;139(11):1740-9.
- Mitamura M et al. Comparison of de-duplication methods used by WHO Global Antimicrobial Resistance Surveillance System (GLASS) and Japan Nosocomial Infections Surveillance (JANIS) in the surveillance of antimicrobial resistance. PLoS One. 2020;15(6):e0228234.
- Clinical and Laboratory Standards Institute. Analysis and presentation of cumulative antimicrobial susceptibility test data. 5th ed. CLSI supplement M39. Wayne (PA): Clinical and Laboratory Standards Institute; 2022.
- Clinical and Laboratory Standards Institute. Performance standards for antimicrobial susceptibility testing. 33rd ed. CLSI supplement M100. Wayne (PA): Clinical and Laboratory Standards Institute; 2023.
- Wan Y et al. Navigating an evolving microbial landscape: emerging antimicrobial resistance trends and precision stewardship in Tianjin tertiary hospitals (2021-2023). Front Cell Infect Microbiol. 2025;15:1629038.
- Shabi Y et al. A decade of antimicrobial resistance trends in Pseudomonas aeruginosa: insights from a tertiary care hospital in Saudi Arabia (2013-2022). Front Microbiol. 2025;16:1617522.
- Kim S, Yoo SJ, Chang J. Importance of susceptibility rate of 'the first' isolate: evidence of real-world data. Medicina (Kaunas). 2020;56(10):507.
- Simner PJ et al. What's new in antibiograms? Updating CLSI M39 guidance with current trends. J Clin Microbiol. 2022;60(10):e02210-21.
- Aiesh BM et al. Impact of an antibiotic stewardship program on antibiotic utilization, bacterial susceptibilities, and cost of antibiotics. Sci Rep. 2023;13(1):5040.
- Sartelli M et al. Preventing and controlling healthcare-associated infections: the first principle of every antimicrobial stewardship program in hospital settings. Antibiotics (Basel). 2024;13(9):896.
- Guo L et al. Successful control of resistance in Pseudomonas aeruginosa using antibiotic stewardship and infection control programs at a Chinese university hospital: a 6-year prospective study. PLoS One. 2018;13(5):e0196932.
- Eljaaly K et al. Impact of an antimicrobial stewardship programme on antimicrobial utilization and the prevalence of MDR Pseudomonas aeruginosa in an acute care hospital in Qatar. JAC Antimicrob Resist. 2021;3(3):dlab095.
- Guo Y et al. Antimicrobial resistance profile of clinical isolates from hospitals across China: CHINET 2024 surveillance report. One Health Adv. 2025;3:23.
- Qin X et al. Antimicrobial resistance of clinical bacterial isolates in China: current status and trends. JAC Antimicrob Resist. 2024;6(2):dlae052.
- Li J et al. Trends and implications of antimicrobial resistance in Pseudomonas aeruginosa: insights from a 19-year study in Zhejiang Province. Medicine (Baltimore). 2024;103(46):e40606.
- Xiao S, Liang X, Han L, Zhao S. Incidence, antimicrobial resistance and mortality of Pseudomonas aeruginosa bloodstream infections among hospitalized patients in China: a retrospective observational multicenter cohort study from 2017 to 2021. Front Public Health. 2023;11:1294141.
- Cimpeanu O et al. Trends in antimicrobial resistance of Acinetobacter baumannii and Pseudomonas aeruginosa from bloodstream infections: an eight-year study in a Romanian tertiary hospital. Microorganisms. 2025;13(7):1558.
- Zhao Y et al. Epidemiological and genetic characteristics of clinical carbapenem-resistant Pseudomonas aeruginosa strains in Guangdong Province, China. Microbiol Spectr. 2023;11(3):e0426122.
- Flores-Vega VR et al. High-risk Pseudomonas aeruginosa clones harboring beta-lactamases: 2024 update. Heliyon. 2025;11(1):e41540.
- Dobrescu MS et al. The difference a year can make: how antibiotic resistance mechanisms in Pseudomonas aeruginosa have changed in Northwestern Transylvania. Biomolecules. 2025;15(1):1.
- Xie X et al. Molecular epidemiology and carbapenem resistance mechanisms of Pseudomonas aeruginosa isolated from a hospital in Fujian, China. Front Microbiol. 2024;15:1431154.
- Huang W et al. Carbapenem-resistant Pseudomonas aeruginosa infections in critically ill children: prevalence, risk factors, and impact on outcome in a large tertiary pediatric hospital of China. Front Public Health. 2023;11:1088262.
- Falcone M, Galfo V, Tiseo G. Not all carbapenem-resistant Pseudomonas aeruginosa strains are alike: tailoring antibiotic therapy based on resistance mechanisms. Curr Opin Infect Dis. 2024;37(6):594-601.
- Schwartz B et al. Multidrug resistant Pseudomonas aeruginosa in clinical settings: a review of resistance mechanisms and treatment strategies. Pathogens. 2024;13(11):975.
- Ciofu O, Tolker-Nielsen T. Tolerance and resistance of Pseudomonas aeruginosa biofilms to antimicrobial agents-how P. aeruginosa can escape antibiotics. Front Microbiol. 2019;10:913.
- Higazy D et al. In vivo evolution of antimicrobial resistance in a biofilm model of Pseudomonas aeruginosa lung infection. ISME J. 2024;18(1):wrae036.
- Anggriawan IMB, Rochmawati ID. Prevalence and risk factors of fluoroquinolone resistance in major bacterial pathogens: a systematic review and meta-analysis. Int J Microbiol. 2026;2026:3173058.
- Panholzer J et al. Ciprofloxacin-resistant Pseudomonas aeruginosa lung abscess complicating COVID-19 treated with the novel oral fluoroquinolone delafloxacin. Case Rep Pulmonol. 2022;2022:1008330.
- Jiang J et al. Disseminated tuberculosis is associated with impaired T cell immunity mediated by the non-canonical NF-kappaB pathway. J Infect. 2024;89(3):106231.
- Moreira-Teixeira L et al. T cell-derived IL-10 impairs host resistance to Mycobacterium tuberculosis infection. J Immunol. 2017;199(2):613-23.
- Schwander S, Dheda K. Human lung immunity against Mycobacterium tuberculosis: insights into pathogenesis and protection. Am J Respir Crit Care Med. 2011;183(6):696-707.
- Yuan Q et al. Risk factors and outcomes of inpatients with carbapenem-resistant Pseudomonas aeruginosa bloodstream infections in China: a 9-year trend and multicenter cohort study. Front Microbiol. 2023;14:1137811.
- Maraolo AE et al. Clinical outcomes and predictors of mortality in patients with difficult-to-treat resistant Pseudomonas aeruginosa infections: a retrospective cohort study. Antibiotics (Basel). 2026;15(1):33.
- Abdul Jabar K et al. Predictors of mortality in Pseudomonas aeruginosa bloodstream infections: a scoping review. Pathogens. 2026;15(1):61.
- Geremia N et al. Risk factors for 30-day mortality and the role of empirical therapy in Pseudomonas aeruginosa bloodstream infections. Infection. 2025;53(5):2243-56.
- Boyce JM. Hand and environmental hygiene: respective roles for MRSA, multi-resistant Gram-negative bacteria, Clostridioides difficile, and Candida spp. Antimicrob Resist Infect Control. 2024;13(1):110.
- Glowicz JB et al. SHEA/IDSA/APIC practice recommendation: strategies to prevent healthcare-associated infections through hand hygiene: 2022 update. Infect Control Hosp Epidemiol. 2023;44(3):355-76.