By integrating network pharmacology, molecular docking, and molecular dynamics simulations, this computational study proposes candidate mechanisms through which Qu’s Formula 1 (QUF1) may be associated with anxiety and depression phenotypes in polycystic ovary syndrome (PCOS), with emphasis on inflammation-related signaling pathways.
Research Article
Qu's Formula 1 for Anxiety and Depression in PCOS: A Computational Network Pharmacology, Molecular Docking, and Molecular Dynamics Study
* These authors contributed equally
In This Article
Summary
Abstract
Qu’s Formula 1 (QUF1), a patented Chinese herbal medicine, has shown clinical potential in alleviating anxiety and depression in patients with polycystic ovary syndrome (PCOS). This study aimed to investigate potential molecular mechanisms associated with QUF1 using network pharmacology, molecular docking, and molecular dynamics (MD) simulations. Active constituents and potential therapeutic targets of QUF1 were identified using TCMSP and BATMAN-TCM, while PCOS-, anxiety-, and depression-related targets were retrieved from GeneCards, OMIM, and DrugBank. Overlapping targets were used to construct a herb-constituent-target network, followed by Gene Ontology (GO) and Kyoto Encyclopedia of Genes and Genomes (KEGG) enrichment analyses to identify relevant pathways. Molecular docking and 100 ns MD simulations were subsequently used to assess predicted interactions and structural stability between selected constituents and key targets. A total of 76 common targets were identified at the intersection of QUF1 and the disease-related target sets. Protein-protein interaction (PPI) analysis highlighted ALB, TNF, AKT1, IL-6, and ESR1 as key network targets, while KEGG enrichment identified the PI3K-Akt, HIF-1, and FoxO signaling pathways among the relevant pathways. Molecular docking and MD simulations further indicated favorable predicted interactions and generally stable structural behavior for the selected compound-target complexes. These findings support a computational hypothesis that QUF1 may act through a multi-compound, multi-target network associated with inflammatory regulation in PCOS-related anxiety and depression. The results provide a theoretical framework for subsequent experimental and pharmacokinetic validation.
Introduction
Polycystic ovary syndrome (PCOS) is a prevalent endocrine disorder in females of reproductive age, characterized by aberrant menstrual patterns, hirsutism, obesity, dyslipidemia, and insulin resistance1. According to different diagnostic criteria, including those of the National Institutes of Health (NIH), Rotterdam, and the Androgen Excess and PCOS Society, the reported prevalence ranges from 4% to 21% worldwide2,3. Multiple studies have reported a heightened susceptibility to anxiety and depression among women diagnosed with PCOS, with an estimated prevalence ranging from 37% to 60%4,5. However, the basis for the elevated prevalence of anxiety and depression in women with PCOS remains incompletely understood. Proposed contributors include hormonal fluctuations and dissatisfaction related to weight gain associated with PCOS, while elevated serum androgen levels have also been associated with depression6,7.
Traditional Chinese medicine (TCM) has been used in the treatment of PCOS. “Syndrome differentiation and treatment” (bian zheng lun zhi) is emphasized in TCM8. Within this framework, stagnation of liver-QI and deficiency of the kidney are considered to contribute to the pathogenesis of anxiety and depression in patients with PCOS9. The treatment principle of soothing the liver is described as regulating emotional activity and modulating the function of the “kidney-heavenly tenth-uterus” axis10. Acupuncture has also been investigated as a potential intervention for depression11.
As PCOS is a chronic condition, anxiety and depression may also be associated with concerns about fertility. Qu’s Formula 1 (QUF1) is a patented Chinese herbal medicine developed for PCOS-associated anxiety and depressive symptoms and is protected under Chinese National Invention Patent CN104547906A. The formula contains Schisandrae Chinensis Fructus (Wuweizi), Rubi Fructus (Fupenzi), Atractylodes Macrocephala Koidz (Baizhu), Ziziphi Spinosae Semen (Suanzaoren), Curcumae Radix (Yujin), Bambusae Caulis in Taeniam (Zhuru), and Ophiopogon Japonicus (Maidong). Within the TCM framework of “simultaneous treatment of body and mind,” Rubi Fructus, Atractylodes Macrocephala Koidz, and Schisandrae Chinensis Fructus are described as tonifying the kidney and strengthening the spleen. Curcumae Radix and Bambusae Caulis in Taeniam are described as soothing the liver, regulating Qi, clearing heat, and resolving phlegm, while Ziziphi Spinosae Semen and Ophiopogon japonicus are described as nourishing Yin, clearing heart-fire, and tranquilizing the mind. Clinical use has suggested potential benefits of QUF1 for anxiety and depression scores in patients with PCOS.
Despite this clinical potential, a research gap remains regarding the biological crosstalk and molecular targets through which QUF1 may be associated with the PCOS-psychiatric continuum. Conventional therapeutic strategies may not fully address the overlapping metabolic, endocrine, and neuroinflammatory features of this comorbidity. The present study, therefore, provides a systematic in silico exploration of the proposed multi-ingredient, multi-target actions of QUF1. Network pharmacology, molecular docking, and molecular dynamics simulations were integrated to map candidate constituent-target-pathway relationships and to generate hypotheses relevant to the “body-mind co-treatment” principle of TCM in PCOS-related mood disorders.
Protocol
This study was entirely computational and did not involve human participants, human-derived specimens, vertebrate animals, or identifiable personal data. Therefore, an institutional ethics committee or animal care and use approval was not required. The tools used for the protocol are listed in the Table of Materials.
1. Screening the active constituents and potential targets of QUF1
The active constituents of the seven herbs in QUF1 were identified using two databases: the Traditional Chinese Medicine Systems Pharmacology Database and Analysis Platform (TCMSP; https://www.tcmsp-e.com/tcmsp.php; accessed November 2025) and the A Bioinformatics Annotation Database for Molecular Mechanism of Traditional Chinese Medicine (BATMAN-TCM; http://bionet.ncpsb.org.cn/batman-tcm/; version 2.0; accessed November 2025)12,13. The search terms comprised the Chinese pinyin and Latin names of the individual herbs: Rubi Fructus (Fupenzi), Atractylodes Macrocephala Koidz (Baizhu), Schisandrae Chinensis Fructus (Wuweizi), Curcumae Radix (Yujin), Bambusae Caulis in Taeniam (Zhuru), Ziziphi Spinosae Semen (Suanzaoren), and Ophiopogon japonicus (Maidong). Within TCMSP, the selection thresholds were oral bioavailability (OB) ≥ 30% and drug-likeness (DL) ≥ 0.1814. In BATMAN-TCM, a cutoff score > 80 and p < 0.05 were used as the filtering criteria15.
The SwissADME web tool (http://www.swissadme.ch/) was used for in silico ADMET prediction. Standard SMILES strings for the active compounds were obtained from PubChem and submitted to SwissADME. Detailed ADMET prediction parameters are provided in Supplementary File 1. After removal of duplicate entries across databases, protein names were converted to official gene names using the UniProtKB database (http://www.uniprot.org/; release 2025_04; restricted to Homo sapiens)16.
2. Anxiety-, depression-, and PCOS-related target predictions
Disease-related targets associated with PCOS, anxiety, and depression were retrieved using the search terms “Polycystic Ovary Syndrome,” “Anxiety disorder,” and “Depression” across three databases, all accessed in November 2025: GeneCards (https://www.genecards.org/; version 5.26), with a target-selection threshold of relevance score > 5; Online Mendelian Inheritance in Man (OMIM; https://www.omim.org/; version 5.1.10); and DrugBank (https://www.drugbank.ca/)17,18,19. After duplicate entries were removed, the resulting disease-related target sets were compiled for subsequent analysis.
3. Network visualization
Potential targets associated with QUF1, anxiety, depression, and PCOS were entered into the visualization platform (http://www.bioinformatics.com.cn/). Genes identified at the intersection of these target sets were considered candidate targets for subsequent analysis of QUF1 in PCOS-related anxiety and depression. The overlapping targets were aligned with the active constituent-target data for QUF1, and a herb-constituent-target (H-C-T) network was constructed using Cytoscape software (version 3.7.2)20.
4. Protein-protein interaction network construction
The protein-protein interaction (PPI) network was constructed by importing the intersecting targets into the STRING database (http://stringdb.org/; version 12.0; accessed November 2025)21. The species was set to Homo sapiens, with the minimum interaction threshold set to medium confidence > 0.4; all other parameters remained at their default settings. Non-essential nodes were hidden, and the resulting PPI network was visualized using Cytoscape.
Subnetwork clustering of the PPI network was performed using the Molecular Complex Detection (MCODE) plugin in Cytoscape. The reported module-selection parameters were node score cutoff = 0.2, degree cutoff = 2, max depth = 100, K-core = 2, and minimum MCODE score cutoff = 4.0. The resulting modules and associated parameters were then extracted for analysis.
5. Gene Ontology and Kyoto Encyclopedia of Genes and Genomes pathway enrichment analyses
The intersecting targets were entered into the Database for Annotation, Visualization, and Integrated Discovery (DAVID; https://david.ncifcrf.gov/home.jsp; accessed November 2025), with Homo sapiens selected as the species and P < 0.05 used as the stated significance threshold22. Cellular component (CC), molecular function (MF), and biological process (BP) terms from Gene Ontology (GO), together with Kyoto Encyclopedia of Genes and Genomes (KEGG) pathways, were analyzed.
The 10 GO terms and 20 KEGG pathways with the lowest reported P values were visualized using the online visualization platform (http://www.bioinformatics.com.cn/). A network layout of the top 20 signaling pathways and their corresponding targets was also generated using Cytoscape to construct the pathway-target-constituent network associated with QUF1 and PCOS-related anxiety and depression.
6. Molecular docking analysis
Crystal structures of the five selected hub target proteins were retrieved from the Protein Data Bank (PDB; https://www.rcsb.org/)23: ALB (PDB ID: 6FAK), TNF (PDB ID: 5M2J), AKT1 (PDB ID: 3CQW), IL-6 (PDB ID: 1ALU), and ESR1 (PDB ID: 1XP6). Protein structures were prepared using PyMOL software (version 2.4.1)24 and AutoDockTools (version 1.5.7) by removing crystallographic water molecules and non-receptor heteroatoms, adding polar hydrogens, and assigning Kollman charges25.
Three-dimensional ligand structures were optimized, assigned charges, and converted to PDBQT format. Docking grid boxes were centered on the original co-crystallized ligand-binding pockets, with grid dimensions set to 60 × 60 × 60. Mol2 files corresponding to the five selected active constituents of QUF1 were obtained from the TCMSP database. Fifty independent docking runs were performed for each compound-target pair, and the lowest calculated docking energy was selected for the reported analysis. Lower docking energy values were interpreted as indicating more favorable predicted ligand-receptor interactions within the docking model.
7. Molecular dynamics simulations
Molecular dynamics (MD) simulations were performed using GROMACS software (version 2020.3)26. The amber99sb-ildn force field was applied to the proteins. For small-molecule ligands, topology and force-field parameters were generated using the General AMBER Force Field (GAFF). Ligand topologies and partial charges were generated using the AM1-BCC charge model through Antechamber.
Each protein-ligand complex was centered in a cubic box, with a minimum distance of 1.0 nM between any atom of the complex and the box boundaries. The system was solvated using the SPC216 water model, and Na⁺ and Cl⁻ counterions were added to achieve electrical neutrality. Energy minimization was performed using the steepest-descent method to reduce unfavorable atomic contacts or overlaps.
A two-stage equilibration protocol was used before the production run. The NVT and NPT ensembles were each performed for 100 ps at 300 K and 1 bar, respectively. Subsequently, 100 ns production MD simulations were conducted using a 2 fs time step under periodic boundary conditions. Long-range electrostatic interactions were calculated using the Particle Mesh Ewald (PME) method with a Fourier grid spacing of 0.16 nM, and bond lengths were constrained using the LINCS algorithm.
To characterize structural behavior over the 100 ns trajectories, several metrics were calculated using GROMACS-built-in tools. Root-mean-square deviation (RMSD) and root-mean-square fluctuation (RMSF) were calculated using gmx rms and gmx rmsf, respectively27,28. The radius of gyration (Rg) was calculated using gmx gyrate, while solvent-accessible surface area (SASA) was calculated using gmx sasa29,30. Intermolecular hydrogen bonds between the protein and ligand were analyzed using gmx hbond.
Binding free energy (ΔG_bind) of the protein-ligand complexes was estimated over the selected stable portion of the trajectory using the Molecular Mechanics/Poisson-Boltzmann Surface Area (MM/PBSA) method through the gmx_mmpbsa tool31. The total binding free energy was decomposed according to the following equation:
ΔGbind = ΔEMM + ΔGsolv − TΔS
where ΔEMM denotes the gas-phase molecular mechanics energy, including electrostatic and van der Waals interactions; ΔGsolv represents the solvation free energy, comprising polar and nonpolar solvation components; and −TΔS represents the conformational entropy contribution. Visual Molecular Dynamics (VMD; version 1.9.3) and PyMOL were used to visualize and analyze the trajectories. Binding free-energy calculations were performed using gmx_mmpbsa (http://jerkwin.github.io/gmxtool).
Results
Screening the active constituents and potential targets of QUF1
Database retrieval and screening identified 85 active constituents and 374 prospective targets of QUF1. Specifically, 8 active constituents were identified in Schisandrae Chinensis Fructus (Wuweizi), 7 in Rubi Fructus (Fupenzi), 7 in Atractylodes Macrocephala Koidz (Baizhu), 9 in Ziziphi Spinosae Semen (Suanzaoren), 15 in Curcumae Radix (Yujin), 1 in Bambusae Caulis in Taeniam (Zhuru), and 38 in Ophiopogon Japonicus (Maidong). Details of the identified active constituents are provided in Table 1.
Targets associated with anxiety, depression, and PCOS
The searches for “Anxiety disorder” and “Depression” yielded 2,392 predicted targets from GeneCards, 616 from OMIM, and 40 from DrugBank. After duplicate removal, a total of 2,910 target genes were retained in the combined anxiety/depression target set. Searches for “Polycystic ovary syndrome” and “PCOS” yielded 427 targets from GeneCards and 52 from DrugBank. After removal of duplicate entries, 447 targets were retained in the PCOS-related target set.
Construction of the H-C-T network
As shown in Figure 1A, 76 intersecting genes were identified. The herb-constituent-target (H-C-T) network comprised 126 nodes, including 6 TCM nodes, 44 compound nodes, and 76 target nodes, together with 217 edges (Figure 1B). Degree represented the number of connections associated with each node and was used as a measure of network connectivity. The five active constituents with the highest reported degree values are presented in Table 2. Detailed information on the H-C-T network nodes is provided in Table 3.
PPI network
The protein-protein interaction (PPI) network constructed from the 76 intersecting targets contained 76 nodes and 1,415 edges (Figure 1C). Degree was used to prioritize highly connected nodes within the network. The five reported hub targets were albumin (ALB), RAC-alpha serine/threonine-protein kinase (AKT1), tumor necrosis factor (TNF), interleukin-6 (IL-6), and estrogen receptor 1 (ESR1), as shown in Table 4. In the MCODE cluster analysis, a score cutoff of 4.0 was used, and the three retained modules had reported scores of 36.927, 5.833, and 4.8, respectively (Table 5).
GO and KEGG analysis
Gene Ontology (GO) enrichment analysis returned 2,691 terms, including 2,404 biological process (BP) terms, 122 cellular component (CC) terms, and 165 molecular function (MF) terms. Figure 2A presents the 10 terms with the lowest reported P-values across the BP, MF, and CC categories. The listed BP terms included cellular response to chemical stimulus (GO:0070887), response to chemical (GO:0042221), response to oxygen-containing compound (GO:1901700), response to organic substance (GO:0010033), and response to lipid (GO:0033993). The listed CC terms included cytoplasmic part (GO:0044444), extracellular region (GO:0005576), extracellular region part (GO:0044421), endomembrane system (GO:0012505), and extracellular space (GO:0005615). The listed MF terms included receptor binding (GO:0005102), enzyme binding (GO:0019899), identical protein binding (GO:0042802), lipid binding (GO:0008289), and cytokine activity (GO:0005125).
A total of 143 KEGG pathway enrichment items were identified. The reported pathways included advanced glycation end product-receptor for advanced glycation end product (AGE-RAGE) signaling in diabetic complications, lipid metabolism and atherosclerosis, cancer-related pathways, hypoxia-inducible factor 1 (HIF-1) signaling, forkhead box protein O (FoxO) signaling, and phosphatidylinositol 3-kinase (PI3K)-protein kinase B (Akt) signaling. The 20 pathways with the lowest reported P values are shown in Figure 2B. These pathways, together with their associated target genes and active constituents, were visualized in a pathway-target-constituent network. As shown in Figure 2C, the network comprised 93 nodes and 386 edges. The five pathways and genes with the highest reported degree centralities are summarized in Table 6 and Table 7, respectively.
Molecular docking analysis
ALB, TNF, AKT1, IL-6, and ESR1 were selected for molecular docking with the five prioritized active constituents: ellagic acid (FPZ1), kaempferol (FPZ3), quercetin (FPZ4), naringenin (YJ1), and vitamin D3 (MD11). Docking energies below 0 were treated as computationally favorable ligand-receptor interactions, while values below −5.0 kcal/mol were interpreted as indicating comparatively stronger predicted affinity within the docking model32. As shown in Table 8, most compound-target pairs had docking energies below −5.0 kcal/mol, with ESR1-FPZ4 showing a higher reported value. Docking poses with energies below −8 kcal/mol were selected for visualization in Figure 3.
MD simulation
Molecular dynamics (MD) simulations were performed for 100 ns to characterize the structural behavior of seven representative ligand-protein systems: YJ1-ALB, FPZ1-TNF, FPZ4-ALB, FPZ3-ALB, MD11-AKT1, MD11-ALB, and MD11-ESR1.
As shown in Figure 4A, the seven complexes displayed relatively stable radius of gyration (Rg) profiles over the reported trajectories, without major abrupt changes. In Figure 4B, the MD11-AKT1 complex showed RMSD values of approximately 0.1–0.15 nM. The MD11-ESR1 system showed a gradual increase in RMSD to approximately 0.4 nM, followed by a later plateau after approximately 80 ns. The remaining complexes were generally within approximately 0.2–0.3 nm over the reported simulation period.
The RMSF profiles in Figure 4C showed generally lower fluctuations in more rigid structural regions, with larger peaks observed in selected loop regions, including regions around residues 330 and 530. These fluctuations were more pronounced in the MD11-ESR1 system. The SASA profiles shown in Figure 4D did not exhibit major discontinuous shifts over the reported trajectories. As shown in Figure 4E, intermolecular hydrogen-bond counts generally ranged from approximately 1–5 at a given time point.
The MM/PBSA binding free-energy components calculated for the seven selected complexes are summarized in Table 9. These results describe the computational behavior of the selected complexes under the reported simulation conditions and do not constitute experimental confirmation of ligand binding or therapeutic activity.
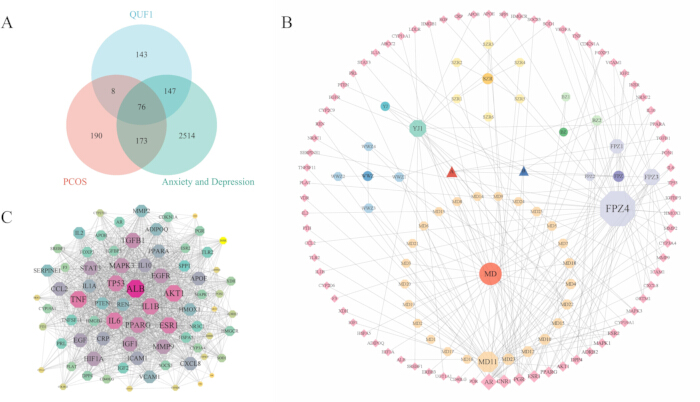
Figure 1: Identification of active constituents and target networks of Qu’s Formula 1 (QUF1) in polycystic ovary syndrome (PCOS)-related anxiety and depression. (A) Venn diagram showing the intersection of QUF1-related targets with anxiety-, depression-, and PCOS-related targets. (B) Herb-constituent-target (H-C-T) network of QUF1. WWZ, Schisandrae Chinensis Fructus (Wuweizi); FPZ, Rubi Fructus (Fupenzi); BZ, Atractylodes Macrocephala Koidz (Baizhu); SZR, Ziziphi Spinosae Semen (Suanzaoren); YJ, Curcumae Radix (Yujin); MD, Ophiopogon Japonicus (Maidong); A, beta-sitosterol; B, sitosterol. Bambusae Caulis in Taeniam (Zhuru) was not represented in the final H-C-T network because none of its 20 retrieved potential targets overlapped with the 76 disease-formula intersection targets. (C) Protein-protein interaction (PPI) network. Increasing node size and the color transition from yellow to blue to pink represent increasing degree centrality within the network. Please click here to view a larger version of this figure.
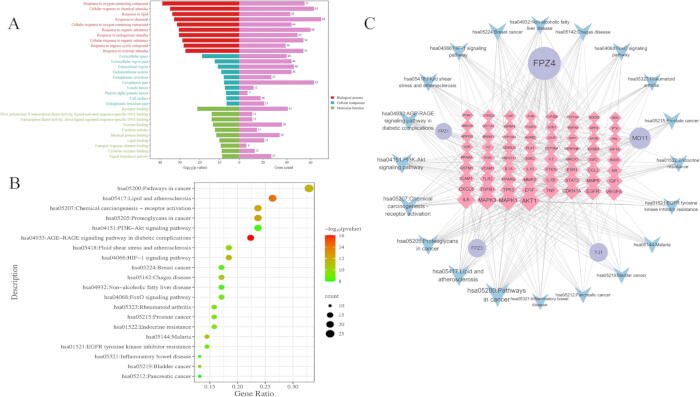
Figure 2: Functional enrichment analysis and pathway-target-constituent network of Qu’s Formula 1 (QUF1). (A) Gene Ontology (GO) enrichment analysis showing biological process, molecular function, and cellular component terms. (B) Kyoto Encyclopedia of Genes and Genomes (KEGG) enrichment bubble plot showing the top 20 pathways ranked by the reported P values. (C) Integrated network of the top 20 pathways, target genes, and active constituents associated with QUF1 in polycystic ovary syndrome (PCOS)-related anxiety and depression. Enrichment analysis used the stated threshold of P < 0.05. Please click here to view a larger version of this figure.
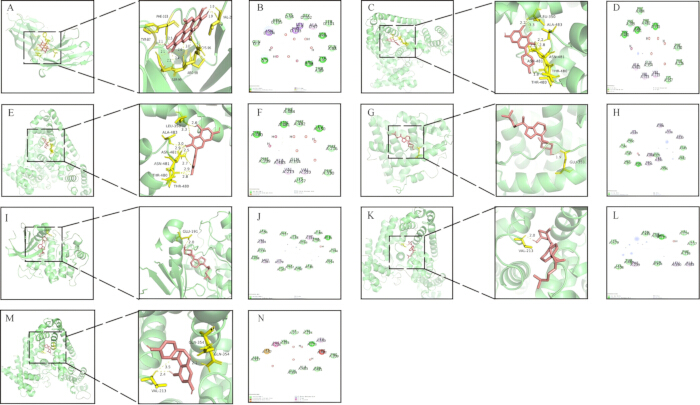
Figure 3: Molecular docking energies and docking models of core Qu’s Formula 1 (QUF1) constituents and selected targets. (A, B) Three-dimensional (3D) and two-dimensional (2D) docking models of ellagic acid and tumor necrosis factor (TNF); (C, D) 3D and 2D docking models of kaempferol and albumin (ALB); (E, F) 3D and 2D docking models of quercetin and ALB; (G, H) 3D and 2D docking models of naringenin and ALB; (I, J) 3D and 2D docking models of vitamin D3 and estrogen receptor 1 (ESR1); (K, L) 3D and 2D docking models of vitamin D3 and RAC-alpha serine/threonine-protein kinase (AKT1); and (M, N) 3D and 2D docking models of vitamin D3 and ALB. Docking energies are presented as computational scores for the selected ligand-target pairs. Please click here to view a larger version of this figure.
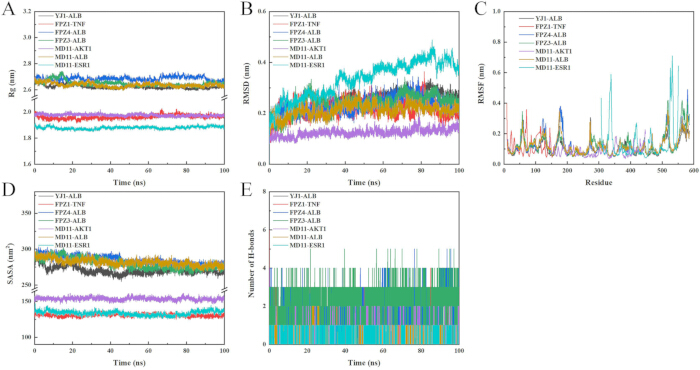
Figure 4. Molecular dynamics (MD) simulation trajectories of seven ligand-protein complexes over a 100 ns production run. (A) Time-dependent radius of gyration (Rg) profiles showing changes in structural compactness. (B) Root-mean-square deviation (RMSD) profiles of protein backbone atoms. (C) Root-mean-square fluctuation (RMSF) profiles of amino acid residues. (D) Solvent-accessible surface area (SASA) profiles of the complexes. (E) Number of intermolecular hydrogen bonds formed between ligand and receptor during the simulations. These trajectory metrics are presented descriptively for the reported simulation period. Please click here to view a larger version of this figure.
| Herbs | Active constituents |
| Schisandrae Chinensis Fructus (Wuweizi) | Longikaurin A |
| Deoxyharringtonine | |
| Angeloylgomisin O | |
| Schizandrer B | |
| Gomisin-A | |
| Gomisin G | |
| Gomisin R | |
| Wuweizisu C | |
| Rubi Fructus (Fupenzi) | Ellagic acid |
| Ammidin | |
| Beta-sitosterol | |
| Sitosterol | |
| Kaempferol | |
| Quercetin | |
| (1R,2R,4aS,6aS,6aR,6bR,8aR,12aR,14bS)-1,11-dihydroxy-1,2,6a,6b,9,9,12a-heptamethyl-10-oxo-3,4,5,6,6a,7,8,8a,13,14b-decahydro-2H-picene-4a-carboxylic acid | |
| Atractylodes Macrocephala Koidz (Baizhu) | 12-senecioyl-2E,8E,10E-atractylentriol |
| 14-acetyl-12-senecioyl-2E,8E,10E-atractylentriol | |
| 14-acetyl-12-senecioyl-2E,8Z,10E-atractylentriol | |
| α-Amyrin | |
| 3β-acetoxyatractylone | |
| 8β-ethoxy atractylenolide | |
| (3S,8S,9S,10R,13R,14S,17R)-10,13-dimethyl-17-[(2R,5S)-5-propan-2-yloctan-2-yl]-2,3,4,7,8,9,11,12,14,15,16,17-dodecahydro-1H-cyclopenta[a]phenanthren-3-ol | |
| Ziziphi Spinosae Semen (Suanzaoren) | Ceanothic acid |
| (S)-Coclaurine | |
| Daucosterol | |
| Jujuboside A_qt | |
| Phytosterol | |
| Sanjoinenine | |
| Swertisin | |
| Zizyphusine | |
| Mairin | |
| Curcumae Radix (Yujin) | Beta-sitosterol |
| Sitosterol | |
| Curcolactone | |
| (4aR,5R,8R,8aR)-5,8-dihydroxy-3,5,8a-trimethyl-6,7,8,9-tetrahydro-4aH-benzo[f]benzofuran-4-on | |
| Curcumenolactone C | |
| (E)-1,7-Diphenyl-3-hydroxy-1-hepten-5-one | |
| (E)-5-Hydroxy-7-(4-hydroxyphenyl)-1-phenyl-1-heptene | |
| Oxycurcumenol | |
| Zedoalactone A | |
| Zedoalactone B | |
| Zedoalactone E | |
| Zedoarolide A | |
| Zedoarolide B | |
| 1,7-Diphenyl-3-acetoxy-6(E)-hepten | |
| Naringenin | |
| Caulis Bambusae In Taeniam (Zhuru) | 4-Hydroxybenzaldehyde |
| Ophiopogon Japonicus (Maidong) | 6-Hydroxycoumarin |
| Methylophiopogonanone A | |
| Ophiopogonanone E | |
| (3R)-5,7-Dihydroxy-3-[(4-Hydroxy-3-Methoxyphenyl)Methyl]-6,8-Dimethyl-2,3-Dihydrochromen-4-One | |
| (2R,3S,4S,5R,6R)-2-[[(2R,3R,4R)-3,4-Dihydroxy-4-(Hydroxymethyl)Oxolan-2-Yl]Oxymethyl]-6-[[(2R)-1,7,7-Trimethyl-2-Bicyclo[2.2.1]Heptanyl]Oxy]Oxane-3,4,5-Triol | |
| Ophiopogonoside A | |
| 2-Amino-9-[(2R,3R,4S,5R)-3,4-Dihydroxy-5-(Hydroxymethyl)Oxolan-2-Yl]-3H-Purin-6-One | |
| (1S,2S,4S,6R,8S,9S,12R,13R)-5',7,9,13-Tetramethylspiro[5-Oxapentacyclo[10.8.0.02,9.04,8.013,18]Icos-18-Ene-6,2'-Oxane]-16-Ol | |
| 5,7-Dihydroxy-6,8-Dimethyl-3-(4'-Hydroxy-3'-Methoxybenzyl)Chroman-4-One | |
| (3R)-5,7-Dihydroxy-3-[(2-Hydroxy-4-Methoxyphenyl)Methyl]-8-Methoxy-6-Methyl-2,3-Dihydrochromen-4-One | |
| 5,7-Dihydroxy-3-[(4-Methoxyphenyl)Methyl]-6,8-Dimethyl-2,3-Dihydrochromen-4-One | |
| 2,3-Dihydro-3-(4-Methoxybenzyl)-5,7-Dihydroxy-6-Methyl-4H-1-Benzopyran-4-One | |
| (1S,2R,4S)-Borneol Beta-D-Glucopyranoside | |
| (2R,3S,4R,5R)-5-(2-Amino-6-Oxo-3H-Purin-9-Yl)-3,4-Dihydroxyoxolan-2-Yl]Methyl Dihydrogen Phosphate | |
| STIGMASTEROL | |
| Ophiopogonanone B | |
| Adenosine | |
| Ophiopogonanone F | |
| Oleanolic Acid | |
| Vitamin D3 | |
| 1-Hydroxy-2,3-Dimethylanthracene-9,10-Dione | |
| Guanosine | |
| Uridine | |
| (Z,S)-Jasmololone | |
| Cyperene | |
| Orchinol | |
| Uridine 5'-Monophosphate | |
| QSPL 173 | |
| LONGIFOLENE | |
| Jasmolone | |
| Beta-Patchoulene | |
| CHEMBL1094912 | |
| Methylophiopogonanone B | |
| Ophiopogonin D | |
| SCHEMBL1876845 | |
| 3-Hydroxy-Vitamin K | |
| N-Trans-Feruloyltyramine | |
| 514-51-2 |
Table 1: Active constituents identified in Qu’s Formula 1. Active constituents identified from the seven herbal components of Qu’s Formula 1 (QUF1) using the specified database-screening criteria. Constituents are grouped according to their herbal source.
| ID | Ingredients | Degree | Drug |
| FPZ4 | Quercetin | 46 | Rubi fructus (Fupenzi) |
| MD11 | Vitamin D3 | 21 | Ophiopogon japonicus (Maidong) |
| YJ1 | Naringenin | 15 | Curcumae radix (Yujin) |
| FPZ3 | Kaempferol | 14 | Rubi fructus (Fupenzi) |
| FPZ1 | Ellagic acid | 11 | Rubi fructus (Fupenzi) |
Table 2: Five active constituents with the highest degree values in the herb-constituent-target network. The five prioritized QUF1 constituents ranked by degree centrality in the herb-constituent-target network. Degree represents the number of network connections associated with each constituent node. FPZ4, quercetin; MD11, vitamin D3; YJ1, naringenin; FPZ3, kaempferol; FPZ1, ellagic acid.
| Node | MOL ID | Molecular name | OB | DL | Origin |
| WWZ1 | MOL005317 | Deoxyharringtonine | 39.27 | 0.81 | Schisandrae Chinensis Fructus (Wuweizi) |
| WWZ2 | MOL008956 | Angeloylgomisin O | 31.97 | 0.85 | |
| WWZ3 | MOL008978 | Gomisin R | 34.84 | 0.86 | |
| WWZ4 | MOL008992 | Wuweizisu C | 46.27 | 0.84 | |
| FPZ1 | MOL001002 | ellagic acid | 43.06 | 0.43 | Rubi Fructus (Fupenzi) |
| FPZ2 | MOL001941 | Ammidin | 34.55 | 0.22 | |
| FPZ3 | MOL000422 | kaempferol | 41.88 | 0.24 | |
| FPZ4 | MOL000098 | quercetin | 46.43 | 0.28 | |
| BZ1 | MOL000033 | (3S,8S,9S,10R,13R,14S,17R)-10,13-dimethyl-17-[(2R,5S)-5-propan-2-yloctan-2-yl]-2,3,4,7,8,9,11,12,14,15,16,17-dodecahydro-1H-cyclopenta[a]phenanthren-3-ol | 36.23 | 0.78 | Atractylodes Macrocephala Koidz(Baizhu) |
| BZ2 | MOL000049 | 3β-acetoxyatractylone | 54.07 | 0.22 | |
| SZR1 | MOL001522 | (S)-Coclaurine | 42.35 | 0.24 | Ziziphi Spinosae Semen (Suanzaoren) |
| SZR2 | MOL001525 | Daucosterol | 36.91 | 0.75 | |
| SZR3 | MOL001532 | phytosterol | 36.91 | 0.75 | |
| SZR4 | MOL001542 | swertisin | 31.83 | 0.75 | |
| SZR5 | MOL001546 | zizyphusine | 41.53 | 0.55 | |
| SZR6 | MOL000211 | Mairin | 55.38 | 0.78 | |
| YJ1 | MOL004328 | naringenin | 59.25 | 0.21 | Curcumae Radix (Yujin) |
| MD1 | - | Methylophiopogonanone A | - | - | Ophiopogon Japonicus (Maidong) |
| MD2 | - | Ophiopogonanone E | - | - | |
| MD3 | - | (3R)-5,7-Dihydroxy-3-[(4-Hydroxy-3-Methoxyphenyl)Methyl]-6,8-Dimethyl-2,3-Dihydrochromen-4-One | - | - | |
| MD4 | - | 3-Hydroxy-Vitamin K | - | - | |
| MD5 | - | STIGMASTEROL | - | - | |
| MD6 | - | OphiopogonanoneB | - | - | |
| MD7 | - | (1S,2S,4S,6R,8S,9S,12R,13R)-5',7,9,13-Tetramethylspiro[5-Oxapentacyclo[10.8.0.02,9.04,8.013,18]Icos-18-Ene-6,2'-Oxane]-16-Ol | - | - | |
| MD8 | - | 5,7-Dihydroxy-6,8-Dimethyl-3-(4'-Hydroxy-3'-Methoxybenzyl)Chroman-4-One | - | - | |
| MD9 | - | (3R)-5,7-Dihydroxy-3-[(2-Hydroxy-4-Methoxyphenyl)Methyl]-8-Methoxy-6-Methyl-2,3-Dihydrochromen-4-One | - | - | |
| MD10 | - | Oleanolic Acid | - | - | |
| MD11 | - | Vitamin D3 | - | - | |
| MD12 | - | 1-Hydroxy-2,3-Dimethylanthracene-9,10-Dione | - | - | |
| MD13 | - | 5,7-Dihydroxy-3-[(4-Methoxyphenyl)Methyl]-6,8-Dimethyl-2,3-Dihydrochromen-4-One | - | - | |
| MD14 | - | Uridine | - | - | |
| MD15 | - | (Z,S)-Jasmololone | - | - | |
| MD16 | - | Orchinol | - | - | |
| MD17 | - | Uridine5'-Monophosphate | - | - | |
| MD18 | - | Jasmolone | - | - | |
| MD19 | - | CHEMBL1094912 | - | - | |
| MD20 | - | 2,3-Dihydro-3-(4-Methoxybenzyl)-5,7-Dihydroxy-6-Methyl-4H-1-Benzopyran-4-One- | - | - | |
| MD21 | - | Methylophiopogonanone B | - | - | |
| MD22 | - | Ophiopogonin D | - | - | |
| MD23 | - | [(2R,3S,4R,5R)-5-(2-Amino-6-Oxo-3H-Purin-9-Yl)-3,4-Dihydroxyoxolan-2-Yl]MethylDihydrogenPhosphate | - | - | |
| MD24 | - | Adenosine | - | - | |
| MD25 | - | Ophiopogonanone F | - | - | |
| A | MOL000358 | beta-sitosterol | 36.91 | 0.75 | Rubi Fructus (Fupenzi) Curcumae Radix (Yujin) |
| B | MOL000359 | sitosterol | 36.91 | 0.75 |
Table 3: Nodes included in the herb-constituent-target network of Qu’s Formula 1. Active constituent nodes included in the herb-constituent-target network, with corresponding molecular identifiers, molecular names, oral bioavailability (OB), drug-likeness (DL), and herbal origin where available. For Ophiopogon Japonicus (Maidong), constituents not retrieved from the Traditional Chinese Medicine Systems Pharmacology Database (TCMSP) were obtained from the A Bioinformatics Annotation Database for Molecular Mechanism of Traditional Chinese Medicine (BATMAN-TCM); MOL ID, OB, and DL values were unavailable for those entries.
| Target gene | Degree | CC | BC |
| ALB | 71 | 0.949 | 0.053 |
| AKT1 | 65 | 0.882 | 0.022 |
| TNF | 65 | 0.882 | 0.021 |
| IL6 | 64 | 0.872 | 0.017 |
| ESR1 | 63 | 0.862 | 0.041 |
Table 4: Five prioritized targets in the protein-protein interaction network associated with Qu’s Formula 1 and PCOS-related anxiety and depression. The five hub targets prioritized from the protein-protein interaction network according to the reported network-topology metrics. Degree represents the number of network connections associated with each target. CC, closeness centrality; BC, betweenness centrality; ALB, albumin; AKT1, RAC-alpha serine/threonine-protein kinase; TNF, tumor necrosis factor; IL-6, interleukin-6; ESR1, estrogen receptor 1.
| No. | Module | Gene | MCODE Score | Nodes | Edges |
| 1 | 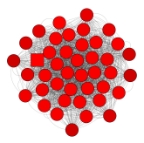 | ESR1, CXCL8, FOXP3, HIF1A, IL2, CCL2, PTEN, IL6, VCAM1, SERPINE1, CD40LG, PPARA, PPARG, CDKN1A, TGFB1, REN, EGFR, TNFSF11, HMOX1, TP53, ADIPOQ, ICAM1, HMGB1, EGF, SPP1, STAT3, IGF1, IL1B, DPP4, IL1A, MMP9, PLAT, MAPK3, TNF, MMP2, TLR2, ALB, IL10, CRP, AKT1, SOCS3, APOE | 36.927 | 42 | 757 |
| 2 | 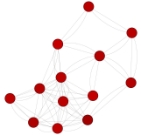 | CYP19A1, NR3C1, APOB, AR, F3, PRL, IGFBP3, IGF2, PGR, HSPA5, ESR2, HMGCR, MAPK1 | 5.833 | 13 | 35 |
| 3 | 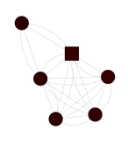 | ABCC2, UGT1A1, CYP2C9, POR, CYP2D6, GSTM1 | 4.8 | 6 | 12 |
Table 5: MCODE modules identified in the protein-protein interaction network of common targets. Subnetwork modules identified using the Molecular Complex Detection (MCODE) algorithm in the protein-protein interaction network of common targets associated with Qu’s Formula 1 and PCOS-related anxiety and depression. The table reports the genes included in each module, the corresponding MCODE score, and the numbers of nodes and edges.
| KEGG pathway term | P-value | Degree | CC | BC |
| hsa05200: Pathways in cancer | 2.86E-12 | 25 | 0.455 | 0.059 |
| hsa05417: Lipid and atherosclerosis | 6.14E-15 | 20 | 0.434 | 0.080 |
| hsa04151: PI3K-Akt signaling pathway | 4.14E-09 | 18 | 0.426 | 0.038 |
| hsa05207: Chemical carcinogenesis-receptor activation | 1.02E-12 | 18 | 0.422 | 0.060 |
| hsa05205: Proteoglycans in cancer | 5.86E-13 | 18 | 0.426 | 0.028 |
Table 6: Five KEGG pathways with the highest degree values in the pathway-target-constituent network. The five Kyoto Encyclopedia of Genes and Genomes (KEGG) pathways with the highest reported degree values in the pathway-target-constituent network associated with Qu’s Formula 1 and PCOS-related anxiety and depression. The table includes the reported P value and network-topology metrics for each pathway. CC, closeness centrality; BC, betweenness centrality.
| Target gene | Degree | CC | BC |
| AKT1 | 20 | 0.544 | 0.084 |
| MAPK1 | 18 | 0.526 | 0.058 |
| MAPK3 | 17 | 0.497 | 0.045 |
| IL-6 | 14 | 0.487 | 0.037 |
| EGFR | 13 | 0.444 | 0.016 |
Table 7: Five targets with the highest degree values in the pathway-target-constituent network. The five target genes with the highest reported degree values in the pathway-target-constituent network associated with Qu’s Formula 1 and PCOS-related anxiety and depression. Degree represents the number of network connections associated with each target. CC, closeness centrality; BC, betweenness centrality.
| Resolution | FPZ1 | FPZ3 | FPZ4 | YJ1 | MD11 | |
| IL-6 (PDB ID: 1ALU) | 2.50Å | -5.7 | -5.73 | -6.61 | -5.83 | -7.46 |
| ESR1 (PDB ID: 1XP6) | 1.70Å | -7.92 | -7.06 | -3.17 | -7.31 | -8.8 |
| AKT1(PDB ID: 3CQW) | 2.00Å | -6.67 | -6.53 | -6.47 | -6.65 | -8.86 |
| TNF (PDB ID: 5M2J) | 2.70Å | -8.44 | -7.51 | -7.9 | -6.87 | -7.88 |
| ALB (PDB ID: 6FAK) | 1.90Å | -5.85 | -8.04 | -8.15 | -8 | -10.62 |
Table 8: Molecular docking energies of core Qu’s Formula 1 constituents and selected protein targets. Predicted molecular docking energies for the selected QUF1 constituents and protein targets. Lower docking-energy values indicate comparatively more favorable predicted interactions within the docking model. Energies are reported in kcal/mol. FPZ1, ellagic acid; FPZ3, kaempferol; FPZ4, quercetin; YJ1, naringenin; MD11, vitamin D3; IL-6, interleukin-6; ESR1, estrogen receptor 1; AKT1, RAC-alpha serine/threonine-protein kinase; TNF, tumor necrosis factor; ALB, albumin.
| Energy | YJ1-ALB | FPZ1-TNF | FPZ4-ALB | FPZ3-ALB | MD11-AKT1 | MD11-ALB | MD11-ESR1 |
| Van der Waals Energy (kJ/mol) | -131.168 | -3.301 | -120.207 | -120.127 | -181.749 | -144.661 | -197.843 |
| Electrostatic energy (kJ/mol) | -43.279 | -1.742 | -64.3 | -66.954 | -31.231 | -6.823 | -23.582 |
| Polar solvation energy (kJ/mol) | 146.684 | 5.222 | 159.115 | 153.399 | 100.079 | 70.781 | 136.044 |
| Nonpolar solvation Energy (kJ/mol) | -18.66 | -4.502 | -18.344 | -18.22 | -25.367 | -19.179 | -23.463 |
| Total Binding Energy (kJ/mol) | -46.423 | -4.323 | -43.736 | -51.902 | -138.267 | -99.882 | -108.844 |
Table 9: MM/PBSA binding free-energy components for selected ligand-protein complexes. Molecular Mechanics/Poisson-Boltzmann Surface Area (MM/PBSA) energy components calculated for the seven selected ligand-protein complexes. Reported components include van der Waals energy, electrostatic energy, polar solvation energy, nonpolar solvation energy, and total binding energy. All values are reported in kJ/mol.
Data Availability:
The raw computational data supporting the analyses reported in this study are provided as Supplementary File 1 with the submission. These materials include the constituent and target datasets, intersecting-gene and network files, enrichment-analysis outputs, representative docking files, and molecular dynamics analysis outputs.
Supplementary File 1: Raw computational data supporting the network pharmacology, molecular docking, and molecular dynamics analyses. This supplementary archive contains the underlying computational datasets and analysis outputs used in the study, including QUF1 constituent and target files, anxiety/depression and PCOS target datasets, intersecting-gene and network files, MCODE and STRING outputs, Gene Ontology and KEGG enrichment files, pathway-network files, representative PDBQT docking structures, MM/PBSA output, and molecular dynamics analysis files for RMSD, RMSF, radius of gyration, and solvent-accessible surface area. Please click here to download this file.
Discussion
The pathophysiology of polycystic ovary syndrome (PCOS) is multifactorial and can affect several dimensions of health, including mental health. Anxiety and depression in patients with PCOS are likely to have multiple contributing factors, and PCOS has been associated with a higher prevalence of psychiatric disorders33. International guidelines emphasize screening for depression at the time of PCOS diagnosis, reflecting increasing recognition of this clinical concern34. Antidepressants are commonly used for anxiety, depression, and related mood disorders; reported adverse effects include thirst, nausea, hypotension, lethargy, sexual dysfunction, weight gain, and amenorrhea35.
Ellagic acid has been reported to exhibit antioxidant, neuroprotective, anti-inflammatory, and anxiolytic properties36. In sleep-deprived mice, ellagic acid has been associated with improvements in anxiety and memory impairment alongside attenuation of inflammatory responses and oxidative stress37. Kaempferol and quercetin are flavonoid compounds with reported antioxidant and anti-inflammatory activities involving several pro-inflammatory signaling pathways38. In vitro studies have also reported effects of quercetin on mitochondrial function and neuroinflammation39. Naringenin has been investigated in relation to oxidative stress and inflammatory mediators in models of anxiety- and depression-like behavior40. Vitamin D has an established role in immune regulation, and clinical studies have reported associations between low vitamin D levels and depression and anxiety41. Vitamin D has also been discussed as a potential neuroimmune modulator in depression42.
The protein-protein interaction (PPI) network prioritized ALB, TNF, IL-6, AKT1, and ESR1 as highly connected candidate targets. Previous studies have associated ALB with PCOS-related protein-interaction networks and with candidate therapeutic targets in PCOS43,44. Inflammatory processes have also been associated with anxiety, depression, and PCOS45,46,47, providing biological context for the inflammation-related targets identified in the present network analysis. IL-6 has been linked to indoleamine 2,3-dioxygenase activity, altered tryptophan metabolism, and depressive symptoms48, and higher IL-6 levels have been associated with greater depression severity49. Peripheral TNF-α signaling has been investigated in relation to anxiety- and depression-like behaviors in mice50. AKT1 has been associated with susceptibility to bipolar disorder51, and experimental studies have linked AKT1-related signaling with oxidative stress and neuroprotective pathways52. Estrogen signaling influences neurotransmitter systems53, and ESR1 polymorphisms have been associated with anxiety or depressive symptoms54,55,56. Collectively, these observations provide context for the identified targets but do not establish direct modulation of these targets by QUF157.
Kyoto Encyclopedia of Genes and Genomes (KEGG) analysis identified pathways including cancer-related pathways, lipid and atherosclerosis pathways, PI3K-Akt signaling, chemical carcinogenesis-receptor activation, proteoglycans in cancer, HIF-1 signaling, and FoxO signaling. HIF-1 signaling has been studied in neuropsychiatric contexts and in relation to responses to hypoxic conditions58. FoxO is a downstream substrate of Akt, and PI3K/Akt signaling has an established role in neuronal survival59. FoxO proteins are expressed in brain regions including the hippocampus, amygdala, and nucleus accumbens60, and the PI3K/AKT1/FOXO1 pathway has been investigated in relation to PCOS and depression-like behavior61. FoxO signaling has also been linked with serotonin and norepinephrine receptor pathways and the hypothalamic-pituitary-adrenal axis62. Within the pathway-target-constituent network, MAPK1, MAPK3, and EGFR were among the highly connected targets. EGFR/MAPK signaling has been studied in folliculogenesis, oocyte maturation, and granulosa-cell function63,64, as well as in neuroplasticity and emotional processing65. MAPK1 and MAPK3 have also been investigated in anxiety-like behavior and social stress responses66, while anxiety-related microRNA changes have been reported to converge on MAPK signaling pathways67. These associations support the biological plausibility of the computationally prioritized pathways without establishing a causal therapeutic mechanism.
Several limitations constrain the interpretation of the present findings. The analyses are derived from computational databases and therefore provide hypothesis-generating evidence rather than experimental proof. Direct modulation of targets and changes in expression require confirmation in cellular and animal models. Molecular docking and molecular dynamics simulations do not fully account for in vivo pharmacokinetic constraints, including tissue exposure and blood-brain barrier permeability, and the reported simulations did not include multi-replica dynamics with explicit entropy calculations. Disease targets derived from public databases also lack tissue-specific filtering, and topological network metrics prioritize graph connectivity rather than direct biological essentiality. Future studies may incorporate medicated serum analysis, tissue-specific transcriptomic datasets, and wet-lab validation to further evaluate these computational hypotheses.
Overall, the analysis generated a computational hypothesis regarding potential target interactions of QUF1 in PCOS-related anxiety and depression. Ellagic acid, kaempferol, quercetin, naringenin, and vitamin D3 were prioritized as candidate active constituents associated with hub targets including ALB, AKT1, TNF, IL-6, and ESR1. The predicted relationships emphasize pathways associated with inflammatory regulation and provide a framework for subsequent experimental and pharmacokinetic validation.
Disclosures
The authors declare no competing interests. The authors declare that no generative AI or AI-assisted technologies were used to generate or analyze any scientific data, results, or figures in this manuscript.
Author Contributions:
Chang Liu contributed to the conceptualization of the study, data curation, and preparation of the original manuscript draft. Weihuan Hu contributed to the methodology, data curation, and preparation of the original manuscript draft. Jue Zhou contributed to software implementation, validation, and visualization. Fangfang Wang contributed to software implementation and visualization. Runju Zhang contributed to the study conceptualization, supervision, and review and editing of the manuscript. Fan Qu contributed to the study conceptualization, supervision, and review and editing of the manuscript. All authors read and approved the final manuscript.
Acknowledgements
This work was financially supported by the National Natural Science Foundation of China (Grant Nos. 82274564 and 82575119). There are no additional acknowledgments to report.
Materials
| Name | Company | Catalog Number | Comments |
|---|---|---|---|
| A Bioinformatics Annotation Database for Molecular Mechanism of Traditional Chinese Medicine (BATMAN-TCM) | BATMAN-TCM | Version 2.0; http://bionet.ncpsb.org.cn/batman-tcm/ | Online database used to identify and screen herbal constituents and associated targets; accessed November 2025. |
| AutoDockTools | The Scripps Research Institute | Version 1.5.7; https://autodock.scripps.edu/ | Software used for preparation of protein and ligand structures for molecular docking. |
| Bioinformatics.com.cn visualization platform | Bioinformatics.com.cn | http://www.bioinformatics.com.cn/ | Online platform used for target-set and enrichment-result visualization. |
| Cytoscape | Cytoscape Consortium | Version 3.7.2; https://cytoscape.org/ | Software used for construction, analysis, and visualization of molecular interaction networks. |
| DAVID | National Institutes of Health | https://david.ncifcrf.gov/home.jsp | Database used for Gene Ontology and KEGG pathway enrichment analyses; accessed November 2025. |
| DrugBank | DrugBank | https://www.drugbank.ca/ | Database used to retrieve disease-related targets; accessed November 2025. |
| GeneCards | GeneCards | Version 5.26; https://www.genecards.org/ | Database used to retrieve disease-related targets; accessed November 2025. |
| gmx_MMPBSA | Open-source software | http://jerkwin.github.io/gmxtool | Tool used for MM/PBSA binding free-energy calculations. |
| GROMACS | GROMACS Development Team | Version 2020.3; https://www.gromacs.org/ | Software used for molecular dynamics simulations. |
| Online Mendelian Inheritance in Man (OMIM) | Johns Hopkins University | Version 5.1.10; https://www.omim.org/ | Database used to retrieve disease-related targets; accessed November 2025. |
| Protein Data Bank (PDB) | RCSB Protein Data Bank | https://www.rcsb.org/ | Source of target protein crystal structures. |
| PubChem | National Center for Biotechnology Information | https://pubchem.ncbi.nlm.nih.gov/ | Used to obtain standard SMILES strings for active compounds. |
| PyMOL | Schrödinger | Version 2.4.1; https://pymol.org/ | Software used for protein preparation and molecular-structure visualization. |
| Science Data Bank | Chinese Academy of Sciences, Computer Network Information Center | https://www.scidb.cn/ | Scientific data repository for data availability and deposition |
| STRING | STRING Consortium | Version 12.0; https://string-db.org/ | Database used to construct the protein-protein interaction network; accessed November 2025. |
| SwissADME | SwissADME | http://www.swissadme.ch/ | Web tool used for in silico ADMET prediction. |
| Traditional Chinese Medicine Systems Pharmacology Database and Analysis Platform (TCMSP) | TCMSP | https://www.tcmsp-e.com/tcmsp.php | Online database used to identify and screen active herbal constituents and associated targets; accessed November 2025. |
| UniProtKB | UniProt Consortium | Release 2025_04; https://www.uniprot.org/uniprotkb | Used to standardize protein names and convert them to official gene names; restricted to Homo sapiens. |
| Visual Molecular Dynamics (VMD) | University of Illinois Urbana-Champaign | Version 1.9.3; https://www.ks.uiuc.edu/Research/vmd/ | Software used to visualize and analyze molecular dynamics trajectories. |
References
- Sangaraju SL et al. Cardio-Metabolic Disease and Polycystic Ovarian Syndrome (PCOS): A Narrative Review. Cureus. 2022;14(5):e25076. doi:10.7759/cureus.25076.
- Bozdag G et al. The prevalence and phenotypic features of polycystic ovary syndrome: a systematic review and meta-analysis. Hum Reprod. 2016;31(12):2841–55.
- Lizneva D et al. Criteria, prevalence, and phenotypes of polycystic ovary syndrome. Fertil Steril. 2016;106(1):6–15.
- Sidra S, Tariq MH, Farrukh MJ, Mohsin M. Evaluation of clinical manifestations, health risks, and quality of life among women with polycystic ovary syndrome. PLoS One. 2019;14(10):e0223329. doi:10.1371/journal.pone.0223329.
- Hong Z et al. Prevalence of depression among women with polycystic ovary syndrome in mainland China: a systematic review and meta-analysis. BMC Psychiatry. 2024;24(1):920. doi:10.1186/s12888-024-06378-8.
- Kogure GS et al. Body image and its relationships with sexual functioning, anxiety, and depression in women with polycystic ovary syndrome. J Affect Disord. 2019;253:385–93.
- de Wit AE et al. Plasma androgens and the presence and course of depression in a large cohort of women. Transl Psychiatry. 2021;11(1):124. doi:10.1038/s41398-021-01249-2.
- Cheng F et al. Biologic basis of TCM syndromes and the standardization of syndrome classification. Journal of Traditional Chinese Medical Sciences. 2014;1(2):92–97.
- Li XJ et al. A combination of depression and liver Qi stagnation and spleen deficiency syndrome using a rat model. Anat Rec (Hoboken). 2020;303(8):2154–67.
- Chen M, Li W, Chen H. Research progress of anxiety and depression in patients with polycystic ovary syndrome. Practical Internal Medicine of Traditional Chinese Medicine. 2024;38(1):9–12.
- Zhang H et al. Acupuncture ameliorates negative emotion in PCOS patients: a randomized controlled trial. Zhongguo Zhen Jiu. 2020;40(4):385–90.
- Ru J et al. TCMSP: a database of systems pharmacology for drug discovery from herbal medicines. J Cheminform. 2014;6:13. doi:10.1186/1758-2946-6-13.
- Liu Z et al. BATMAN-TCM: a Bioinformatics Analysis Tool for Molecular Mechanism of Traditional Chinese Medicine. Sci Rep. 2016;6:21146. doi:10.1038/srep21146.
- Xiong WC et al. Network Pharmacology-based Research of Active Components of Albiziae Flos and Mechanisms of Its Antidepressant Effect. Curr Med Sci. 2020;40(1):123–29.
- Li B et al. Systems pharmacology-based approach for dissecting the addition and subtraction theory of traditional Chinese medicine: An example using Xiao-Chaihu-Decoction and Da-Chaihu-Decoction. Comput Biol Med. 2014;53:19–29.
- UniProt C. UniProt: a worldwide hub of protein knowledge. Nucleic Acids Res. 2019;47(D1):D506–D15.
- Stelzer G et al. The GeneCards Suite: From Gene Data Mining to Disease Genome Sequence Analyses. Curr Protoc Bioinformatics. 2016;54:1.30.1–1.30.33.
- Amberger JS et al. OMIM.org: Online Mendelian Inheritance in Man (OMIM(R)), an online catalog of human genes and genetic disorders. Nucleic Acids Res. 2015;43(Database issue):D789–98.
- Knox C et al. DrugBank 6.0: the DrugBank Knowledgebase for 2024. Nucleic Acids Res. 2024;52(D1):D1265–D75.
- Shannon P et al. Cytoscape: a software environment for integrated models of biomolecular interaction networks. Genome Res. 2003;13(11):2498–504.
- Szklarczyk D et al. The STRING database in 2017: quality-controlled protein-protein association networks, made broadly accessible. Nucleic Acids Res. 2017;45(D1):D362–D68.
- Dennis G Jr et al. DAVID: Database for Annotation, Visualization, and Integrated Discovery. Genome Biol. 2003;4(5):P3. doi:10.1186/gb-2003-4-5-p3.
- Burley SK et al. Protein Data Bank (PDB): The Single Global Macromolecular Structure Archive. Methods Mol Biol. 2017;1607:627–41.
- Seeliger D, de Groot BL. Ligand docking and binding site analysis with PyMOL and Autodock/Vina. J Comput Aided Mol Des. 2010;24(5):417–22.
- Morris GM et al. AutoDock4 and AutoDockTools4: Automated docking with selective receptor flexibility. J Comput Chem. 2009;30(16):2785–91.
- Lemkul JA. Introductory Tutorials for Simulating Protein Dynamics with GROMACS. J Phys Chem B. 2024;128(39):9418–35.
- Sargsyan K, Grauffel C, Lim C. How Molecular Size Impacts RMSD Applications in Molecular Dynamics Simulations. J Chem Theory Comput. 2017;13(4):1518–24.
- Pitera JW. Expected distributions of root-mean-square positional deviations in proteins. J Phys Chem B. 2014;118(24):6526–30.
- Yanao T, Koon WS, Marsden JE, Kevrekidis IG. Gyration-radius dynamics in structural transitions of atomic clusters. J Chem Phys. 2007;126(12):124102. doi:10.1063/1.2710272.
- Raghunathan S. Solvent accessible surface area-assessed molecular basis of osmolyte-induced protein stability. RSC Adv. 2024;14(34):25031–41.
- Homeyer N, Gohlke H. Free Energy Calculations by the Molecular Mechanics Poisson-Boltzmann Surface Area Method. Mol Inform. 2012;31(2):114–22.
- Liu C, Hu W, Feng X, Qu F. Network pharmacology analysis of a patented Chinese herbal medicine for alleviating anxiety disorder in in vitro fertilization-embryo transfer. Journal of Traditional and Complementary Medicine. 2024;14(2):191–202.
- Zehravi M, Maqbool M, Ara I. Depression and anxiety in women with polycystic ovarian syndrome: a literature survey. Int J Adolesc Med Health. 2021;33(6):367–73.
- Teede HJ et al. Recommendations From the 2023 International Evidence-based Guideline for the Assessment and Management of Polycystic Ovary Syndrome. J Clin Endocrinol Metab. 2023;108(10):2447–69.
- McElroy SL et al. Role of antiepileptic drugs in the management of eating disorders. CNS Drugs. 2009;23(2):139–56.
- Zhu H, Yan Y, Jiang Y, Meng X. Ellagic Acid and Its Anti-Aging Effects on Central Nervous System. Int J Mol Sci. 2022;23(18):10937. doi:10.3390/ijms231810937.
- Wang W et al. Ellagic acid protects mice against sleep deprivation-induced memory impairment and anxiety by inhibiting TLR4 and activating Nrf2. Aging (Albany NY). 2020;12(11):10457–72.
- Silva Dos Santos J, Gonçalves Cirino JP, de Oliveira Carvalho P, Ortega MM. The Pharmacological Action of Kaempferol in Central Nervous System Diseases: A Review. Front Pharmacol. 2020;11:565700. doi:10.3389/fphar.2020.565700.
- Chen F et al. Quercetin Mitigates Methamphetamine-Induced Anxiety-Like Behavior Through Ameliorating Mitochondrial Dysfunction and Neuroinflammation. Front Mol Neurosci. 2022;15:829886. doi:10.3389/fnmol.2022.829886.
- Sadeghi Nejad Z et al. Naringenin mitigates reserpine-induced anxiety-like behavior, neurodegeneration, and oxidative stress in male rats. Neurosci Behav Physiol. 2023:1–7.
- Casseb GAS, Kaster MP, Rodrigues ALS. Potential Role of Vitamin D for the Management of Depression and Anxiety. CNS Drugs. 2019;33(7):619–37.
- Menon V, Kar SK, Suthar N, Nebhinani N. Vitamin D and Depression: A Critical Appraisal of the Evidence and Future Directions. Indian J Psychol Med. 2020;42(1):11–21.
- Chen Q, Zheng B, Du S, Lin Y. Explore the potential molecular mechanism of polycystic ovarian syndrome by protein-protein interaction network analysis. Taiwan J Obstet Gynecol. 2021;60(5):807–15.
- Yang W et al. Effect of Rhei Radix Et Rhizome on treatment of polycystic ovary syndrome by regulating PI3K/AKT pathway and targeting EGFR/ALB in rats. J Ethnopharmacol. 2025;338(Pt 1):119020. doi:10.1016/j.jep.2024.119020.
- Zhong P, Guan B, Lin Y, Zhang S. Changes in inflammatory factors, oxidative stress, glucose and lipid metabolism, and insulin resistance in patients with polycystic ovary syndrome. Cell Mol Biol (Noisy-le-grand). 2022;67(5):45–50.
- Beurel E, Toups M, Nemeroff CB. The Bidirectional Relationship of Depression and Inflammation: Double Trouble. Neuron. 2020;107(2):234–56.
- van Eeden WA et al. Basal and LPS-stimulated inflammatory markers and the course of anxiety symptoms. Brain Behav Immun. 2021;98:378–87.
- Maes M, Anderson G, Kubera M, Berk M. Targeting classical IL-6 signalling or IL-6 trans-signalling in depression? Expert Opin Ther Targets. 2014;18(5):495–512.
- Li Y et al. Interleukin-6-white matter network differences explained the susceptibility to depression after stressful life events. J Affect Disord. 2022;305:122–32.
- Alshammari MA et al. Systemic TNF-α blockade attenuates anxiety and depressive-like behaviors in db/db mice through downregulation of inflammatory signaling in peripheral immune cells. Saudi Pharm J. 2020;28(5):621–29.
- Millischer V et al. AKT1 and genetic vulnerability to bipolar disorder. Psychiatry Res. 2020;284:112677. doi:10.1016/j.psychres.2019.112677.
- Ji Y et al. Xiaoyao Pills Ameliorate Depression-like Behaviors and Oxidative Stress Induced by Olfactory Bulbectomy in Rats via the Activation of the PIK3CA-AKT1-NFE2L2/BDNF Signaling Pathway. Front Pharmacol. 2021;12:643456. doi:10.3389/fphar.2021.643456.
- Lu Y et al. Neuron-Derived Estrogen Regulates Synaptic Plasticity and Memory. J Neurosci. 2019;39(15):2792–809.
- Tiemeier H et al. Estrogen receptor alpha gene polymorphisms and anxiety disorder in an elderly population. Mol Psychiatry. 2005;10(9):806–7.
- Comings DE, Muhleman D, Johnson P, MacMurray JP. Potential role of the estrogen receptor gene (ESR1) in anxiety. Mol Psychiatry. 1999;4(4):374–7.
- Tsai SJ, Wang YC, Hong CJ, Chiu HJ. Association study of oestrogen receptor alpha gene polymorphism and suicidal behaviours in major depressive disorder. Psychiatr Genet. 2003;13(1):19–22.
- Nguyen HD, Kim MS. Interactions between cadmium, lead, mercury, and arsenic and depression: A molecular mechanism involved. J Affect Disord. 2023;327:315–29.
- Sharma D et al. Pharmacological modulation of HIF-1 in the treatment of neuropsychiatric disorders. J Neural Transm (Vienna). 2023;130(12):1523–35.
- Wen Q et al. Forkhead family transcription factor FoxO and neural differentiation. Neurogenetics. 2012;13(2):105–13.
- Wang H et al. Forkhead box O transcription factors as possible mediators in the development of major depression. Neuropharmacology. 2015;99:527–37.
- Hu W et al. Chinese herbal medicine alleviates autophagy and apoptosis in ovarian granulosa cells induced by testosterone through PI3K/AKT1/FOXO1 pathway. J Ethnopharmacol. 2024;318(Pt B):117025. doi:10.1016/j.jep.2023.117025.
- Rana T et al. Elucidating the Possible Role of FoxO in Depression. Neurochem Res. 2021;46(11):2761–75.
- Richards JS et al. Novel signaling pathways that control ovarian follicular development, ovulation, and luteinization. Recent Prog Horm Res. 2002;57:195–220.
- Zhang JH et al. Role of EGFR expressed on the granulosa cells in the pathogenesis of polycystic ovarian syndrome. Front Endocrinol (Lausanne). 2022;13:971564. doi:10.3389/fendo.2022.971564.
- Liu Q et al. Mechanisms by which PM2.5-PAHs drive neurodevelopmental co-morbidities across the placental-blood-brain barrier: A network toxicology analysis. Ecotoxicol Environ Saf. 2025;306:119306. doi:10.1016/j.ecoenv.2025.119306.
- Jurek B et al. Differential contribution of hypothalamic MAPK activity to anxiety-like behaviour in virgin and lactating rats. PLoS One. 2012;7(5):e37060. doi:10.1371/journal.pone.0037060.
- Amini J, Beyer C, Zendedel A, Sanadgol N. MAPK Is a Mutual Pathway Targeted by Anxiety-Related miRNAs, and E2F5 Is a Putative Target for Anxiolytic miRNAs. Biomolecules. 2023;13(3):544. doi:10.3390/biom13030544.