This cross-sectional study characterized pathogen distribution using serological testing and sputum culture in hospitalized patients with acute exacerbations of chronic obstructive pulmonary disease in Heyuan and examined infection types across disease severity stages.
Research Article
Pathogen Distribution and Infection Types Across Chronic Obstructive Pulmonary Disease Severity in a Cross-Sectional Study in Heyuan
In This Article
Summary
Abstract
This cross-sectional study aimed to characterize the pathogen profile among hospitalized patients with acute exacerbation of chronic obstructive pulmonary disease (AECOPD) in the Heyuan region and examine the distribution of infection types across severity grades defined by the Global Initiative for Chronic Obstructive Lung Disease (GOLD). The study included 203 hospitalized patients with AECOPD from the largest comprehensive tertiary Grade A hospital in Heyuan. Pathogen screening was performed using serological antibody testing and sputum culture. The overall pathogen detection rate was 50.25%, while non-infectious factors accounted for 49.75%. Atypical pathogens were frequently detected, with Mycoplasma pneumoniae accounting for 35.96% and influenza virus for 11.82%. Mixed infections comprised 17.24%, and pure atypical pathogen infections represented 22.17%. Among the 109 AECOPD patients stratified by disease severity, simple viral and mixed pathogen infections had the highest combined proportions of severe and very severe cases (100.0% and 92.9%, respectively). These findings characterize pathogen detection patterns among hospitalized patients with AECOPD in Heyuan and demonstrate variation in infection types across GOLD severity grades. The findings should be interpreted cautiously because serological detection, particularly M. pneumoniae immunoglobulin G (IgG), cannot independently distinguish previous exposure from active infection. C-reactive protein (CRP) and procalcitonin (PCT) measurements may provide additional information when evaluating infection patterns; however, the observational study design does not establish treatment efficacy or support GOLD-stage-specific therapeutic recommendations.
Introduction
Chronic obstructive pulmonary disease (COPD) is a leading cause of illness and death worldwide, with acute exacerbations (AECOPD) acting as key drivers of disease progression and associated mortality1. These acute episodes, characterized by a sudden worsening of respiratory symptoms, are often precipitated by respiratory infections, including viruses, bacteria, and atypical pathogens2,3. While the influence of bacterial infections is well documented, recognition of viral and atypical pathogens, such as Mycoplasma pneumoniae and Chlamydia pneumoniae, as important contributors to exacerbation events has grown in recent years4. Geographic variability and differences in patient demographics influence the distribution of these pathogens, making their relationship with disease severity—categorized according to the Global Initiative for Chronic Obstructive Lung Disease (GOLD) grading system—an area requiring further study5.
The current diagnostic approach for AECOPD relies mainly on conventional sputum cultures, a method with notable limitations, including a low positivity rate of 34.28%–41.12%6,7, long turnaround times, and a limited ability to detect fastidious or non-culturable organisms. As such, this conventional approach often fails to provide a complete picture of the infection profile. In particular, it is unable to detect non-bacterial pathogens, including viruses and atypical agents, which are important triggers of exacerbations8,9. Previous investigations have shown that atypical pathogens detected using serological methods may be comparatively rare in certain populations, while their identification remains limited by the insensitivity of culture-based diagnostics4,10. Reliance on traditional culture practices creates a diagnostic gap, potentially leading to the underrecognition of mixed infections and inappropriate use of antibiotics, which may contribute to increasing antimicrobial resistance11.
Previous investigations have shown that atypical pathogens and viruses, such as M. pneumoniae and respiratory syncytial virus, occur in patients experiencing respiratory exacerbations but may escape detection through routine testing12,13. The complexity of the etiology is further increased by the coexistence of diverse pathogen types, including atypical bacteria, viruses, and fungi, which can complicate empirical antibiotic treatment14. Difficulties in identifying these pathogens may arise from the limitations of conventional culture-based methodologies coupled with insufficient clinical vigilance, particularly among frontline practitioners in resource-limited settings7.
Existing epidemiological studies on AECOPD have largely originated from economically advanced eastern cities or prominent teaching hospitals, providing limited data that may not capture the full spectrum of the disease in economically disadvantaged regions with limited medical resources15. Previous studies have shown that individuals with chronic illnesses residing in rural and underserved areas encounter significant barriers to healthcare access, including lower provider density, greater distances to medical facilities, and higher poverty rates, which often contribute to delayed diagnoses and suboptimal management16,17. The microbiological profile of AECOPD in such areas may differ from that observed in urban environments because of differences in environmental exposures, socioeconomic influences, and healthcare-seeking behaviors18. Consequently, conclusions drawn from well-resourced urban centers may not directly apply to empirical antimicrobial strategies in regions such as northeastern Guangdong, where local epidemiological data remain limited. This geographic discrepancy highlights the need for targeted investigations to characterize the pathogen profile of AECOPD in resource-constrained settings.
Given such heterogeneity, reliance on a single empirical antibiotic strategy without knowledge of the local microbiological profile may lead to suboptimal treatment outcomes and increased inappropriate antimicrobial use19,20. A thorough understanding of the local pathogen profile is important for AECOPD management because misuse of antimicrobial agents contributes to increasing antibiotic resistance11. Investigations have demonstrated the frequent presence of non-typeable Haemophilus influenzae, Streptococcus pneumoniae, and Moraxella catarrhalis as prevalent bacterial pathogens in numerous settings21; however, the distribution of these organisms varies according to geographic factors, patient demographics, and disease severity22,23. A proportion of exacerbations has also been associated with atypical pathogens, including M. pneumoniae and C. pneumoniae, as well as respiratory viruses such as influenza and respiratory syncytial virus8.
To characterize the pathogen profile of AECOPD in this region, we combined serological antibody testing with sputum culture to provide a broader picture of pathogen distribution. The findings are intended to characterize local pathogen detection patterns and provide regional epidemiological information relevant to AECOPD management and local public health efforts.
Protocol
This study was approved by the Medical Ethics Committee of Heyuan People’s Hospital, Guangdong Provincial People’s Hospital Heyuan Hospital (approval ID: YXYJLL-BBCJ20210707). The requirement for informed consent was formally waived by the Ethics Committee because residual serum, sputum, or BALF specimens obtained during routine clinical care were used.
Study subjects
This cross-sectional study included 203 patients with AECOPD treated at the largest comprehensive tertiary Grade A hospital in the Heyuan region between October 2021 and August 2022. The inclusion criteria were as follows: (1) age >40 years; and (2) a diagnosis of AECOPD based on the 2021 GOLD guidelines. The exclusion criteria were as follows: (1) use of injectable corticosteroids within 1 month prior to admission; (2) the presence of other chronic lung diseases, such as active pulmonary tuberculosis, bronchiolitis obliterans, severe interstitial lung disease, bronchiectasis, diffuse panbronchiolitis, or lung cancer; and (3) incomplete medical records.
Methods
Blood sample testing
After enrollment, in addition to routine tests, residual blood samples from other tests conducted within 3 days of admission were collected. The residual blood samples were collected on the same day, aliquoted, stored at −20°C for one month, and retained for subsequent antibody analysis. Repeated freeze-thaw cycles were strictly avoided before testing. After all enrollments were completed, antibody tests were uniformly performed using a chemiluminescent magnetic particle detection platform for respiratory syncytial virus, adenovirus, enterovirus 71, Coxsackie virus B, influenza A virus, influenza B virus, C. pneumoniae, and L. pneumophila IgM antibodies and M. pneumoniae IgG antibodies. The assay positivity cutoff value for IgM was S/CO ≥ 1.0. A positive case of M. pneumoniae was defined as meeting both criteria: IgG ≥ 30.0 AU/mL and CRP > 10 mg/L. IgM, PCR, paired serology, and other confirmatory diagnostic methods were not used to identify M. pneumoniae. Strict internal quality-control procedures provided by the manufacturer were followed throughout the testing process.
Sputum or BALF sample testing
After enrollment, residual sputum or BALF specimens from other tests conducted within 3 days of admission were collected. All sputum specimens were initially screened by smear microscopy to evaluate cellular composition under light microscopy. Sputum quality was assessed under a low-power field (100× magnification). Sputum was considered of acceptable quality if it fulfilled either of the following criteria: <10 squamous epithelial cells and >25 leukocytes per low-power field, or >10 squamous epithelial cells per low-power field with a squamous epithelial cell-to-leukocyte ratio of <1:2.5. Qualified sputum specimens were cultured according to standard laboratory procedures, followed by automated bacterial identification and AST. Sputum samples were cultured on blood agar, chocolate agar, and Sabouraud agar plates and incubated at 35°C with 5% CO₂ for up to 72 h. Colony growth was assessed after 18–24 h, and suspected pathogenic colonies were selected and purified. Pathogen identification and AST were performed using commercial kits.
Observation content
The distribution of various pathogens in patients with AECOPD was analyzed. Infection types according to different GOLD stages were analyzed.
Statistical analysis
SPSS version 23.0 was used for data processing and statistical analysis. Measurement data were expressed as x̄ ± s and analyzed using the t-test. Count data were expressed as n (%) and analyzed using the χ2 test. The assumptions of the χ2 test were evaluated before statistical analysis. When expected cell counts were <5, Fisher’s exact test was used instead of the χ2 test. P < 0.05 was considered statistically significant. GOLD grading was performed according to the classification criteria in the 2021 GOLD guidelines: mild (FEV1%Pred ≥ 80%), moderate (50% ≤ FEV1%Pred < 80%), severe (30% ≤ FEV1%Pred < 50%), and very severe (FEV1%Pred < 30%).
Results
Baseline clinical characteristics
In total, 203 patients diagnosed with AECOPD were included in the study. Of these, 183 (90.1%) were male and 20 (9.9%) were female. The participants ranged in age from 43 to 93 years, with a mean age of 73.33 ± 9.17 years. The mean length of hospital stay was 9.56 ± 11.06 days, with a minimum of 3 days and a maximum of 145 days. Cough was the most prevalent clinical symptom, occurring in 195 patients (96.06%), followed by mucopurulent sputum in 132 (65.02%), purulent sputum in 29 (14.29%), dyspnea in 20 (9.85%), and fever in 18 (8.87%). Comorbidities included hypertension in 82 patients (40.39%), cardiovascular disease in 58 (28.57%), cor pulmonale in 53 (26.11%), diabetes mellitus in 25 (12.32%), and coronary heart disease in 20 (9.85%). A history of smoking was reported by 174 patients (85.71%). Mechanical ventilation was required in 20 patients (9.85%). Regarding inflammatory markers, 74 patients (36.45%) had CRP >10 mg/L. For PCT, 135 patients (66.50%) had PCT ≤0.05 ng/mL, 53 (26.11%) had PCT ranging from 0.05 to 0.5 ng/mL, and 15 (7.39%) had PCT >0.5 ng/mL. Rehospitalization within 90 days occurred in 25 patients (12.32%) (Table 1). Pulmonary function test results were available for 109 patients. Among these patients, the GOLD classification comprised 14 mild cases (12.85%), 18 moderate cases (16.51%), 39 severe cases (35.78%), and 38 very severe cases (34.86%). FEV1/FVC ranged from 26.92% to 69.99%, with a mean value of 50.57% ± 12.41% (Table 1).
| Variable | Value |
| Sex | |
| Male | 183 (90.1) |
| Female | 20 (9.9) |
| Age (years) | 73.33 ± 9.17 |
| Clinical symptoms | |
| Cough | 195 (96.06) |
| Mucopurulent sputum | 132 (65.02) |
| Purulent sputum | 29 (14.29) |
| Dyspnea | 20 (9.85) |
| Fever | 18 (8.87) |
| Comorbidities | |
| Hypertension | 82 (40.39) |
| Cardiovascular disease | 58 (28.57) |
| Diabetes mellitus | 25 (12.32) |
| Cor pulmonale | 53 (26.11) |
| Coronary heart disease | 20 (9.85) |
| Malignancy | 8 (3.94) |
| Autoimmune disease | 2 (0.99) |
| Smoking history | |
| Yes | 174 (85.71) |
| No | 29 (14.29) |
| GOLD stage | |
| Mild | 14 (12.85) |
| Moderate | 18 (16.51) |
| Severe | 39 (35.78) |
| Very severe | 38 (34.86) |
| FEV1/FVC (%) | 50.57 ± 12.41 |
| CRP (mg/L) | |
| >10 | 74 (36.45) |
| ≤10 | 129 (63.55) |
| PCT (ng/mL) | |
| ≤0.05 | 135 (66.50) |
| 0.05–0.5 | 53 (26.11) |
| >0.5 | 15 (7.39) |
| Length of hospital stay (days) | 9.56 ± 11.06 |
| Mechanical ventilation | 20 (9.85) |
| Rehospitalization within 90 days | 25 (12.32) |
Table 1: Baseline clinical characteristics of the study participants. Data are presented as mean ± standard deviation (SD) for continuous variables and n (%) for categorical variables. GOLD stage data are reported for participants with available pulmonary function test results. CRP, C-reactive protein; FEV1, forced expiratory volume in 1 s; FVC, forced vital capacity; GOLD, Global Initiative for Chronic Obstructive Lung Disease; PCT, procalcitonin.
Distribution of Pathogens in AECOPD Patients
Among the 203 patients, 102 cases were positive, corresponding to a positivity rate of 50.25%. A total of 20 pathogens were identified. The study workflow for specimen collection, pathogen detection, serum antibody detection, pulmonary function assessment, GOLD classification, and subsequent statistical analysis is shown in Figure 1.
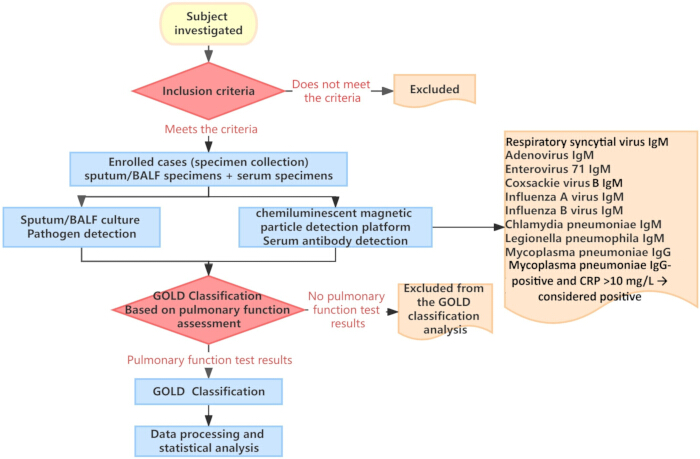
Figure 1. Study workflow for participant enrollment, pathogen detection, and GOLD classification. Subjects meeting the inclusion criteria were enrolled, and sputum/bronchoalveolar lavage fluid (BALF) and serum specimens were collected. Pathogens were assessed by sputum/BALF culture and serum antibody detection using a chemiluminescent magnetic particle detection platform. GOLD classification was based on pulmonary function assessment; subjects without pulmonary function test results were excluded from the GOLD classification analysis. The detected serum antibodies and the criterion used for Mycoplasma pneumoniae positivity are shown in the figure. Data were subsequently processed for statistical analysis. BALF, bronchoalveolar lavage fluid; GOLD, Global Initiative for Chronic Obstructive Lung Disease; IgM, immunoglobulin M; IgG, immunoglobulin G; CRP, C-reactive protein. Please click here to view a larger version of this figure.
Atypical pathogens were the most frequently detected pathogen group: M. pneumoniae was detected in 73 cases (35.96%), L. pneumophila in 3 cases (1.48%), and C. pneumoniae in 1 case (0.49%). Among viral pathogens, influenza virus (1 influenza A and 23 influenza B) was identified in 24 cases (11.82%), Coxsackie virus B in 9 cases (4.43%), adenovirus in 9 cases (4.43%), and respiratory syncytial virus in 4 cases (1.97%). Bacterial pathogens included P. aeruginosa in 4 cases (1.97%), S. maltophilia in 4 cases (1.97%), K. pneumoniae in 2 cases (0.99%), and H. influenzae in 2 cases (0.99%). Fungal pathogens included C. albicans in 3 cases (1.48%) and A. fumigatus in 1 case (0.49%) (Figure 2).
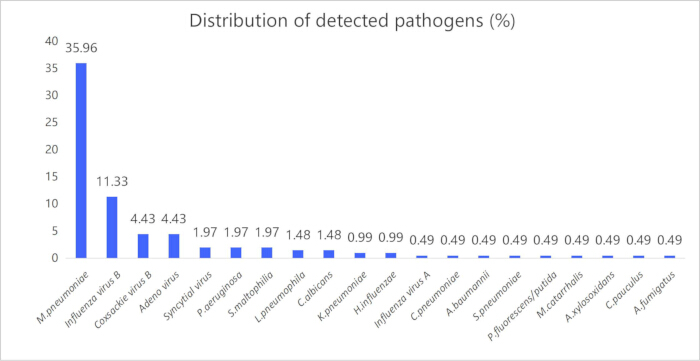
Figure 2. Distribution of detected pathogens. Percentage distribution of individual pathogens detected in the study population. Bars represent the percentage attributed to each pathogen category. Please click here to view a larger version of this figure.
Non-infectious factors accounted for 49.75% of cases, mixed pathogen infections for 17.24%, pure atypical pathogen infections for 22.17%, simple viral infections for 6.90%, and simple bacterial infections for 3.94% (Figure 3).
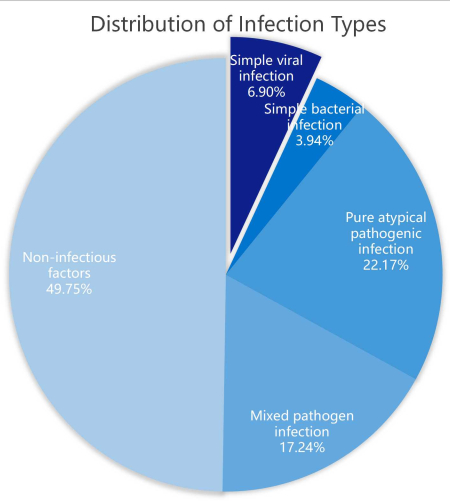
Figure 3. Distribution of infection types. Percentage distribution of cases classified as simple viral infection, simple bacterial infection, pure atypical pathogen infection, mixed pathogen infection, or non-infectious factors. Percentages indicate the proportion of cases in each etiological category. Please click here to view a larger version of this figure.
Infection Types by Different GOLD Stages
Among the 203 study patients, 109 had valid pulmonary function data for GOLD staging. The 94 patients lacking pulmonary function measurements were excluded from GOLD-stratified analyses. Accordingly, pathogen-positive analyses used the full cohort (n = 203), whereas GOLD-related analyses were restricted to the subgroup of 109 patients. Within this subgroup, 5 cases had simple viral infection (4.59%), 7 had simple bacterial infection (6.42%), 28 had pure atypical pathogen infection (25.69%), 14 had mixed pathogen infection (12.84%), and 55 had non-infectious factors (50.46%).
The distributions of infection categories across GOLD stages are shown in Figure 4. Of the 5 simple viral infection cases, 0.0% were mild, 0.0% were moderate, 40.0% were severe, and 60.0% were very severe. Of the 7 simple bacterial infection cases, 0.0% were mild, 42.86% were moderate, 28.57% were severe, and 28.57% were very severe. Among the 28 pure atypical pathogen infection cases, 14.29% were mild, 14.29% were moderate, 35.71% were severe, and 35.71% were very severe. Among the 14 mixed pathogen infection cases, 0.0% were mild, 7.14% were moderate, 50.0% were severe, and 42.86% were very severe. Among the 55 cases with non-infectious factors, 18.18% were mild, 18.18% were moderate, 32.73% were severe, and 30.91% were very severe. The combined proportion of severe and very severe cases was highest in the simple viral infection group (100.0%), followed by the mixed pathogen infection group (92.9%) (Figure 4). Simple viral infection was observed only in the severe and very severe groups, whereas simple bacterial infection was observed in the moderate, severe, and very severe groups. Pure atypical pathogen infection and non-infectious factors were distributed across all severity subgroups, whereas mixed pathogen infection occurred predominantly in the severe and very severe groups.
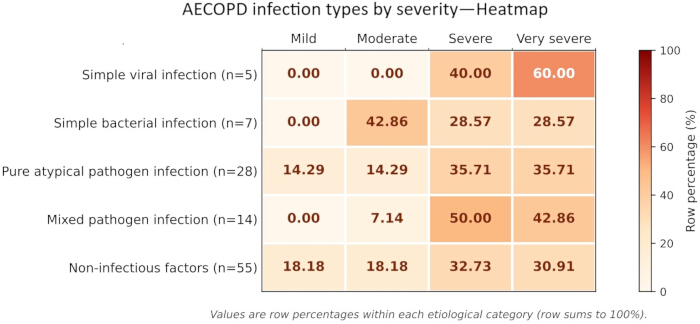
Figure 4. Distribution of infection types according to AECOPD severity. Heatmap showing the distribution of simple viral infection, simple bacterial infection, pure atypical pathogen infection, mixed pathogen infection, and non-infectious factors across mild, moderate, severe, and very severe AECOPD. Values represent row percentages within each etiological category, with each row totaling approximately 100%. The number of cases in each category is indicated by n. Color intensity represents the row percentage. AECOPD, acute exacerbation of chronic obstructive pulmonary disease. Please click here to view a larger version of this figure.
Overall, pathogen detection demonstrated heterogeneous etiological patterns among the enrolled AECOPD cases, with non-infectious factors and pure atypical pathogen infections accounting for the largest proportions of the etiological categories reported (Figure 2 and Figure 3). Among patients with available pulmonary function test results, infection-type distributions varied across GOLD severity categories (Figure 4).
Data Availability:
Raw patient data are not publicly available owing to ethical and privacy constraints. Requests for de-identified data may be submitted to the corresponding author.
Discussion
In this study, we found an overall pathogen detection rate of 50.25% among patients with AECOPD. Atypical pathogens, primarily M. pneumoniae (35.96%), and viral agents, most commonly influenza virus (11.82%), accounted for substantial proportions of the detected pathogens. These findings describe the pathogen-detection patterns observed among patients with AECOPD in the Heyuan region. The M. pneumoniae positivity rate according to the study criterion was 35.96%. However, the positivity rate in our cohort was higher than that reported in most previous studies24, including 11.2% in South Korea25, 9% in Greece26, and 20.69% in a multicenter investigation across China27. This difference may reflect regional epidemiological characteristics specific to Heyuan. The use of highly sensitive serological assays, particularly chemiluminescence-based detection, may also have contributed to the higher positivity rate, as serological testing often yields higher detection rates than nucleic acid testing27. These findings should be interpreted with caution. Because M. pneumoniae positivity in this study was based on IgG testing together with CRP >10 mg/L, without confirmation by IgM serology, PCR, paired serology, or other validated confirmatory methods, this operational definition cannot reliably distinguish previous exposure from active infection. The observational nature of this study precludes conclusions regarding treatment efficacy and does not support GOLD-stage-specific therapeutic recommendations.
The identification of influenza virus as a common pathogen aligns with its established role as a trigger of AECOPD28 and its contribution to exacerbation-related morbidity and mortality29. The viral detection rate highlights the importance of respiratory viruses as contributors to COPD exacerbations30. Other viruses, such as adenovirus, also contribute to the viral etiology of AECOPD31. Clinically, these findings suggest that clinicians should be alert to the possibility of atypical pathogens during the management of AECOPD in Heyuan. Further etiological assessment using diagnostic approaches such as PCR or NGS may help characterize pathogen-detection patterns, while antiviral strategies, including vaccination, remain important for prevention32,33. The high rate of pathogen detection, including mixed infections, also reflects the complex microbial interactions that can trigger inflammatory responses and worsen pulmonary function during COPD exacerbations34.
Infection types varied across GOLD stages, suggesting a potential relationship between disease severity and the etiological pattern. This observation is consistent with the pathophysiology of COPD, in which exacerbation triggers may change as the disease progresses35. Infections remain an important trigger across severity levels, with well-documented roles for respiratory viruses and bacteria36,37. In our cohort, the distribution of simple viral and bacterial infections differed across GOLD stages. Inflammatory biomarkers such as CRP and PCT may provide additional information when evaluating patients with AECOPD; however, the present observational study did not assess antibiotic treatment efficacy. Studies have demonstrated that bedside rapid testing for CRP and PCT can safely reduce unnecessary antibiotic use without adversely affecting clinical outcomes38. Approximately half of the patients in this cohort tested negative for pathogens, highlighting the potential contribution of non-infectious triggers to AECOPD. Many of these patients had no identifiable infectious etiology, suggesting that the need for empirical antibiotic treatment should be carefully evaluated in this subgroup. Elevated concentrations of PM2.5 have been shown to correlate with an increased risk of AECOPD and a heightened systemic inflammatory response39. Furthermore, factors such as suboptimal adherence to maintenance therapies and inadequate long-term management strategies are recognized as contributors to exacerbation events.
The prevalence of mixed infections (17.24%) was broadly consistent with rates previously reported in AECOPD and community-acquired pneumonia40,41. This finding may be related to the broad diagnostic approach used in our study, which screened for multiple atypical bacteria, viruses, and fungi, including M. pneumoniae, L. pneumophila, C. pneumoniae, and respiratory viruses. This comprehensive screening may have detected coinfections that could have been missed by more restrictive protocols42,43. The co-detection of multiple agents illustrates the complexity of the microbial patterns observed in patients with AECOPD. Alternative approaches using multiplex diagnostic methods could provide broader simultaneous pathogen detection and help confirm the clinical relevance of polymicrobial findings. Future studies using such methods are needed to clarify the clinical significance and potential mechanisms of polymicrobial interactions.
This study has several limitations. As a single-center, cross-sectional study with a relatively small sample, it is subject to selection bias and has limited generalizability. The sample size constrained our ability to detect significant differences in pathogen distribution across GOLD stages or to perform stratified subgroup analyses. For example, only 14 cases of mild disease were included, which may have resulted in imprecise estimates and reduced statistical power. Because the study was conducted at a single institution, the study population may not represent epidemiological patterns in other regions. In addition, this study did not conduct adjusted analyses to account for potential confounders, which represents an important limitation. Future studies should prioritize multicenter collaboration with larger sample sizes to improve statistical power and generalizability, enabling a more comprehensive evaluation of respiratory pathogen distribution and its relationship with disease severity.
The prognostic implications of specific pathogens in AECOPD remain an unmet research need. This study lacked integrated clinical outcome data, limiting our ability to assess associations between specific pathogens and prognosis. The relationships between identified pathogens and patient outcomes, including treatment response and recurrence rates, therefore remain to be clarified. Future studies should prospectively evaluate clinical endpoints to determine the clinical significance of different microbiological patterns. Integrating pathogen data with clinical manifestations and treatment responses may facilitate the development of more individualized treatment strategies and improve understanding of the clinical relevance of different pathogen profiles. Overall, the present findings characterize the local pathogen distribution in AECOPD and provide a basis for larger, multicenter prospective studies examining pathogen patterns, disease severity, and clinical outcomes.
Disclosures
Conflict of Interest:
The authors declare that they have no conflicts of interest.
Acknowledgements
This work was supported by the Heyuan Special Topic on the Social Development Science and Technology Plan Project (No. 210730081601382). The authors thank Zhengzhou Antu Bioengineering Co., Ltd., for providing the detection reagents.
Materials
| Name | Company | Catalog Number | Comments |
|---|---|---|---|
| Adenovirus IgM Antibody Detection Kit (Magnetic Particle Chemiluminescence Method) | Zhengzhou Antu Bioengineering Co., Ltd. | 30041604CM01 | For antibody detection |
| Automated Bacterial Identification and Antimicrobial Susceptibility Testing System | Beckman Coulter Commercial Enterprise (China) Co., Ltd. | MicroScan-WalkAway 96 Plus | Instrument used for automated bacterial identification and antimicrobial susceptibility testing; corresponding panels are listed below |
| Blood Agar Plate (BAP) | Jiangmen Kailin Trading Co., Ltd. | P0901 | For bacterial isolation and culture |
| Chocolate Agar Plate (CAP) | Guangzhou Detgerm Microbiological Science Ltd. | LS0209 | For bacterial isolation and culture |
| Chlamydia pneumoniae IgM Antibody Detection Kit (Magnetic Particle Chemiluminescence Method) | Zhengzhou Antu Bioengineering Co., Ltd. | 30041602CM01 | For antibody detection |
| Coxsackievirus Group B IgM Antibody Detection Kit (Magnetic Particle Chemiluminescence Method) | Zhengzhou Antu Bioengineering Co., Ltd. | 30041609CM01 | For antibody detection |
| Enterovirus 71 IgM Antibody Detection Kit (Magnetic Particle Chemiluminescence Method) | Zhengzhou Antu Bioengineering Co., Ltd. | 30041608CM01 | For antibody detection |
| Gram-negative Bacteria Identification and Antimicrobial Susceptibility Panel NUC79 | Beckman Coulter Commercial Enterprise (China) Co., Ltd. | B1017-431 | For bacterial identification and antimicrobial susceptibility testing |
| Influenza A Virus IgM Antibody Detection Kit (Magnetic Particle Chemiluminescence Method) | Zhengzhou Antu Bioengineering Co., Ltd. | 30041614CM01 | For antibody detection |
| Influenza B Virus IgM Antibody Detection Kit (Magnetic Particle Chemiluminescence Method) | Zhengzhou Antu Bioengineering Co., Ltd. | 30041615CM01 | For antibody detection |
| Legionella pneumophila IgM Antibody Detection Kit (Magnetic Particle Chemiluminescence Method) | Zhengzhou Antu Bioengineering Co., Ltd. | 30041605CM01 | For antibody detection |
| Light Microscope | Olympus Corporation | CX21 | Used for microscopic assessment of sputum specimen quality |
| Magnetic Particle Chemiluminescence Detection Platform | Zhengzhou Antu Bioengineering Co., Ltd. | Au2000 | Instrument used for serological antibody testing |
| Mycoplasma pneumoniae IgG Antibody Detection Kit (Magnetic Particle Chemiluminescence Method) | Zhengzhou Antu Bioengineering Co., Ltd. | 30041607CM01 | For antibody detection |
| PC33/Gram-positive Bacteria Identification and Antimicrobial Susceptibility Panel | Beckman Coulter Commercial Enterprise (China) Co., Ltd. | B1017-211 | For bacterial identification and antimicrobial susceptibility testing |
| Respiratory Syncytial Virus IgM Antibody Detection Kit (Magnetic Particle Chemiluminescence Method) | Zhengzhou Antu Bioengineering Co., Ltd. | 30041603CM01 | For antibody detection |
| Sabouraud Dextrose Agar (SDA) | Jiangmen Kailin Trading Co., Ltd. | P0719 | For fungal isolation and culture |
| SPSS, Version 23.0 | IBM Corp. | RRID:SCR_019096 | Statistical analysis software |
| Yeast-like Fungus Antimicrobial Susceptibility Test Kit | bioMérieux (Shanghai) Biological Product Co., Ltd. | 14204 | For fungal antimicrobial susceptibility testing |
References
- Viniol C, Vogelmeier CF. Exacerbations of COPD. Eur Respir Rev. 2018;27(147):170103.
- Tanrıverdi H et al. Comparison of diagnostic values of procalcitonin, C-reactive protein and blood neutrophil/lymphocyte ratio levels in predicting bacterial infection in hospitalized patients with acute exacerbations of COPD. Wien Klin Wochenschr. 2015;127(19-20):756-63.
- Morrow JD et al. Identifying a gene expression signature of frequent COPD exacerbations in peripheral blood using network methods. BMC Med Genomics. 2015;8:1.
- Jung CY et al. Use of serology and polymerase chain reaction to detect atypical respiratory pathogens during acute exacerbation of chronic obstructive pulmonary disease. Korean J Intern Med. 2018;33(5):941-51.
- Barouchos N et al. Comparison of tumor markers and inflammatory biomarkers in chronic obstructive pulmonary disease (COPD) exacerbations. Scand J Clin Lab Invest. 2015;75(2):126-32.
- Ma X et al. Multicentre investigation of pathogenic bacteria and antibiotic resistance genes in Chinese patients with acute exacerbation of chronic obstructive pulmonary disease. J Int Med Res. 2015;43(5):699-710.
- Sharan H. Aerobic bacteriological study of acute exacerbations of chronic obstructive pulmonary disease. J Clin Diagn Res. 2015;9(8):DC10-2.
- Yin T et al. Analysis of viral infection and biomarkers in patients with acute exacerbation of chronic obstructive pulmonary disease. Clin Respir J. 2018;12(3):1228-39.
- Ko FW et al. Acute exacerbation of COPD. Respirology. 2016;21(7):1152-65.
- Zhang W, Chen C, Cui J, Bai W, Zhou J. Application of loop-mediated isothermal amplification (LAMP) assay for the rapid diagnosis of pathogenic bacteria in clinical sputum specimens of acute exacerbation of COPD (AECOPD). Int J Clin Exp Med. 2015;8(5):7881-9.
- Ma Y et al. Real-world antibiotic use in treating acute exacerbations of chronic obstructive pulmonary disease (AECOPD) in China: Evidence from the ACURE study. Front Pharmacol. 2021;12:649884.
- Gonzalez-Uribe V et al. Respiratory infections and asthma exacerbations in children: Regional insights into the overlooked role of atypical pathogens in Mexico. J Allergy Clin Immunol Glob. 2025;5(1):100597.
- Ruiz-González A, Sáez-Huerta E, Martínez-Alonso M, Bernet-Sánchez A, Porcel JM. A simple scoring system to differentiate bacterial from viral infections in acute exacerbations of COPD requiring hospitalization. Int J Chron Obstruct Pulmon Dis. 2022;17:773-9.
- Yu S, Yang T. Characteristics of pathogens of acute exacerbation of chronic obstructive pulmonary disease hospitalized patients: A retrospective study from 2010 to 2020. Pulm Med. 2025;2025:4025205.
- Choy A et al. Geographic differences in availability and access to care services for asthma and COPD: Case study of Vancouver Coastal Health, British Columbia. Can Respir J. 2024;2024:8019557.
- Koppula S, Patel K, Unruh M. The delivery of kidney care in rural or sparsely populated settings. Am J Kidney Dis. 2025;86(4):543-9.
- Verdejo HE, Ferreccio C, Castro PF. Heart failure in rural communities. Heart Fail Clin. 2015;11(4):515-22.
- Seo H et al. The relationship between comorbidities and microbiologic findings in patients with acute exacerbation of chronic obstructive pulmonary disease. Int J Chron Obstruct Pulmon Dis. 2022;17:855-67.
- Manjhi R, Nanda SK, Agrawal BK. Sputum antibiogram in acute exacerbation of chronic obstructive pulmonary disease. J Family Med Prim Care. 2022;11(12):7713-9.
- Kasundra AS et al. A study of clinical profile, sputum microbiology, and laboratory parameters of patients admitted with acute exacerbation of chronic obstructive pulmonary diseases in rural-based hospital. J Family Med Prim Care. 2026;15(1):105-9.
- Ra SW et al. Sputum bacteriology and clinical response to antibiotics in moderate exacerbation of chronic obstructive pulmonary disease. Clin Respir J. 2018;12(4):1424-32.
- Dy R, Sethi S. The lung microbiome and exacerbations of COPD. Curr Opin Pulm Med. 2016;22(3):196-202.
- Lozo Vukovac E et al. Bronchoalveolar pH and inflammatory biomarkers in patients with acute exacerbation of chronic obstructive pulmonary disease. J Int Med Res. 2019;47(2):791-802.
- Messous S et al. Prevalence of Chlamydophila pneumoniae and Mycoplasma pneumoniae IgM and IgG antibodies in Tunisian patients presenting with exacerbation of chronic obstructive pulmonary disease. Med Mal Infect. 2017;47(2):158-63.
- Ji HW et al. Clinical significance of various pathogens identified in patients experiencing acute exacerbations of COPD: A multi-center study in South Korea. Tuberc Respir Dis (Seoul). 2025;88(2):292-302.
- Papaetis GS et al. Serological evidence of Mycoplasma pneumoniae infection in patients with acute exacerbation of COPD: Analysis of 100 hospitalizations. Adv Med Sci. 2010;55(2):235-41.
- Feng C et al. Atypical pathogen distribution in Chinese hospitalized AECOPD patients: A multicenter cross-sectional study. Int J Chron Obstruct Pulmon Dis. 2021;16:1699-708.
- Kim HC et al. Different pattern of viral infections and clinical outcomes in patient with acute exacerbation of chronic obstructive pulmonary disease and chronic obstructive pulmonary disease with pneumonia. J Med Virol. 2016;88(12):2092-9.
- Guo RN et al. Impact of influenza on outpatient visits, hospitalizations, and deaths by using a time series Poisson generalized additive model. PLoS One. 2016;11(2):e0149468.
- Pawełczyk M, Kowalski ML. The role of human parainfluenza virus infections in the immunopathology of the respiratory tract. Curr Allergy Asthma Rep. 2017;17(3):16.
- Du XB et al. [Prevalence and risk factors of respiratory viral infection in acute exacerbation of chronic obstructive pulmonary disease]. Zhonghua Jie He He Hu Xi Za Zhi. 2017;40(4):263-6. Chinese.
- Kostinov MP, Zhestkov AV, Protasov AD, Magarshak OO, Kostinova TA. [New ideas on the therapeutic effect of a combination of vaccines against pneumococcal, Haemophilus influenzae type b infection, and influenza in patients with chronic obstructive pulmonary disease]. Ter Arkh. 2015;87(3):17-22. Russian.
- Moreno D, Barroso J, Garcia A. Vaccines for patients with COPD. Recent Pat Inflamm Allergy Drug Discov. 2015;9(1):23-30.
- Guillon A et al. Neutrophil proteases alter the interleukin-22-receptor-dependent lung antimicrobial defence. Eur Respir J. 2015;46(3):771-82.
- Barnes PJ et al. Chronic obstructive pulmonary disease. Nat Rev Dis Primers. 2015;1:15076.
- Al-Husseiny IA, Al-Mayah QS, Hafedh AA. The role of intestinal protozoa in chronic obstructive pulmonary disease exacerbation. Ann Parasitol. 2022;68(1):39-45.
- Shukla SD et al. Hypoxia-inducible factor and bacterial infections in chronic obstructive pulmonary disease. Respirology. 2020;25(1):53-63.
- Li X et al. Point-of-care testing reduces antibiotic prescribing in acute exacerbations of chronic obstructive pulmonary disease: A systematic review and meta-analysis. Int J Infect Dis. 2025;155:107889.
- Cui A et al. Clinicopathological relationship between PM2.5 exposure and acute exacerbations of chronic obstructive pulmonary disease. Ecotoxicol Environ Saf. 2025;291:117846.
- Jahan R et al. Study of respiratory viruses and their coinfection with bacterial and fungal pathogens in acute exacerbation of chronic obstructive pulmonary diseases. Lung India. 2021;38(1):53-8.
- Jiang W et al. Etiologic spectrum and occurrence of coinfections in children hospitalized with community-acquired pneumonia. BMC Infect Dis. 2017;17(1):787.
- Qin S et al. Antibodies against atypical pathogens and respiratory viruses detected by Pneumoslide IgM test in adults with community-acquired pneumonia in Guangzhou City. J Clin Lab Anal. 2020;34(9):e23419.
- Chen YS et al. [Etiological analysis and establishment of a discriminant model for lower respiratory tract infections in hospitalized patients]. Zhonghua Jie He He Hu Xi Za Zhi. 2017;40(12):909-14. Chinese.