Electroacupuncture mitigates chronic heart failure and pathological cardiac remodeling by restoring neuronal activity within the nucleus tractus solitarius. This therapeutic central neuromodulation is associated with the upregulation of the candidate biological target transcription factor YY1.
Research Article
Central Mechanisms of Electroacupuncture in Chronic Heart Failure: Insights from Quantitative Proteomics of the Nucleus Tractus Solitarius
* These authors contributed equally
In This Article
Summary
Abstract
Chronic heart failure (CHF) is a leading global cause of cardiovascular mortality, driven by autonomic dysregulation and sympathetic overactivation. While electroacupuncture (EA) exerts cardioprotective effects via central neuromodulation, its specific molecular targets within the nucleus tractus solitarius (NTS), a key autonomic integration center, remain unclear. To investigate this, the CHF rat model was established via left anterior descending coronary artery ligation. Rats received EA at bilateral HT7 acupoints for seven consecutive days. Cardiac function and myocardial injury were evaluated using echocardiography, enzyme-linked immunosorbent assays, and histological staining. NTS neural activity was assessed via c-Fos immunofluorescence and in vivo electrophysiology. Molecular mechanisms were explored utilizing quantitative proteomics and bioinformatics, with core targets verified via quantitative PCR and Western blotting. EA improved left ventricular ejection fraction, mitigated myocardial fibrosis, and reduced serum heart failure markers. Concurrently, EA restored spontaneous neuronal firing rates, local field potential energy, and c-Fos expression within the NTS. Proteomic profiling identified 85 core differentially expressed proteins modulated by EA. Functional stratification of the 58 downregulated and 27 upregulated proteins revealed their respective participation in extracellular matrix organization and ATP-dependent chromatin remodeling. The stepwise screening approach, integrating topological network mapping, pathway enrichment, and tissue expression profiling, identified the transcription factor YY1 as a highly responsive candidate target. In vivo validation confirmed that EA upregulated YY1 expression. Overall, EA mitigated pathological cardiac remodeling and restored NTS neuronal activity. YY1 was identified as a candidate target associated with this central neuromodulation, providing molecular insight into the mechanisms underlying EA effects in CHF.
Introduction
Chronic heart failure (CHF) is widely recognized as the end stage of diverse cardiovascular pathologies and remains a leading cause of cardiovascular mortality worldwide, placing a massive burden on global healthcare systems1. The pathophysiological progression of CHF is driven primarily by autonomic nervous system dysregulation, characterized by sustained sympathetic overactivation and parasympathetic withdrawal2. Restoring autonomic homeostasis is therefore considered a crucial therapeutic strategy for mitigating pathological cardiac remodeling and improving global cardiac function3.
Electroacupuncture (EA) represents a modern advancement of traditional acupuncture and has gained widespread recognition for its clinical efficacy in managing cardiovascular conditions4. Extensive research, including our previous studies, has highlighted that this therapy exerts significant cardioprotective effects primarily by modulating the central autonomic nervous system. Specifically, we have demonstrated that EA at the Shenmen (HT7) acupoint can effectively suppress excessive sympathetic outflow and restore sympathovagal balance through targeted central neural mechanisms, thereby ameliorating the pathological progression of CHF5,6,7,8.
The nucleus tractus solitarius (NTS), located in the medulla oblongata, is a vital integration center for maintaining central autonomic balance. It serves as the primary relay station for cardiovascular reflexes and peripheral sensory inputs, regulating the dynamic equilibrium between sympathetic and vagal tone9. Despite its anatomical and functional importance, the specific molecular alterations within this critical brainstem center during EA treatment for CHF remain largely unknown. Advanced high-throughput proteomics combined with bioinformatics analysis offers a powerful tool to unbiasedly map the complex protein networks and signaling cascades involved in this central neurobiological process10.
Therefore, this study aimed to investigate the effects of EA at the HT7 acupoint on cardiac function and NTS neuronal activity in CHF and to characterize the molecular alterations within the NTS associated with EA treatment. By integrating in vivo electrophysiology with quantitative proteomics, bioinformatics analysis, and molecular validation, this study sought to identify candidate molecular targets associated with EA-mediated central neuromodulation in CHF.
Protocol
All methods involving vertebrate animals were performed in compliance with the Animal Care and Use Committee of Anhui University of Chinese Medicine, with approval number AHUCM-rats-2024145. The reagents and the equipment used are listed in the Table of Materials.
Animal preparation and grouping
Clean-grade male Sprague-Dawley rats, aged 8 weeks and weighing 200 to 250 g, were used for all experiments. The animals were housed in a controlled environment maintained at 24 ± 2 °C and 50%–60% relative humidity, under a standard 12 h light-dark cycle. All rats were provided ad libitum access to food and water and underwent a 1-week acclimatization period prior to any experimental procedures.
For Experiment I, which evaluated functional and central neural activity, 24 rats were randomly divided into four groups of six animals each: Sham, CHF, EA, and Sham EA groups (Figure 1A). For Experiment II, which evaluated molecular targets and high-throughput proteomics, 36 rats were randomly assigned to three groups of 12 each: Sham, CHF, and EA. The sample sizes were determined based on the Resource Equation Method to adhere to animal welfare ethics and the reduction principle while ensuring statistical validity (E value = 20 for Experiment I; E value = 33 for Experiment II)11. This sample size strategy was consistent with protocols used in previous studies on EA for cardiovascular diseases8,12. Post hoc power analyses indicated that statistical power exceeding 0.90 supported the adequacy of this allocation. The Sham EA group was excluded from Experiment II because preliminary functional evaluations indicated a lack of therapeutic efficacy.
Establishment of the chronic heart failure model
The rats were fasted for 12 h prior to surgery and had free access to water. Anesthesia was induced with 3% isoflurane and maintained at 1.5%–2% isoflurane during the procedure. As isoflurane is a volatile anesthetic, a proper scavenging system was used, and the procedure was performed in a well-ventilated area to prevent occupational exposure.
Standard limb electrocardiograms (ECG) were continuously recorded. A left thoracotomy was performed to expose the heart, and the left anterior descending coronary (LAD) artery was permanently ligated 2 to 3 mm below the left atrial appendage using a 7-0 non-absorbable suture13. Successful ischemia was confirmed by identifying an ST-segment elevation of at least 0.2 mV on the ECG (Figure 1B). Intraperitoneal injections of penicillin (200,000 U/mL) and subcutaneous injections of carprofen (5 mg/kg) were administered daily for three consecutive days postoperatively to prevent infection and alleviate pain.
For the sham control cohort, an identical thoracotomy procedure was performed, followed by superficial needle insertion at the matching anatomical location without ligation of the LAD coronary artery. Identical postoperative care and monitoring were provided. Echocardiographic assessment was performed at 4 weeks post-surgery. The model was considered successfully established when the left ventricular ejection fraction (LVEF) was ≤45%8 (Figure 1C). Animals that failed to meet these criteria, presented preoperative baseline ECG abnormalities, or experienced premature mortality were systematically excluded. Supplementary rats were subjected to identical surgical protocols to immediately replace excluded animals and maintain a uniform sample size.
Electroacupuncture intervention
In accordance with established comparative anatomical protocols14, the bilateral HT7 acupoints on the Hand-Shaoyin Heart Meridian were located at the palmar aspect of the transverse wrist crease near the ulnar border, directly within the radial depression of the flexor carpi ulnaris tendon. The local area was routinely disinfected. Two sterile disposable acupuncture needles (0.25 x 25 mm) were advanced perpendicularly into each HT7 acupoint area to a target depth of 2 to 3 mm and positioned approximately 1 mm apart to remain strictly within the identical acupoint region. For video documentation, the insertion depth was visually verified by pre-marking the needle shaft at the 3 mm position prior to insertion.
One needle was attached to the cathodic terminal of the EA apparatus, and the adjacent needle was attached to the anodic terminal to establish a localized electrical circuit (Figure 1D). A continuous electrical waveform was delivered at a constant frequency of 2 Hz and an intensity of 1 mA, calibrated to produce observable yet mild muscle twitches in the corresponding limbs, for 30 min daily over seven consecutive days under isoflurane anesthesia.
A minimal needling protocol was applied to the sham intervention cohort to account for nonspecific somatosensory responses15,16. Sterile needles were inserted superficially to a depth of 0.5–1 mm at identical HT7 locations without attaching electrical leads or administering current, matching the 30 min anesthetic duration. The baseline Sham and CHF control groups were subjected to identical daily isoflurane exposure (1.5%–2% isoflurane for 30 min daily over seven consecutive days) without needle insertion or electrical stimulation. This procedure standardized the anesthetic baseline across all experimental cohorts and controlled for potential neurosuppressive or cardioprotective artifacts induced by repetitive volatile anesthesia.
Echocardiography assessment and animal euthanasia
Following the intervention, the rats were anesthetized with 3% isoflurane for induction and 1% for maintenance, and secured in a supine position on the animal platform. Chest hair was carefully removed using a depilatory agent, and an acoustic coupling agent was uniformly applied to the exposed skin. Cardiac function was evaluated using a digital ultrasound system equipped with an 18 MHz echo transducer. M-mode echocardiography was recorded to measure LVEF and left ventricular fractional shortening (LVFS), and the mean value from 3 technical replicates was calculated for final analysis.
Blood was drawn from the abdominal aorta while the animals remained under anesthesia to prevent subsequent blood loss and coagulation and to ensure sample quality for enzyme-linked immunosorbent assay (ELISA). The rats were euthanized immediately by continuous induction with 5% isoflurane until cessation of heartbeat and respiration.
Tissue samples were subsequently allocated according to the experimental design. For Experiment I, 3 rats per group were used to harvest the heart for hematoxylin and eosin (HE)/Masson staining and the brain for c-Fos immunofluorescence. The remaining three rats were allocated for in vivo electrophysiology. For Experiment II, bilateral NTS tissues were extracted from six rats per group for proteomics. Tissues from the remaining six rats were harvested for molecular verification: three were used for Western blotting and qPCR, and three were used exclusively for qPCR.
Enzyme-linked immunosorbent assay
The collected blood samples were allowed to coagulate naturally at 4 °C for 10–20 min. The samples were centrifuged at 1,000 x g for 15 min at 4 °C to separate the serum, and the supernatants were collected. When analysis was not performed immediately, serum samples were stored at −80 °C until required. Serum concentrations of N-terminal pro-brain natriuretic peptide (NT-proBNP) and cardiac troponin T (cTnT) were quantified using specific ELISA kits according to the standard instructions. Absorbance values were measured, and biomarker levels were calculated based on standard curves.
Histological and immunofluorescence staining
Harvested heart tissues were rinsed in pre-cooled 0.9% sodium chloride solution, sectioned 5 mm above the apex, and embedded in paraffin. The tissue sections were deparaffinized and rehydrated. HE staining was performed by applying hematoxylin for 10 min, followed by eosin counterstaining for 2.5 min. Masson staining was performed by applying hematoxylin for 60 s and Masson's trichrome for 30–60 s. The sections were differentiated in 6%–8% phosphoric acid and counterstained with light green for 5 min. The collagen volume fraction (CVF) was quantified to evaluate myocardial fibrosis.
Harvested brain tissues were fixed in 4% paraformaldehyde, dehydrated in graded sucrose solutions, and sectioned at a thickness of 30 µm. As paraformaldehyde is toxic and a suspected carcinogen, it was handled inside a chemical fume hood while appropriate personal protective equipment was worn. The sections were blocked with a buffer containing 0.5% Triton X-100 and 3% bovine serum albumin, then incubated overnight at 4 °C with a primary antibody against c-Fos. The sections were then washed with phosphate-buffered saline and incubated with corresponding secondary antibodies for 2 h at room temperature in the dark. The slices were mounted with a fluorescence quenching solution containing 4',6-diamidino-2-phenylindole (DAPI), and the c-Fos-positive neurons were imaged.
In vivo electrophysiology
Rats were anesthetized with isoflurane at 3% for induction and 1% for maintenance and secured in a brain stereotaxic apparatus. The scalp was shaved and disinfected. A midline incision was made to expose the bregma, and the dura mater was removed. A cranial hole was precisely drilled above the NTS region based on the following stereotaxic coordinates relative to Bregma: anteroposterior (AP) ±12.6 mm, mediolateral (ML) ±0.9–2.1 mm, and dorsoventral (DV) ±7.6–8.1 mm.
Following completion of the electrophysiological recordings, the exact stereotaxic localization of the electrode tip was verified. A direct current of 1 mA was briefly applied to the recording electrode for 10 s to create a small electrolytic lesion. Post-experiment, the brainstem was sectioned, and the lesion tract was histologically confirmed to be anatomically localized within the NTS.
An eight-channel (2 x 4) microelectrode array was implanted and slowly advanced to the target brain region at a rate of 5 µm/s using a motorized micromanipulator. Once stable neural activity was established, recordings were acquired continuously for 400 s. A multichannel acquisition system was used to capture neuronal spike discharges (filtered at 150–8,000 Hz, sampling rate 40 kHz) and local field potentials (LFP; filtered at 0.7–400 Hz, sampling rate 1 kHz).
Spike-sorting software was used to eliminate typical high-amplitude interference signals and artifacts via waveform cross-correlation. Subsequent neuronal signal analysis was performed using neural-analysis software. Neurons were classified as active only when they exhibited a spontaneous mean firing rate >2 Hz and maintained a stable signal-to-noise ratio >3:1. The 2 Hz threshold was selected based on the established physiological characteristics of autonomic-related NTS neurons; it effectively excluded predominantly silent cells and low-frequency respiratory-rhythmic bursts, thereby ensuring that the analysis focused on tonically active neurons mediating basal cardiovascular regulation17,18,19,20. Mean neuronal firing frequency and spike discharge raster plots were generated based on these criteria. Energy spectrograms of the 2D LFP and 3D power spectral density (PSD) topographies were constructed to assess neural oscillatory energy characteristics.
Following the recording, the incision was sutured, and the rats were monitored until they fully recovered from anesthesia. Penicillin was administered via intraperitoneal injection, and carprofen (5 mg/kg, s.c.) was administered daily for three consecutive days.
Data-independent acquisition quantitative proteomics analysis
Total protein was extracted with a lysis buffer and quantified by the bicinchoninic acid method. The proteins were denatured, subjected to reductive alkylation, and digested with trypsin at 37 °C for 2 h. The resulting peptides were desalted using a C18 column, concentrated at 45 °C, and resuspended for subsequent mass spectrometry analysis.
Peptides were loaded onto a trap column (5 µm C18, 300 µm x 5 mm) equilibrated with 96% buffer A (0.1% formic acid in water). The peptides were separated along a high-throughput ultra-high-performance liquid chromatography analytical column using a rigorously optimized gradient of buffer A and buffer B (0.1% formic acid in 80% acetonitrile).
Mass spectrometry was performed in positive ion data-independent acquisition (DIA) mode with an electrospray voltage of 1.9 kV. Full mass spectrometer scans were acquired over a mass range of 380 to 980 m/z at a resolution of 240,000, with an automatic gain control (AGC) target of 500% and a maximum injection time of 3 ms. MS/MS spectra were acquired at a resolution of 80,000 (AGC target: 500%; maximum injection time: 3 ms; RF lens amplitude: 40%). Precursor ions were fragmented using higher-energy collisional dissociation with an isolation window of 2 Th and a normalized collision energy of 25% under a defined cycle time of 0.6 s.
Raw mass spectrometry data were processed using DIA-NN software. A spectral library was generated using the internal deep learning algorithm, and the match-between-runs function was applied for quantification against the Rattus norvegicus reference proteome database, with trypsin digestion and up to 2 missed cleavages. The final quantitative protein matrix was filtered using a strict 1% false discovery rate threshold at both the precursor-ion and protein levels.
Bioinformatics analysis and hub gene mining
Bioinformatics analyses and data visualizations were performed primarily using the R programming environment alongside specialized network visualization software. To ensure methodological transparency and reproducibility, all custom R scripts used throughout these analytical processes were provided in the Supplementary File 1. Initial data quality control and overall distribution assessments were performed using the ropls package. Protein identification/quantification overview statistics were compiled; partial least squares discriminant analysis (PLS-DA) was performed across the three groups; orthogonal partial least squares discriminant analysis (OPLS-DA) was performed for pairwise comparisons; and sample correlation heatmaps were generated using the pheatmap package.
Core differentially expressed proteins were screened using thresholds comprising a p-value <0.05, fold change >1.2, and variable importance in projection score >1.0. Double volcano plots were generated using the ggplot2 package, intersections were identified using the ggVennDiagram package, and hierarchical clustering heatmaps were plotted using the pheatmap package to visualize the intersecting proteins. Gene Ontology (GO) and Kyoto Encyclopedia of Genes and Genomes (KEGG) enrichment analyses were performed separately for the upregulated and downregulated proteins using the enrichR package based on the Enrichr database.
All differentially expressed proteins were mapped to the STRING database with a confidence threshold of 0.4 to construct the protein-protein interaction network. The interaction data were imported into network visualization software. The cytoHubba plugin was applied to calculate topological scores, and the top 18 high-scoring genes were extracted based on node color depth. The 18 hub candidates underwent pathway enrichment analysis, and the top 10 most prominent proteins were selected to assess their expression levels across human tissues using the Genotype-Tissue Expression (GTEx) database. The most critical hub gene was identified based on human brain expression levels and network topological scores. The Cistrome Data Browser was used to predict downstream transcription factors and histone modifications associated with the specific hub gene.
Western blot and quantitative polymerase chain reaction
Total protein was extracted from NTS tissues using a lysate mixture containing phenylmethanesulfonyl fluoride lysis buffer, PMSF, and phosphatase inhibitors. The samples were homogenized using an ultrasonic cell disruptor and centrifuged at 13,800 x g for 20 min at 4 °C to collect the supernatants. Protein concentrations were determined using the bicinchoninic acid protein assay kit. A total of 20 µg of protein from each sample was separated by 10% sodium dodecyl sulfate-polyacrylamide gel electrophoresis and subsequently transferred onto polyvinylidene fluoride membranes.
The membranes were blocked with 5% non-fat milk in Tris-buffered saline Tween (TBST) for 1 h at room temperature and incubated overnight at 4 °C with specific primary antibodies targeting Yin Yang 1 (YY1) and β-actin as the housekeeping protein. The membranes were washed with TBST for 5 min three times and incubated with a horseradish peroxidase-conjugated secondary antibody for 1.5 h at room temperature. Target bands were visualized using an enhanced chemiluminescence kit, captured using an imaging system, and quantified relative to β-actin.
Total RNA was extracted from NTS tissues using an RNA extraction reagent. RNA concentration and purity were measured using a spectrophotometer, and first-strand cDNA was synthesized using a reverse transcription kit. Quantitative real-time polymerase chain reaction (PCR) was performed using a SYBR Green PCR kit on a real-time PCR system. The specific primer sequences used for amplification, along with their respective NCBI Reference Sequence accession numbers, were as follows: YY1 (NM_001002271.1), forward 5'-AGCGTTCGTTGAGAGCTCAA-3' and reverse 5'-AGCCTTCGAATGTGCACTGA-3'; DPF2 (NM_001014264.1), forward 5'-TGTGATGACTGTGACCGTGG-3' and reverse 5'-TCCAAACACAGGTGGCAACT-3'; DMAP1 (NM_001007705.1), forward 5'-GGTGTGACATTACGGAGCCA-3' and reverse 5'-TCCAGCAGCATCTGTTCCAG-3'; and glyceraldehyde-3-phosphate dehydrogenase (GAPDH) (NM_017008.4), forward 5'-GGCACAGTCAAGGCTGAGAATG-3' and reverse 5'-ATGGTGGTGAAGACGCCAGTA-3'. Relative mRNA expression levels were calculated using the 2-ΔΔCt method and normalized against the internal reference gene GAPDH.
Statistical analysis
All experimental data were analyzed using statistical software and presented as the mean ± standard deviation (SD). Normality was assessed using the Shapiro-Wilk test, and homogeneity of variance was evaluated using the Brown-Forsythe test.
For comparisons between two independent groups, the Student's t-test or the paired t-test was used for data that met the normality criteria. Data that failed to satisfy normality assumptions were analyzed using the Mann-Whitney U test or the Wilcoxon signed-rank test. For comparisons among multiple groups, one-way analysis of variance, followed by the Holm-Sidak post hoc test, was used when the assumptions of normality and homogeneity were met. The Kruskal-Wallis H test, followed by the Dunn post hoc test, was used when these assumptions were not met.
Correlations were assessed using the Pearson correlation coefficient calculated using the Hmisc package in R. Corresponding p-values were adjusted using the Benjamini-Hochberg false discovery rate method via the stats package to control for the inflated type I error rate due to multiple testing. General statistical significance was set at p <0.05.
Results
Electroacupuncture improves cardiac function and mitigates myocardial injury in chronic heart failure rats
To assess the effects of EA on CHF, the rat model was established via LAD coronary artery ligation, followed by specific EA or Sham EA interventions. Systematic evaluations, including echocardiography, biochemical assays, and histological staining, were conducted (Figure 2A). Functionally, the CHF group exhibited ventricular dilation and contractility impairment. EA treatment ameliorated the reductions in LVEF and LVFS observed in CHF rats, while the Sham EA group exhibited cardiac function levels comparable to those of the CHF group (Figure 2B and Figure 2C).
Furthermore, EA lowered serum NT-proBNP and cTnT levels, indicating reduced cardiac burden and mitigated myocardial injury. In contrast, the Sham EA group showed biochemical parameters similar to those of the CHF group (Figure 2E,F). Histological analysis showed that the CHF group exhibited myocardial structural damage and fibrosis. EA treatment improved myocardial architecture and reduced CVF, whereas the Sham EA group retained pathological changes and CVF levels similar to those in the CHF group (Figure 2D). Overall, EA exerted cardioprotective effects against CHF, whereas the Sham EA intervention did not produce similar therapeutic outcomes.
Electroacupuncture activates neurons in the nucleus tractus solitarius of rats with chronic heart failure
To determine whether the NTS mediates the central response to EA treatment, neuronal activation was assessed by staining for c-Fos, a marker of neural excitation. Immunofluorescence imaging (Figure 3A) and quantitative cell counts (Figure 3B) revealed that the number of c-Fos-positive neurons in the NTS was lower in the CHF group compared to the Sham group. However, EA treatment increased c-Fos expression to levels comparable to the Sham baseline. In parallel with the peripheral functional outcomes, the Sham EA group exhibited similar c-Fos expression levels compared to the CHF group.
To evaluate the functional state of these NTS neurons, in vivo electrophysiological signals were recorded. The spike discharge traces (Figure 3C) and the quantitative mean firing rate (Figure 3D) aligned with the histological findings. The spontaneous firing frequency of NTS neurons was reduced under CHF conditions. In contrast, EA intervention elevated the neuronal firing rate, whereas the Sham EA procedure produced no such electrophysiological changes.
This pattern of neural activation was supported by the local field potential analysis. As depicted in the 2D LFP color scale spectrograms and the 3D power spectral density maps (Figure 3E), the neural oscillatory energy within the NTS was attenuated during the CHF state. Following EA treatment, there was an increase in power intensity across the neural frequency spectrum, indicating network activation, which was absent in the Sham EA cohort.
To examine the physiological relevance of this central activation, the Pearson correlation analysis was performed, integrating peripheral cardiac metrics with central NTS neuronal activity (Figure 3F). The analysis demonstrated that the mean firing rate and c-Fos expression within the NTS were positively correlated with the LVEF. Conversely, these central neural activity indicators exhibited a negative correlation with the serum heart failure marker NT-proBNP. These correlations indicate that the neural activation of the NTS modulated by EA is linked to its peripheral cardioprotective efficacy.
Electroacupuncture alters the global proteomic profile in the nucleus tractus solitarius
Due to the lack of therapeutic efficacy observed in the Sham EA group during the preceding functional evaluations, the proteomics phase included only the Sham, CHF, and EA groups. Prior to tissue collection, 12 rats per group underwent echocardiographic assessment to evaluate the therapeutic effects of EA, and these results are presented in Supplementary Figure 1A. Following this evaluation, 6 biological replicates from each group underwent mass spectrometry-based quantitative proteomic analysis.
Quality control and multivariate analyses were performed to assess the reliability and overall distribution of the proteomic data. The total number of identified proteins was 5,914 in the Sham group, 5,980 in the CHF group, and 5,836 in the EA group, indicating comparable protein detection across the three experimental groups (Figure 4A and Supplementary Table 1). Partial least squares discriminant analysis demonstrated clear separation among the Sham, CHF, and EA groups, indicating distinct global proteomic profiles associated with the disease state and EA intervention (Figure 4B).
Pairwise orthogonal partial least squares discriminant analysis further demonstrated separation between the Sham and CHF groups (Figure 4C) and between the CHF and EA groups (Figure 4D). The corresponding permutation tests supported the reliability of the respective models. In addition, the Pearson correlation heatmap showed high within-group correlations and distinct inter-group patterns among the proteomic samples, supporting the reproducibility of the biological replicates (Figure 4E). Collectively, these quality control and multivariate analyses indicated that the proteomic dataset was sufficiently robust for subsequent identification and bioinformatics analysis of differentially expressed proteins.
Electroacupuncture modulates core differentially expressed proteins and signaling pathways in the nucleus tractus solitarius
To explore the molecular targets of EA, the protein alterations were analyzed. The volcano plots displayed the distribution of upregulated and downregulated proteins in the Sham versus CHF and the CHF versus EA comparisons (Figure 5A, Supplementary Table 2, and Supplementary Table 3). To identify the therapeutic targets, an intersection analysis was performed. As illustrated in the Venn diagrams, 58 proteins upregulated in the CHF group but downregulated following EA treatment were identified alongside 27 proteins downregulated in the CHF group and upregulated by EA intervention (Figure 5B and Supplementary Table 4). This screening yielded a total of 85 core differentially expressed proteins. The hierarchical clustering heatmap demonstrated that the EA intervention modulated the abnormal expression patterns of these 85 proteins, shifting their profiles toward the Sham baseline (Figure 5C).
To determine the biological functions of these core targets, GO and KEGG enrichment analyses were conducted separately for the two distinct protein subsets. For the subset of 58 proteins downregulated by EA, the GO bubble plot demonstrated significant enrichment in biological processes, including extracellular matrix organization and extracellular structure organization, alongside cellular components such as external encapsulating structure and collagen trimer, and molecular functions, including collagen binding and glutamate receptor binding (Figure 5D and Supplementary Table 5). Subsequent KEGG pathway analysis, visualized using chord and Sankey diagrams, revealed that these 58 proteins participate in cascades including protein digestion and absorption, the cytoskeleton in muscle cells, and the TGF-β signaling pathway (Figure 5E and Supplementary Table 6). These topological visualizations highlighted specific proteins, including COL3A1, COL14A1, MYH11, DCN, and DPF2, as prominent nodes linking multiple pathological pathways.
Conversely, functional annotation was performed for the subset of 27 proteins upregulated by the EA intervention. The GO enrichment analysis indicated involvement in biological processes such as the regulation of cell growth and the positive regulation of DNA-templated transcription elongation, as well as molecular functions including calcium-dependent protein binding and tetrapyrrole binding (Figure 5F and Supplementary Table 7). The corresponding KEGG chord and Sankey diagrams mapped these proteins to critical pathways, including ATP-dependent chromatin remodeling and the polycomb repressive complex (Figure 5G and Supplementary Table 8). Notably, this network mapping isolated key proteins such as YY1, E2F2, and ENTPD5, bridging these central signaling networks. This comprehensive functional stratification laid the structural foundation for the subsequent core target validation.
Network topology and expression profiling identify YY1 as a candidate target associated with the effects of electroacupuncture intervention
To determine the hub gene among the 85 differentially expressed proteins, a protein-protein interaction network was constructed. Topological analysis identified 18 nodes with high connectivity scores (Figure 6A and Supplementary Table 9). Subsequently, the KEGG pathway analysis was conducted specifically for these 18 hub proteins. The corresponding chord and Sankey diagrams mapped the complex relationships between these hubs and enriched signaling cascades, including ATP-dependent chromatin remodeling, the polycomb repressive complex, and the TGF-β signaling pathway (Figure 6A and Supplementary Table 10). Based on this functional profiling, the top 10 prominently enriched proteins were selected for further screening. Because the therapeutic target of EA is located in the central nervous system, these 10 candidates were evaluated utilizing the GTEx human tissue expression database (Figure 6B and Supplementary Figure 1B–J). The results indicated that only YY1 (Figure 6B), DMAP1(Supplementary Figure 1C), and DPF2 (Supplementary Figure 1D) were expressed in brain tissues.
To isolate the highly responsive candidate target of EA, in vivo molecular experiments utilizing NTS tissues were performed. Quantitative real-time PCR was utilized to evaluate the transcriptional responsiveness of the 3 brain-enriched candidates. The mRNA expression of YY1 was reduced under CHF conditions and elevated following EA treatment, whereas the mRNA expression levels of DPF2 and DMAP1 exhibited no statistically significant changes across the experimental groups (Figure 6C). This transcriptional screening excluded DPF2 and DMAP1 from further validation and supported YY1 as the primary responsive candidate. Subsequent Western blot analysis indicated that YY1 protein levels were reduced in the CHF group relative to the Sham baseline, whereas the EA intervention counteracted this trend, increasing YY1 protein expression (Figure 6D and Figure 6E). These experimental results indicate that EA upregulates YY1 expression within the NTS.
To investigate the upstream regulatory mechanisms governing YY1 expression, its related histone modifications and transcription factors were analyzed. It is important to note that these findings are based exclusively on computational bioinformatics predictions derived from the Cistrome Data Browser and do not represent direct experimental ChIP-seq validation. The epigenetic prediction highlighted histone modifications, including H3K27ac, H3K27me3, and H3K4me3, with high regulatory potential scores for the YY1 locus (Figure 6F). Concurrently, the regulatory potential scoring identified transcription factors such as CDK9, PRDM1, and ELL2 as upstream regulators of YY1 (Figure 6G). These bioinformatics predictions outline the potential epigenetic and transcriptional networks controlling YY1 expression in the NTS.
In summary, the presented data demonstrate that EA intervention effectively improves systemic cardiac function and mitigates myocardial injury in CHF rats. These peripheral cardioprotective effects are centrally accompanied by the restoration of neuronal firing activity and neural oscillatory energy within the NTS. Furthermore, quantitative proteomic screening identified 85 core differentially expressed proteins and highlighted the transcription factor YY1 as a highly responsive candidate target. Collectively, these findings suggest that the therapeutic efficacy of EA against CHF is closely associated with the restoration of NTS neural function and that the upregulation of YY1 may be involved in this central neurobiological process.
Data Availability
All data generated and analyzed to support the findings of this study are included within the manuscript and its Supplementary File 1. To comply with the requirement for public data accessibility, all available raw data underlying this research have been deposited in the Zenodo public repository and are freely accessible via the following link: https://doi.org/10.5281/zenodo.22030720. Additional supporting data are available from the corresponding authors upon reasonable request.
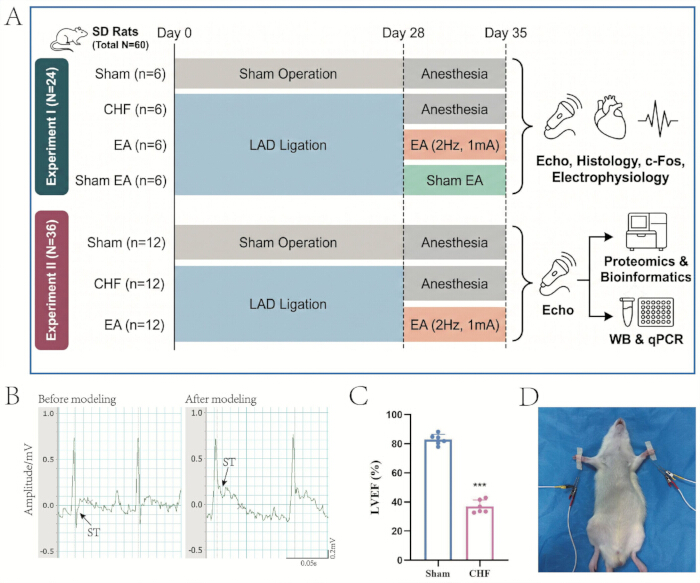
Figure 1: Experimental design, establishment of the chronic heart failure rat model, and electroacupuncture intervention. (A) Overall experimental flowchart, including the timeline and group allocation for the two independent experimental series. (B) Representative electrocardiogram recordings before and after the LAD coronary artery ligation, with arrows indicating the ST-segment elevation confirming myocardial ischemia. (C) Quantitative analysis of the LVEF 4 weeks post-surgery to confirm successful modeling (biological replicates n = 6, mean ± SD). ***p < 0.001 vs. the Sham group. (D) EA intervention at the bilateral HT7 acupoints. Please click here to view a larger version of this figure.
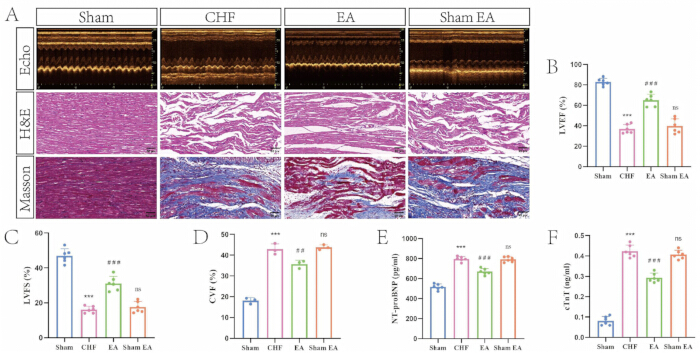
Figure 2: Electroacupuncture improves cardiac function and attenuates myocardial injury in rats with chronic heart failure. (A) Representative M-mode echocardiograms alongside hematoxylin and eosin and Masson trichrome staining images of myocardial tissues across the 4 experimental groups (scale bar = 50 µm). (B) Quantitative analysis of the LVEF across the groups (biological replicates n = 6, mean ± SD). ***p < 0.001 vs. the Sham group; ###p < 0.001 vs. the CHF group; ns, not significant vs. the CHF group. (C) Quantitative analysis of the LVFS across the groups (biological replicates n = 6, mean ± SD). ***p < 0.001 vs. the Sham group; ###p < 0.001 vs. the CHF group; ns, not significant vs. the CHF group. (D) Quantitative analysis of the CVF across the groups (biological replicates n = 3, mean ± SD). ***p < 0.001 vs. the Sham group; ##p < 0.01 vs. the CHF group; ns, not significant vs. the CHF group. (E) Quantitative analysis of serum NT-proBNP levels across the groups (biological replicates n = 6, mean ± SD). ***p < 0.001 vs. the Sham group; ###p < 0.001 vs. the CHF group; ns, not significant vs. the CHF group. (F) Quantitative analysis of serum cTnT levels across the groups (biological replicates n = 6, mean ± SD). ***p < 0.001 vs. the Sham group; ###p < 0.001 vs. the CHF group; ns, not significant vs. the CHF group. Please click here to view a larger version of this figure.
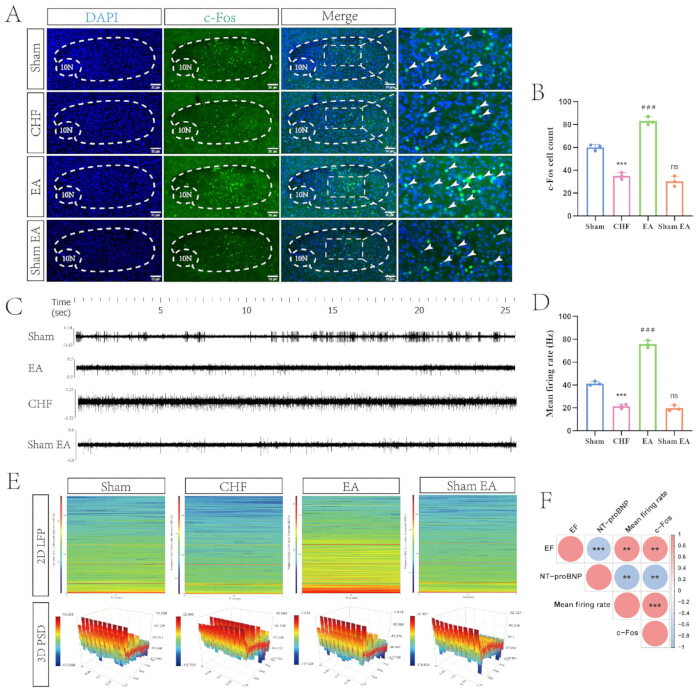
Figure 3: Electroacupuncture restores neuronal activity in the nucleus tractus solitarius in rats with chronic heart failure. (A) Representative immunofluorescence images of c-Fos expression in the NTS across the groups. Nuclei are counterstained with DAPI, and c-Fos-positive cells are stained green. The dashed lines outline the anatomical region, and white arrowheads indicate representative c-Fos positive neurons (scale bar = 30 µm). (B) Quantitative analysis of c-Fos positive cell counts across the groups (biological replicates n = 3, mean ± SD). ***p < 0.001 vs. the Sham group; ###p < 0.001 vs. the CHF group; ns, not significant vs. the CHF group. (C) Representative in vivo electrophysiological spike discharge traces of the NTS across the groups. (D) Quantitative analysis of the mean neuronal firing rate across the groups (biological replicates n = 3, mean ± SD). ***p < 0.001 vs. the Sham group; ###p < 0.001 vs. the CHF group; ns, not significant vs. the CHF group. (E) Representative 2D local field potential spectrograms and 3D power spectral density topographies illustrating neural oscillatory energy within the NTS. (F) Correlation matrix evaluating the relationships between peripheral cardiovascular phenotypes and central neural activity parameters. Red and blue circles indicate positive and negative correlations, respectively. **p < 0.01; ***p < 0.001. Please click here to view a larger version of this figure.
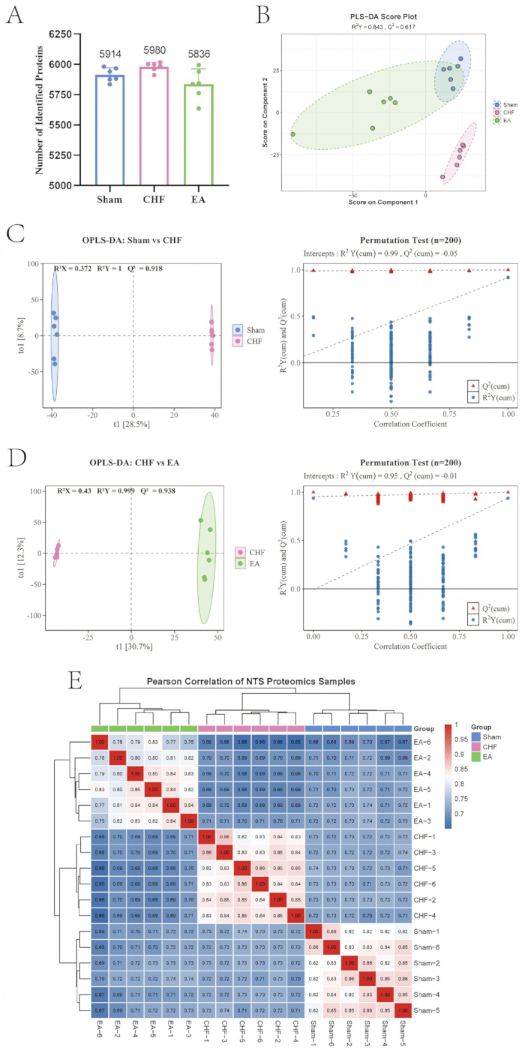
Figure 4: Quality control and multivariate statistical evaluation of the proteomic profiles in the nucleus tractus solitarius. (A) Quantitative overview of the identified proteins across the 3 experimental groups (biological replicates n = 6). (B) Partial least squares discriminant analysis score plot illustrating the overall spatial distribution and separation among the groups. (C) Orthogonal partial least squares discriminant analysis score plot and the corresponding permutation test validating the model reliability for the Sham versus CHF comparison (200 permutations). (D) Orthogonal partial least squares discriminant analysis score plot and the corresponding permutation test validating the model reliability for the CHF versus EA comparison (200 permutations). (E) Hierarchical clustering heatmap of Pearson correlation coefficients evaluating the intra-group reproducibility and inter-group variance across all proteomic samples. Please click here to view a larger version of this figure.
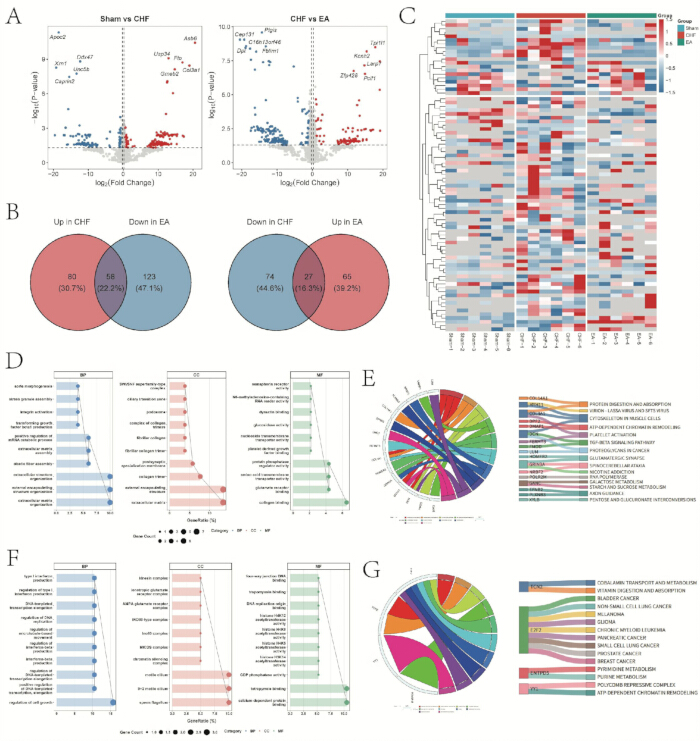
Figure 5: Identification and functional enrichment analysis of core differentially expressed proteins modulated by electroacupuncture in the nucleus tractus solitarius. (A) Volcano plots illustrating the distribution of upregulated and downregulated proteins in the Sham versus CHF and CHF versus EA comparisons. (B) Venn diagrams mapping the intersection analysis to identify the downregulated and upregulated core proteins following the EA intervention. (C) Hierarchical clustering heatmap of the expression profiles of the core differentially expressed proteins. (D) GO bubble plots detailing the enriched biological processes, cellular components, and molecular functions for the downregulated protein subset. (E) KEGG chord and Sankey diagrams mapping the signaling pathways enriched by the downregulated proteins. (F) GO bubble plots detailing the enriched biological processes, cellular components, and molecular functions for the upregulated protein subset. (G) KEGG chord and Sankey diagrams mapping the signaling pathways enriched by the upregulated proteins. Please click here to view a larger version of this figure.
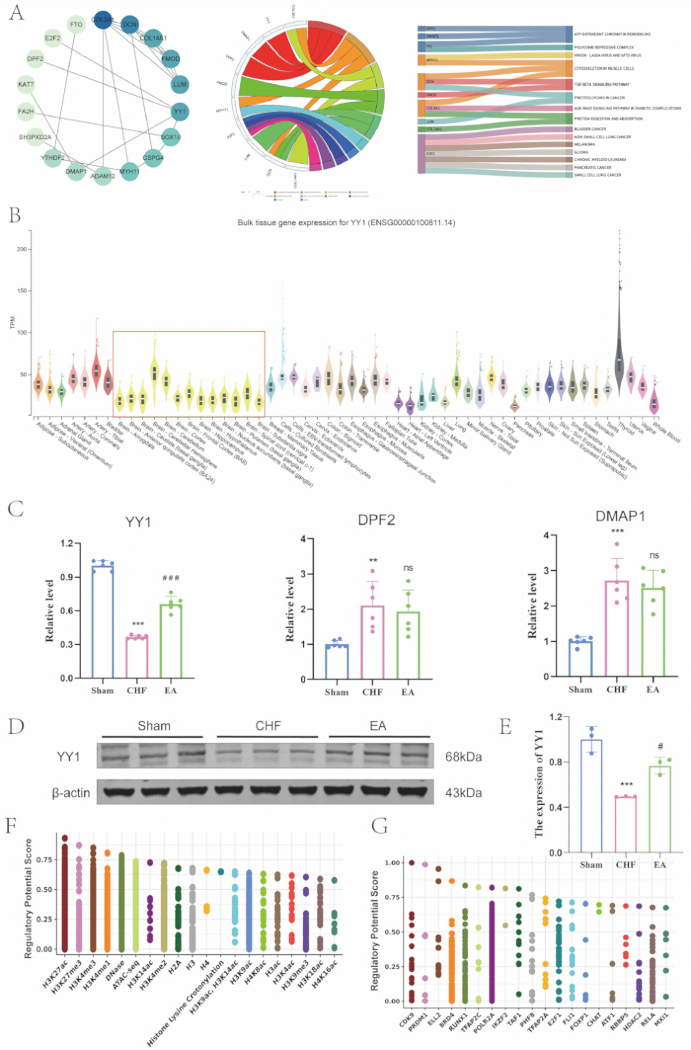
Figure 6: Network topology, tissue expression profiling, and molecular validation identify YY1 as a candidate target associated with electroacupuncture. (A) Protein-protein interaction network, chord diagram, and Sankey diagram of the identified hub proteins. (B) Human tissue expression profile of YY1 derived from the GTEx database, with the red box highlighting brain tissues. (C) Quantitative analysis of YY1, DPF2, and DMAP1 mRNA expression in the NTS across the groups (biological replicates n = 6, mean ± SD). **p < 0.01, ***p < 0.001 vs. the Sham group; ###p < 0.001 vs. the CHF group; ns, not significant vs. the CHF group. (D) Representative Western blot bands of YY1 and β-actin in the NTS across the groups. (E) Quantitative analysis of YY1 protein expression across the groups (biological replicates n = 3, mean ± SD). ***p < 0.001 vs. the Sham group; #p < 0.05 vs. the CHF group. (F) Bioinformatics prediction of epigenetic histone modifications regulating the YY1 locus based on regulatory potential scores. (G) Bioinformatics prediction of upstream transcription factors regulating the YY1 locus based on regulatory potential scores. Please click here to view a larger version of this figure.
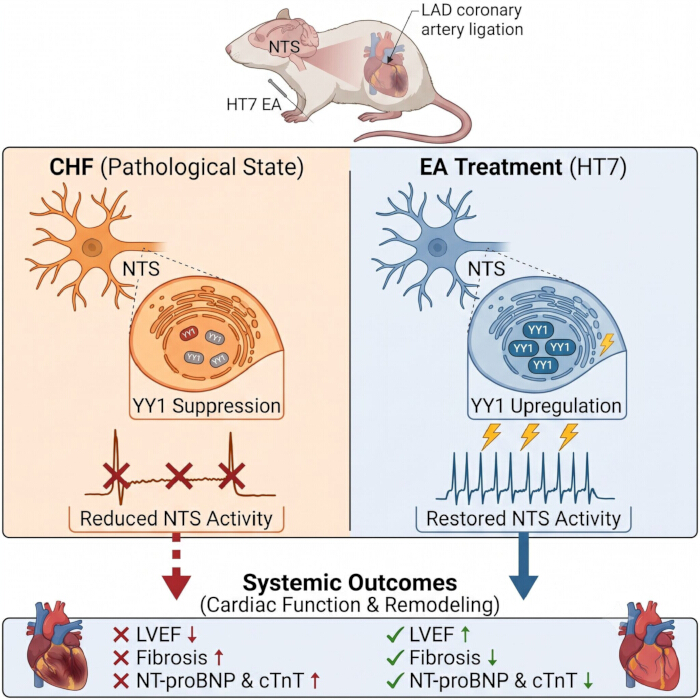
Figure 7: Proposed model of the association between electroacupuncture at HT7, YY1 upregulation, restored neuronal activity in the nucleus tractus solitarius, and improved chronic heart failure. (Left) Pathological State: In the CHF model induced by LAD coronary artery ligation, neuronal activity within the NTS is reduced, accompanied by the suppression of the transcription factor YY1. This central neural inhibition is associated with pathological cardiac remodeling, manifested as decreased LVEF, increased myocardial fibrosis, and elevated serum heart failure markers. (Right) EA Treatment: EA intervention at the HT7 acupoint upregulates YY1 expression in the NTS and restores neuronal firing. This central neuromodulation exerts cardioprotective effects, attenuating pathological remodeling and improving systemic cardiac function. Please click here to view a larger version of this figure.
Supplementary Figure 1: Cardiac function assessment of the proteomic cohort and human tissue expression profiles of candidate hub genes. (A) Quantitative analysis of the LVEF and LVFS across the groups (biological replicates n = 12, mean ± SD). ***p < 0.001 vs. the Sham group; ###p < 0.001 vs. the CHF group. (B-J) Human tissue expression profiles of candidate hub genes derived from the GTEx database including COL3A1 (B), DMAP1 (C), DPF2 (D), FMOD (E), MYH11 (F), E2F2 (G), LUM (H), DCN (I), and COL14A1 (J).Please click here to download this file.
Supplementary Table 1: Comprehensive identification and quantification matrix of the global proteome in the nucleus tractus solitarius. This table presents the complete quantitative proteomics dataset across all experimental cohorts. Important columns include Protein ID (UniProt accession number), Gene (gene symbol), First.Protein.Description (functional annotation), and the normalized protein intensity values for each biological replicate across the Sham, CHF, and EA groups (n = 6 per group).Please click here to download this file.
Supplementary Table 2: OPLS-DA variable importance in projection scores for proteins in the Sham versus CHF comparison. This table lists the features that distinguish the Sham and CHF groups according to the OPLS-DA model. The key columns include feature (representing the identifier of the specific protein/gene) and the VIP_value (Variable Importance in Projection), which indicates the contribution of each feature to the group separation (threshold VIP > 1.0).Please click here to download this file.
Supplementary Table 3: OPLS-DA variable importance in projection scores for proteins in the CHF versus EA comparison. This table lists the features distinguishing the CHF and EA groups based on the OPLS-DA model. Similar to Table S2, it includes the feature column and the corresponding VIP_value, highlighting the features most responsive to the EA intervention.Please click here to download this file.
Supplementary Table 4: Detailed list of the 85 core differentially expressed proteins modulated by electroacupuncture. This table provides the intersection of proteins that were significantly altered by CHF and subsequently reversed by the EA intervention. Important columns include Protein_ID, Gene, log2FC (log2 Fold Change indicating expression variation), P_value for statistical significance (threshold p < 0.05), and VIP_value evaluating model contribution.Please click here to download this file.
Supplementary Table 5: Gene Ontology enrichment analysis of the downregulated core protein subset. This table displays the Gene Ontology (GO) functional annotation for the 58 proteins downregulated by EA. Important columns include ONTOLOGY (categorized into Biological Process [BP], Cellular Component [CC], and Molecular Function [MF]), functional Description, p.adjust (adjusted p-value for multiple testing), and geneID, which maps to the specific genes enriched in each term.Please click here to download this file.
Supplementary Table 6: Kyoto Encyclopedia of Genes and Genomes pathway enrichment analysis of the downregulated core protein subset. This table illustrates the enriched signaling cascades for the 58 downregulated proteins. Key columns include the pathway Term, the Adjusted p-value indicating the statistical significance of the enrichment, and the specific intersecting Genes involved in each pathway.Please click here to download this file.
Supplementary Table 7: Gene Ontology enrichment analysis of the upregulated core protein subset. This table displays the Gene Ontology (GO) functional annotation for the 27 proteins upregulated by EA. The format and column definitions (ONTOLOGY [BP, CC, MF], Description, p.adjust, geneID) are identical to those detailed in Table S5.Please click here to download this file.
Supplementary Table 8: Kyoto Encyclopedia of Genes and Genomes pathway enrichment analysis of the upregulated core protein subset. This table illustrates the enriched signaling cascades for the 27 upregulated proteins. The format and column definitions (Term, Adjusted p-value, Genes) are identical to those detailed in Table S6.Please click here to download this file.
Supplementary Table 9: Topological connectivity scores of the 18 hub proteins derived from the protein-protein interaction network. This table summarizes the network topological parameters used to identify the core hub genes. Key columns include the gene name and central network metrics such as Degree, Betweenness Centrality, and Closeness Centrality, which quantify each node's relative importance and connectivity within the biological network.Please click here to download this file.
Supplementary Table 10: Kyoto Encyclopedia of Genes and Genomes pathway enrichment analysis of the 18 network hub proteins. This table presents the specific signaling pathways enriched exclusively by the 18 identified hub proteins. Key columns include the pathway Term, Adjusted p-value for significance, and the respective Genes driving the functional enrichment.Please click here to download this file.
Supplementary File 1: R scripts used for data analysis and visualization and uncropped Western blot images. The supplementary file contains the R scripts used for Pearson correlation analysis, double volcano plot generation and identification of EA-reversed proteins, Gene Ontology (GO) enrichment analysis, hierarchical clustering heatmap generation, Kyoto Encyclopedia of Genes and Genomes (KEGG) enrichment visualization, orthogonal partial least squares discriminant analysis (OPLS-DA) and permutation testing, partial least squares discriminant analysis (PLS-DA), proteomic sample correlation heatmap generation, and Venn diagram analysis.Please click here to download this file.
Discussion
The present study investigated the central mechanisms of EA at the HT7 acupoint in the rat model of CHF. Physiological and histological data indicated that EA improved LVEF and attenuated myocardial fibrosis. In parallel with these peripheral changes, in vivo electrophysiological recordings and neural mapping supported that EA restored neuronal firing rates within the NTS. Through mass spectrometry-based proteomics, the molecular landscape of the NTS was mapped, and 85 differentially expressed proteins whose abnormal expression patterns were modulated by the intervention were identified. Subsequent topological analysis and tissue expression profiling isolated the transcription factor YY1 as a candidate biological target. Molecular validation indicated that EA upregulates YY1 expression. These findings construct a central molecular network for EA and suggest YY1 as a potential neurobiological target linking central autonomic regulation with the amelioration of CHF. The comprehensive central mechanisms are summarized in Figure 7.
The NTS serves as the integration center for central cardiovascular reflexes and autonomic regulation21,22. In the context of cardiovascular diseases, CHF involves sustained autonomic imbalance characterized by sympathetic overactivation and vagal withdrawal23. During the pathophysiological progression of this condition, the sensitivity of peripheral baroreceptors decreases, which reduces excitatory afferent inputs to the NTS24. Consequently, this neural blunting leads to a diminished activation of the caudal ventrolateral medulla and a subsequent disinhibition of the rostral ventrolateral medulla, culminating in excessive central sympathetic outflow25. In parallel with these mechanisms, the electrophysiological and histological data indicated that the spontaneous firing frequency and c-Fos expression of NTS neurons were reduced in the CHF state. As a targeted neuromodulation approach, EA-generated somatosensory afferent signals are theoretically proposed to be transmitted through peripheral nerves to the dorsal horn of the spinal cord and to ascend to brainstem structures, including the NTS26. The results indicated that EA intervention at the HT7 acupoint increased neural oscillatory energy and restored neuronal firing rate in this brain region. Physiologically, the restored NTS neuronal activity facilitates activation of inhibitory interneurons in the medulla, thereby suppressing hyperactive sympathetic premotor neurons while concurrently enhancing parasympathetic efferent signals27. Linking these central neural mechanisms to peripheral cardiovascular phenotypes, the correlation analysis supported that this central neural activation was positively associated with LVEF and negatively associated with the peripheral heart failure marker NT-proBNP. These findings indicate that EA may exert its peripheral cardioprotective effects by alleviating the pathological inhibition of NTS neurons and promoting central autonomic homeostasis.
To elucidate the molecular pathways underlying this central neuromodulation, the proteomic landscape of the NTS was analyzed. Mass spectrometry-based proteomics identified 85 proteins whose expression patterns were modulated by the intervention. Functional stratification revealed that a subset of 58 proteins downregulated by EA is prominently involved in extracellular matrix organization and the transforming growth factor β-signaling pathway. The extracellular matrix in the central nervous system forms an organized lattice, including perineuronal nets that physically enwrap synaptic terminals and regulate local ion homeostasis28. Under chronic pathological stress, such as heart failure, aberrant extracellular matrix deposition creates a restrictive microenvironment within the brainstem29. This structural remodeling physically impedes synaptic structural plasticity and maintains neural circuits in a state of sympathetic hyperactivity30. By modulating the expression of structural proteins, such as COL3A1 and COL14A1 alongside DCN, EA remodels this pathological extracellular barrier. Concurrently, the enrichment of related signaling cascades—categorized under the "cytoskeleton in muscle cells" KEGG pathway, which indicates general structural and integrin-mediated alterations rather than implying the actual presence of myocytes within the NTS—suggests that extracellular changes are transmitted into the intracellular compartment31. This mechanotransduction signaling restores the dynamic turnover of dendritic spines and regulates synaptic transmission and efficacy in the autonomic reflex arc32.
Beyond extracellular structural reorganization, functional annotation of the 27 proteins upregulated by the intervention indicated the involvement of ATP-dependent chromatin remodeling. Sustained cardiovascular autonomic imbalance is maintained by epigenetic restrictions, where condensed chromatin limits the accessibility of promoter regions for genes regulating neural inhibition33. ATP-dependent chromatin remodeling complexes use energy from ATP hydrolysis to slide or evict nucleosomes, thereby opening genomic loci for active transcription34. The enrichment of this pathway, alongside the positive regulation of DNA-templated transcription elongation, indicates that EA acts at the epigenetic level to remodel disease-associated transcriptional memory35. The structural relaxation of the extracellular microenvironment translates into nuclear epigenetic modifications, facilitating the coordinated transcription of neuroprotective gene networks bridged by key proteins such as YY1 and E2F236,37. To systematically isolate the biological target mediating the therapeutic efficacy of EA, a stepwise screening strategy was applied. The 85 differentially expressed proteins were filtered through topological network mapping and pathway enrichment analysis to identify 10 prominent hub candidates. Subsequent tissue expression profiling verified that only YY1 and DPF2, alongside DMAP1, are expressed in human brain tissues. In vivo molecular validation further excluded DPF2 and DMAP1 due to a lack of transcriptional responsiveness, confirming YY1 as a highly responsive candidate target. YY1 is a zinc-finger transcription factor that exerts control over central nervous system development and neuronal plasticity38. In mature neural circuits, YY1 functions as a neuroprotective regulator by maintaining mitochondrial homeostasis and mitigating oxidative stress39. During the pathological progression of CHF, sustained hemodynamic stress and peripheral inflammation induce metabolic dysfunction and structural damage in brainstem neurons40. The experimental data indicated that YY1 expression is suppressed in the NTS under CHF conditions, whereas EA intervention counteracted this pathological suppression. Based strictly on computational bioinformatics predictions rather than empirical validation, YY1 is hypothesized to interact with active histone modifications, such as H3K27ac and H3K4me3, to orchestrate the transcription of downstream neuroprotective gene networks 41. The restoration of YY1 activity may facilitate repair of neuronal metabolic pathways and promote the structural integrity of synaptic connections. Consequently, the modulated NTS neurons improve their capacity to process peripheral baroreflex inputs and exert inhibitory control over descending sympathetic premotor pathways, which ameliorates the cardiovascular deterioration associated with CHF42.
Despite these discoveries, several methodological limitations warrant rigorous consideration. First, the current experimental design relied on correlational omics and expression profiling without direct functional evidence. Future investigations must incorporate targeted genetic manipulations, such as viral vector-mediated knockdown or overexpression within the NTS, alongside empirical ChIP-seq or CUT&Tag assays, to definitively establish the causal role of YY1 and validate its downstream epigenetic networks. Second, excluding the Sham EA cohort from the proteomics phase limits our ability to definitively rule out molecular signatures induced by nonspecific somatosensory stimulation. However, comparing the CHF and EA groups relative to the Sham baseline is considered sufficient to isolate EA-specific molecular changes in the current design. This is because all non-intervention cohorts, specifically the Sham and CHF groups, underwent strict baseline standardization of daily isoflurane anesthesia exposure, which effectively minimized the most profound non-specific neurological stress confounders. Furthermore, our initial functional data showed that Sham EA did not elicit significant cardiovascular or neural activation relative to the CHF group, suggesting that superficial somatosensory stimulation without electrical current does not reach the threshold required to drive substantial central molecular reprogramming. Third, the study lacks standard non-acupoint control groups, which prevents the definitive confirmation of HT7 acupoint specificity. Furthermore, the proposed HT7-to-NTS afferent neural pathways remain speculative without direct neural tracing or nerve-blockade validation. Finally, the in vivo electrophysiology evaluated global NTS activity at a single time point without distinguishing between specific excitatory and inhibitory neuronal subpopulations, nor did it assess long-term neural plasticity. Subsequent research must address these critical gaps to refine the central neurobiological mechanisms.
Ultimately, by integrating these findings while acknowledging their correlational nature, this research provides a valuable molecular framework indicating that EA mitigates pathological cardiac remodeling by restoring NTS neuronal function. These data highlight YY1 as a highly responsive candidate target for central cardiovascular neuromodulation, offering novel neurobiological insights for the clinical application of acupuncture therapy in heart failure management.
Disclosures
All authors declare that they have no conflicts of interest. The authors also declare that no artificial intelligence tools were utilized in any part of the manuscript preparation process.
Acknowledgements
We would like to express our sincere gratitude to all the researchers who contributed to this study and respectfully acknowledge the sacrifice of the experimental animals. This work was supported by the National Key Research and Development Program of China (grant no. 2022YFC3500500 and 2022YFC3500502) and the Xu Nenggui University-Level Talent Support Program (grant no. DT2400000222). The funders had no role in the study design, data collection and analysis, decision to publish, or preparation of the manuscript.
Materials
| Name | Company | Catalog Number | Comments |
|---|---|---|---|
| Adult male Sprague-Dawley rats | Liaoning Changsheng Biotechnology Co., Ltd. | No. SCXK (LIAO) 2025-0001 | RGD_70508 |
| Acupuncture needles | Suzhou Tianxie Acupuncture Instrument Co., Ltd. | — | — |
| Antifade mounting medium with DAPI | Aibixin Biotechnology Co., Ltd. | abs9235-25ml | — |
| Anti-YY1 primary antibody | Proteintech Group, Inc | 66281-1-Ig | AB_2881664 |
| Anti-Beta Actin primary antibody | 66009-1-Ig | AB_2687938 | |
| Bovine serum albumin (BSA) | Sigma Odellie Trading Co., Ltd. | V900933 | — |
| BCA protein assay kit | Shanghai Biyuntian Biotechnology Co., Ltd. | P0012S | — |
| c-Fos (9F6) rabbit mAb | Sai Xin Tong Biological Reagents Co., Ltd. | 2250S | AB_2247211 |
| Cytoscape | The Cytoscape Consortium | version 3.2.1 | SCR_003032 |
| ChamQ Universal SYBR qPCR Master Mix | Vazyme Biotech Co., Ltd. | Q711-02 | — |
| Electroacupuncture apparatus | Nanjing Jisheng Medical Technology Co., Ltd. | HANS-200A | — |
| Eight-channel (2 × 4) microelectrode array | Kewa Suzhou Medical Technology Co., Ltd. | - | — |
| ELISA kit (NT-proBNP) | Wuhan Enzyme Immuno-Biotechnology Co., Ltd. | MM-0329R1 | — |
| ELISA kit (cTnT) | MM-0795R2 | — | |
| Enhanced chemiluminescence kit | Proteintech Group, Inc | PK10001 | — |
| Goat anti-rabbit IgG | Aimee Technology Co., Ltd. | 111-545-003 | AB_2338046 |
| HRP-conjugated Goat Anti-Mouse IgG secondary antibody | BeiJing Cowin Biotech Co.,Ltd. | CW0102 | N/A |
| HiScript III RT SuperMix | Vazyme Biotech Co., Ltd. | R323-01 | — |
| ImageJ software | National Institutes of Health | version 4.0 | SCR_003070 |
| Imaging system | Bio-Rad Laboratories, Inc | ChemiDoc MP | |
| Multi-channel small animal anesthesia machine | RWD Life Science Co., Ltd | R510-22-10 | — |
| Microscope | Olympus Optical Co., Ltd. | DP72 | — |
| NeuroExplorer software | Beijing Plexon Technology Co., Ltd. | version 5.0 | SCR_001818 |
| Offline Sorter software | Beijing Plexon Technology Co., Ltd. | version 4.7.2 | SCR_000012 |
| Orbitrap Astral | Thermo Fisher Scientific | — | — |
| Powerlab standard limb II lead system | AD Instruments International Trading Co., Ltd. | ML118 | — |
| PepMap Neo Trap Column | Thermo Fisher Scientific | — | — |
| Phosphatase inhibitors | Shanghai Biyuntian Biotechnology Co., Ltd. | P1081 | — |
| R software | — | version 4.5.2 | SCR_001905 |
| RIPA lysis buffer | Yeasen Biotechnology Co., Ltd. | 20115ES60 | — |
| RNAiso Plus | TaKaRa Biotechnology Co., Ltd. | 9108 | — |
| Small animal digital ultrasound system | Feiyino Technology Co., Ltd. | VINNO6 Lab | — |
| Statistical software | GraphPad Software | Version 8.0 | SCR_002798 |
| The OmniPlex multichannel acquisition system | Beijing Plexon Technology Co., Ltd. | version 1.20.0 | — |
| Triton X-100 | Beijing Solab Technology Co., Ltd. | 22298142 | — |
| Vanquish Neo UHPLC system | Thermo Fisher Scientific | — | — |
| µPAC Neo High Throughput column | Thermo Fisher Scientific | — | — |
References
- Valente V, et al. The global epidemiology of heart failure: a comprehensive and contemporary review. Eur J Heart Fail. 2026.
- Triposkiadis F, et al. The sympathetic nervous system in heart failure physiology, pathophysiology, and clinical implications. J Am Coll Cardiol. 2009;54(19):1747-62.
- Arshad MS, et al. Sympathetic nervous system in heart failure: targets for treatments. Curr Hypertens Rep. 2025;27(1):20.
- Fan H, et al. The hypotensive role of acupuncture in hypertension: clinical study and mechanistic study. Front Aging Neurosci. 2020;12:138.
- Zuo H, et al. Electroacupuncture alleviates acute myocardial ischemic injury in mice by regulating the β1 adrenergic receptor and post-receptor protein kinase A signaling pathway. Acupunct Med. 2024;42(6):342-55.
- Wu HS, et al. Neural mechanism of HT7 electroacupuncture in myocardial ischemia: critical role of the paraventricular nucleus oxytocin system. Front Neurosci. 2025;19:1678938.
- Kun W, et al. Electroacupuncture ameliorates cardiac dysfunction in myocardial ischemia model rats: a potential role of the hypothalamic-pituitary-adrenal axis. J Tradit Chin Med. 2023;43(5):944-54.
- Xu W, et al. Electroacupuncture ameliorates chronic heart failure: the role of CRH neurons in the paraventricular nucleus of the hypothalamus. Front Neurosci. 2026;20:1741523.
- Andresen MC, Kunze DL. Nucleus tractus solitarius--gateway to neural circulatory control. Annu Rev Physiol. 1994;56:93-116.
- Craft GE, et al. Recent advances in quantitative neuroproteomics. Methods. 2013;61(3):186-218.
- Charan J, Kantharia ND. How to calculate sample size in animal studies? J Pharmacol Pharmacother. 2013;4(4):303-6.
- Zhou J, et al. Electroacupuncture pretreatment mediates sympathetic nerves to alleviate myocardial ischemia-reperfusion injury via CRH neurons in the paraventricular nucleus of the hypothalamus. Chin Med. 2024;19(1):43.
- Litwin SE, et al. Serial echocardiographic assessment of left ventricular geometry and function after large myocardial infarction in the rat. Circulation. 1994;89(1):345-54.
- Shu Q, et al. Electroacupuncture alleviates myocardial ischemia-reperfusion injury by inhibiting hypothalamic paraventricular nucleus neurons projecting to the rostral ventrolateral medulla. Eur J Neurosci. 2024;60(5):4861-76.
- Wan F, et al. Electroacupuncture improves cerebral blood flow in vascular cognitive impairment mice by activating the locus coeruleus-prefrontal cortex circuit. Neuroscience. 2025;583:33-42.
- Xu R, et al. Electroacupuncture ameliorates incisional pain via suppressing IL-33 signaling-related macrophage infiltration and ROS overproduction in incised skin. Chin Med. 2026;21(1):26.
- Quiroga RQ, et al. Unsupervised spike detection and sorting with wavelets and superparamagnetic clustering. Neural Comput. 2004;16(8):1661-87.
- Goldwyn JH, et al. Gain control with A-type potassium current: IA as a switch between divisive and subtractive inhibition. PLoS Comput Biol. 2018;14(7):e1006292.
- Buzsáki G. Large-scale recording of neuronal ensembles. Nat Neurosci. 2004;7(5):446-51.
- Zhang J, Mifflin SW. Responses of aortic depressor nerve-evoked neurones in rat nucleus of the solitary tract to changes in blood pressure. J Physiol. 2000;529(Pt 2):431-43.
- Benarroch EE. The central autonomic network: functional organization, dysfunction, and perspective. Mayo Clin Proc. 1993;68(10):988-1001.
- Scheitz JF, et al. Bidirectional brain-heart interactions in health and disease. Nat Rev Neurol. 2026;22(4):209-25.
- Floras JS. Sympathetic nervous system activation in human heart failure: clinical implications of an updated model. J Am Coll Cardiol. 2009;54(5):375-85.
- Iannetta D, et al. Dissecting the exercise pressor reflex in heart failure: a multi-step failure. Auton Neurosci. 2025;259:103269.
- Sved AF, et al. Baroreflex dependent and independent roles of the caudal ventrolateral medulla in cardiovascular regulation. Brain Res Bull. 2000;51(2):129-33.
- Liu Y, et al. Neurophysiological basis of electroacupuncture stimulation in the treatment of cardiovascular-related diseases: vagal interoceptive loops. Brain Behav. 2024;14(10):e70076.
- Zhou W, Benharash P. Effects and mechanisms of acupuncture based on the principle of meridians. J Acupunct Meridian Stud. 2014;7(4):190-3.
- Fawcett JW, et al. The roles of perineuronal nets and the perinodal extracellular matrix in neuronal function. Nat Rev Neurosci. 2019;20(8):451-65.
- Moon S, Ito Y. Vasculature cells control neuroglial co-localization and synaptic connection in a central nervous system tissue mimic system. Hum Cell. 2023;36(6):1938-47.
- Ferrer-Ferrer M, Dityatev A. Shaping synapses by the neural extracellular matrix. Front Neuroanat. 2018;12:40.
- Rabinowitch I, et al. Understanding neural circuit function through synaptic engineering. Nat Rev Neurosci. 2024;25(2):131-9.
- McGeachie AB, et al. Stabilising influence: integrins in regulation of synaptic plasticity. Neurosci Res. 2011;70(1):24-9.
- Qiu L, et al. RNA modification: mechanisms and therapeutic targets. Mol Biomed. 2023;4(1):25.
- Clapier CR, et al. Mechanisms of action and regulation of ATP-dependent chromatin-remodelling complexes. Nat Rev Mol Cell Biol. 2017;18(7):407-22.
- Du W, et al. Mechanisms of chromatin-based epigenetic inheritance. Sci China Life Sci. 2022;65(11):2162-90.
- Rashid F, et al. Mechanomemory of nucleoplasm and RNA polymerase II after chromatin stretching by a microinjected magnetic nanoparticle force. Cell Rep. 2024;43(7):114462.
- Weintraub AS, et al. YY1 is a structural regulator of enhancer-promoter loops. Cell. 2017;171(7):1573-88.e28.
- Zurkirchen L, et al. Yin Yang 1 sustains biosynthetic demands during brain development in a stage-specific manner. Nat Commun. 2019;10(1):2192.
- Cunningham JT, et al. mTOR controls mitochondrial oxidative function through a YY1-PGC-1alpha transcriptional complex. Nature. 2007;450(7170):736-40.
- van Weperen VYH, Vaseghi M. The brain-heart axis: effects of cardiovascular disease on the CNS and opportunities for central neuromodulation. Nat Rev Neurosci. 2026;27(3):159-77.
- Lam JC, et al. YY1-controlled regulatory connectivity and transcription are influenced by the cell cycle. Nat Genet. 2024;56(9):1938-52.
- Montuoro S, et al. Neuroimmune cross-talk in heart failure. Cardiovasc Res. 2025;121(4):550-67.