Integration of transcriptomic analysis and machine learning identified candidate biomarkers associated with mitochondrial metabolism in heterogeneous CAVD-spectrum valve lesions. ACADL and TDO2 exhibited consistent expression directions and associations with immune features, and computational drug-interaction predictions were generated.
Research Article
Mitochondrial Metabolism-Related Candidate Signatures in Calcific Aortic Valve Disease Spectrum: An Exploratory Integrative Bioinformatics Study
* These authors contributed equally
In This Article
Summary
Abstract
Calcific aortic valve disease (CAVD) is a progressive valvular disorder in which the role of mitochondrial metabolism remains incompletely understood. This exploratory study aimed to identify mitochondrial metabolism-related genes (MIMMRGs) associated with CAVD-spectrum valve remodeling. GSE83453 was used as the training dataset, and GSE51472 was used for expression-direction validation. Both datasets contain biologically and phenotypically heterogeneous groups of diseased valves. CAVD-associated differentially expressed genes (DEGs) were integrated with MIMMRGs, followed by functional enrichment analysis, least absolute shrinkage and selection operator (LASSO), and support vector machine–recursive feature elimination (SVM-RFE), expression validation, immune infiltration analysis, transcription factor analysis, drug and compound prediction, and molecular docking. A total of 909 DEGs and 1,234 MIMMRGs were identified, yielding 67 candidate genes enriched in metabolic and biosynthetic processes. ACADL and TDO2 were identified as candidate biomarkers and exhibited consistent expression differences between CAVD and normal samples in both datasets. Gene set enrichment analysis indicated the involvement of chemokine-related and immune-regulatory pathways. Four immune cell types differed between the CAVD and normal groups, and ACADL and TDO2 exhibited opposite correlations with naive B cells. HNF4A, STAT3, and AR were predicted to be common transcriptional regulators. Molecular docking indicated favorable in silico interactions between doxorubicin and ACADL and between dexamethasone and TDO2. In conclusion, ACADL and TDO2 are candidate biomarkers associated with mitochondrial metabolism and immune-related processes in heterogeneous CAVD-spectrum valve lesions. These findings are exploratory and hypothesis-generating and require independent clinical and experimental validation.
Introduction
Calcific aortic valve disease (CAVD) is a common cardiovascular valvular disease among older adults1. The prevalence of CAVD is particularly high in Western populations and increases significantly with advancing age2. As a multifactorial and progressive disease, CAVD is generally irreversible, and its onset and progression are closely associated with aging, chronic inflammation, metabolic syndrome, and other cardiovascular complications3. The pathogenesis of CAVD is complex and involves multiple processes, including endothelial injury, lipid accumulation, mitochondrial dysfunction, and cellular senescence4. Currently, no established pharmacological therapies are available to clinically slow or reverse CAVD progression; surgical or interventional valve replacement remains the primary treatment for patients with advanced disease5. Therefore, a deeper understanding of the pathophysiological mechanisms underlying CAVD and the identification of novel biomarkers and potential therapeutic targets are important.
Cellular metabolism is a central mediator of biological processes in living organisms6. As a central hub of cellular metabolism, mitochondria play critical roles in energy conversion and the regulation of cellular functions7. However, fluctuations in cellular energy demands or exposure to external stress can challenge mitochondrial metabolic adaptability. Under certain pathological conditions, mitochondrial dysfunction can become a key contributor to cellular dysfunction8. In CAVD, for example, the mitochondrial metabolic profile of mouse valvular cells undergoes substantial remodeling. Impaired mitochondrial quality control exacerbates mitochondrial stress, thereby accelerating valvular calcification and promoting CAVD progression9. Therefore, mitochondrial metabolism (MIMM) may play an important role in the onset and progression of CAVD. Investigation of MIMM in CAVD may help elucidate the complex pathological mechanisms underlying the disease and identify potential targets for further therapeutic research.
This study used two machine learning algorithms, independent expression validation, and downstream analyses, including immune-related analysis, transcriptional regulation analysis, drug and compound prediction, and molecular docking, to identify and characterize MIMM-associated candidate biomarkers in CAVD. Bioinformatics analyses using public databases were performed to identify candidate biomarkers associated with MIMM and CAVD. Subsequent analyses examined the pathways associated with these candidate biomarkers, their relationships with immune cells, and their potential interacting molecules. Collectively, these analyses characterize the potential roles of MIMM-associated candidate biomarkers in CAVD and provide a basis for further mechanistic and experimental studies. This study analyzed publicly available datasets containing heterogeneous groups of diseased valves. GSE83453 combines calcified bicuspid and stenotic tricuspid valves, whereas GSE51472 combines sclerotic and calcified valves. These groups represent different valve morphologies and disease phenotypes within the CAVD spectrum. The present findings should therefore be interpreted as associated with CAVD-spectrum valve remodeling rather than as specific to a homogeneous calcific CAVD cohort.
Protocol
Data sources
CAVD-related datasets were obtained from the Gene Expression Omnibus (GEO) database10. The training dataset, GSE83453 (sequencing platform: GPL10558), contained 27 samples: 10 calcified bicuspid aortic valve samples, 9 stenotic tricuspid aortic valve samples, and 8 normal tricuspid valve samples. The 10 calcified bicuspid and 9 stenotic tricuspid samples were combined into a diseased valve group (n = 19). GSE51472 (GPL570) contained 5 normal, 5 sclerotic, and 5 calcified valve samples; the 5 sclerotic and 5 calcified samples were combined into a diseased valve group (n = 10). GSE51472 was used for expression-direction validation. Exact GSM IDs and group assignments are provided in Supplementary Table 1. In addition, 1,234 mitochondrial metabolism (MIMM)-related genes (MIMMRGs) were obtained from reference11 (Supplementary Table 2).
Differential expression analysis
To identify differentially expressed genes (DEGs) between sample groups in the GSE83453 dataset, CAVD and normal samples were compared using the R package limma (v3.54.0), with significance defined as |log2FC| > 0.5 and p < 0.05, yielding 909 DEGs for downstream analyses. Benjamini-Hochberg (BH)-adjusted p values were also calculated. As a sensitivity analysis, 837 DEGs remained significant after false discovery rate (FDR) correction (FDR < 0.05), and the principal findings remained unchanged. The main figures and downstream analyses were based on the initial nominal p-value screening to maintain consistency with the original analysis.
Functional enrichment analysis
To identify genes associated with MIMM in CAVD, overlapping genes between DEGs and MIMMRGs were identified using the R package ggVenn (v0.1.10). The overlapping genes were selected as candidate genes for further analysis. To characterize the functional relevance of these candidate genes, Gene Ontology (GO) and Kyoto Encyclopedia of Genes and Genomes (KEGG) enrichment analyses were performed using the R package clusterProfiler (v04.7.1.003), with a significance threshold of p < 0.05.
Screening of biomarkers
Candidate genes were further screened using machine learning in the GSE83453 dataset to identify feature genes associated with CAVD. Least Absolute Shrinkage and Selection Operator (LASSO) regression analysis was performed using the R package glmnet (v4.1-4), with 10-fold cross-validation used to determine the optimal model. In parallel, candidate genes were analyzed using the support vector machine-recursive feature elimination (SVM-RFE) algorithm with the R package e1071 (v1.7.13), using five-fold cross-validation (k = 5). When more than 100 features remained, approximately half of the features were eliminated at each recursive step (halve.above = 100) to improve computational efficiency.
Feature genes identified by LASSO and SVM-RFE were then intersected, and the overlapping feature genes were designated as candidate biomarkers. Expression levels of the candidate biomarkers in diseased and normal samples were evaluated in GSE83453 and GSE51472 using the t-test. Candidate biomarkers exhibiting consistent expression directions across the two datasets were retained. GSE51472 was used for expression-direction validation.
Gene set enrichment analysis (GSEA)
Gene set enrichment analysis (GSEA), including GO biological process (BP) and KEGG analyses, was performed for each biomarker across all samples in GSE83453 using the R package clusterProfiler (v04.7.1.003) to investigate potential biological functions. Spearman's rank correlation coefficients between each biomarker and all other genes were calculated separately. All genes were then ranked in descending order according to their correlation coefficients to generate a ranked gene list. The analysis threshold was |normalized enrichment score (NES)| > 1 and p < 0.05, and the top five enriched pathways with |NES| > 1 were selected for presentation.
Immune infiltration analysis
To assess immune cell infiltration, the infiltration abundance of 22 immune cell types was calculated using the CIBERSORT algorithm. CIBERSORT analysis was performed using the standard R script v1.04 with the LM22 signature matrix and the GSE83453 expression matrix. Key parameters were perm = 1000, QN = F, and absolute = FALSE. The core algorithm used nu-SVR with a linear kernel (nu = 0.25/0.5/0.75), and the model with the lowest root mean square error (RMSE) was selected. Immune cell types with a score of 0 were subsequently excluded, and differences in the remaining immune cell types between the CAVD and normal groups were analyzed. For downstream analyses, only immune cell types with expression > 0 in at least 50% of samples were retained. Between-group differences were assessed using the Wilcoxon rank-sum test, with Benjamini-Hochberg (BH) correction for multiple testing. Potential relationships between candidate biomarkers and differential immune cell types were further evaluated in GSE83453 using Spearman's correlation analysis with the R package psych (v2.4.12). BH correction was applied where applicable.
Regulatory network analysis
To investigate interactions between candidate biomarkers and transcription factors (TFs), TFs targeting candidate biomarkers were identified using ChEA3 (ChIP-X Enrichment Analysis 3, https://maayanlab.cloud/chea3/). The candidate gene list was submitted to ChEA3, and the built-in ENCODE, ReMap, ChEA, ARCHS4, and GTEx libraries were selected for TF enrichment analysis. ChEA3 ranked each TF using Fisher's exact test and generated a rank and an integrated score; a higher rank indicated a more reliable association between the TF and the input gene set. The TF-biomarker regulatory network was visualized using Cytoscape. Subsequently, GeneMANIA (https://genemania.org/) was used to construct a gene-gene interaction (GGI) network for all candidate biomarkers. Homo sapiens was selected as the species, and default settings were used. Genes associated with the candidate biomarkers were identified, and GeneMANIA's built-in enrichment analysis was used to perform functional enrichment analysis of the predicted genes.
Drug prediction and molecular docking
Drugs and compounds predicted to interact with candidate biomarkers were identified using the CTD database. The candidate gene list was submitted to CTD, and chemicals with InferenceCount > 2 were retained. Drug-gene relationship pairs were imported into Cytoscape for visualization, and a drug/compound-candidate biomarker interaction network was constructed. CTD results were interpreted as chemical-gene interaction predictions rather than direct evidence of therapeutic efficacy. Predicted chemicals were categorized as therapeutic drug candidates or environmental/toxic compounds. To investigate potential interactions between candidate biomarkers and drugs, compounds with higher interaction scores were selected for molecular docking with the corresponding biomarkers. Molecular structures of the selected compounds were obtained from PubChem12, whereas protein structures of the biomarkers were obtained from the PDB database13. Molecular docking was performed using CB-Dock2 (https://cadd.labshare.cn/cb-dock2/) by separately submitting the compound and protein structures for blind docking. A docking score below -5 kcal/mol was considered to indicate a favorable predicted binding affinity. The PDB IDs were 8W0T for ACADL and 4PW8 for TDO2. Finally, the docking results were visualized using PyMOL (Version 3.1.2).
Statistical analysis
All analyses were performed in R (v4.2.2), and network diagrams were visualized using Cytoscape (v3.9.1). Differential expression analysis was performed using the limma package, with thresholds of |log2FC| > 0.5 and p < 0.05. Between-group comparisons were performed using Student's t-test or the Wilcoxon rank-sum test. Multiple-testing correction was performed using the Benjamini-Hochberg (BH) method. All p values were two-sided, and p < 0.05 was considered statistically significant.
Results
Candidate genes involved in multiple biosynthetic and metabolic pathways
Differential expression analysis identified 909 significant DEGs between the CAVD and normal groups, including 510 upregulated and 399 downregulated genes (Figure 1A). Intersection of the 909 DEGs with 1,234 MIMMRGs yielded 67 candidate genes for subsequent analyses (Figure 1B). GO functional annotation showed that these candidate genes were primarily involved in carboxylic acid biosynthesis, organic acid biosynthesis, and fatty acid metabolism (Figure 1C). KEGG pathway enrichment analysis further showed that the candidate genes were primarily enriched in the PAR signaling pathway, folate-mediated one-carbon pool, amino acid biosynthesis, pyruvate metabolism, and tyrosine metabolism (Figure 1D).
ACADL and TDO2 candidate biomarkers for CAVD-spectrum valve remodeling
Candidate genes were further screened using machine learning. LASSO and SVM-RFE identified eight and three feature genes, respectively (Figure 2A–C). The intersection of the feature genes identified by the two algorithms yielded two candidate biomarkers: ACADL and TDO2 (Figure 2D). In both the training dataset GSE83453 and validation dataset GSE51472, ACADL showed higher expression in diseased valve samples than in normal samples, whereas TDO2 showed lower expression (Figure 2E–F). Based on these consistent expression patterns, ACADL and TDO2 were retained as candidate biomarkers for subsequent analyses.
GSEA reveals pathway enrichment associated with ACADL and TDO2
GSEA was performed to evaluate the potential pathophysiological roles of ACADL and TDO2 in CAVD. GO analysis showed that both biomarkers were associated with adaptive immune responses and mononuclear cell migration (Figure 3A–B). Specifically, ACADL was also associated with granulocyte and leukocyte chemotaxis, whereas TDO2 was associated with leukocyte- and lymphocyte-mediated immune processes. KEGG pathway enrichment analysis further indicated associations of ACADL and TDO2 with pathways including natural killer (NK) cell-mediated cytotoxicity, chemokine signaling, cytokine-cytokine receptor interactions, and lysosomes (Figure 3C–D). Collectively, these findings suggested potential associations between the candidate biomarkers and immune-regulatory processes in CAVD.
Biomarkers associated with immune cells
In the GSE83453 dataset, the relative proportions of 22 immune cell types were displayed in an immune infiltration stacked plot (Figure 4A). M2 macrophages showed the highest relative infiltration across the samples. To evaluate differences in immune cell infiltration between the CAVD and normal groups, immune cell types that were zero in more than half of the samples were excluded. The remaining 12 immune cell types were analyzed for between-group differences, identifying four differential immune cell types: naive B cells, CD8+ T cells, follicular helper T cells, and regulatory T cells (Tregs; Figure 4B). ACADL was negatively correlated with Tregs (Cor = -0.49, p < 0.05) and positively correlated with naive B cells (Cor = 0.61, p < 0.05; Figure 4C). TDO2 was negatively correlated with naive B cells (Cor = -0.43, p < 0.05). Notably, ACADL and TDO2 showed opposite correlations with naive B cells.
Biomarkers associated with metabolic pathways
Prediction analysis identified 42 TFs associated with ACADL and 35 TFs associated with TDO2, with HNF4A, STAT3, and AR predicted for both biomarkers. The resulting TF-biomarker regulatory network comprised 77 regulatory relationships between the two biomarkers and 74 TFs (Figure 5A). GGI analysis identified relationships between the biomarkers and 20 additional genes. These genes were primarily associated with metabolic pathways and biological processes, including the carboxylic acid catabolic process (Figure 5B). ACADL showed broader predicted associations with these pathways.
Multiple compounds predicted to interact with the biomarkers
A total of 31 compounds were associated with the candidate biomarkers, including 22 associated with ACADL and 12 with TDO2. Bisphenol A, cyclosporine, tetrachlorodibenzodioxin, aflatoxin B1, and benzo(a)pyrene were predicted to interact with both biomarkers; consequently, the compound-biomarker network contained 29 chemical nodes and 2 biomarker nodes. Bisphenol A, tetrachlorodibenzodioxin, aflatoxin B1, and benzo(a)pyrene were classified as environmental or toxic compounds, whereas cyclosporine was classified as a therapeutic compound (Figure 6A). Molecular docking of doxorubicin with ACADL and dexamethasone with TDO2 yielded docking scores of -8.6 and -7.4 kcal/mol, respectively (Figure 6B–C), indicating favorable predicted binding affinities in silico. The docking models further indicated potential hydrogen-bond interactions between the corresponding ligands and proteins.
DATA AVAILABILITY:
All microarray expression data analyzed in this study are publicly available from the Gene Expression Omnibus (GEO) under accession numbers GSE83453 (https://ncbi.nlm.nih.gov/geo/query/acc.cgi?acc=GSE83453) and GSE51472 (https://ncbi.nlm.nih.gov/geo/query/acc.cgi?acc=GSE51472). Table S1=GSM IDs, S2=MIMMRGs. All analysis code and raw data tables from this study are available on Zenodo (https://doi.org/10.5281/zenodo.23052663).
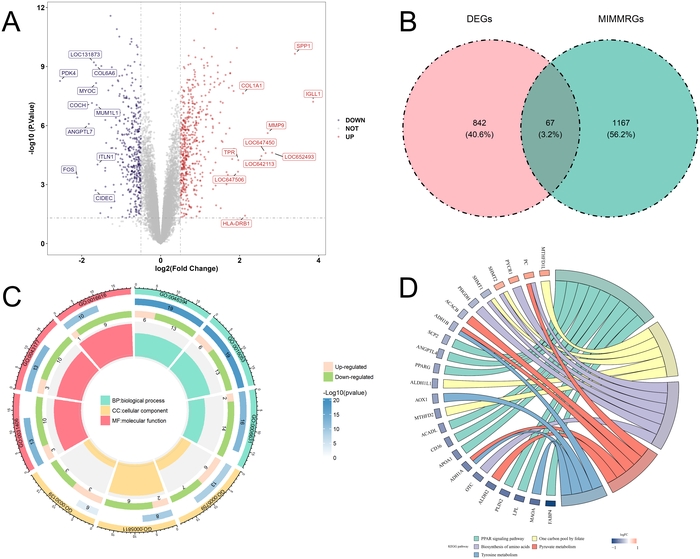
Figure 1: Identification and functional analysis of candidate genes. (A) Volcano plot of differentially expressed genes (DEGs) in GSE83453. The diseased valve group included 19 samples (10 calcified bicuspid aortic valve samples and 9 stenotic tricuspid aortic valve samples), and the normal group included 8 samples. The top 10 upregulated and downregulated genes are labeled, and the heatmap shows the expression patterns of the genes labeled in the volcano plot. (B) Venn diagram showing the overlap between DEGs and mitochondrial metabolism-related genes (MIMMRGs). (C) Gene Ontology (GO) enrichment analysis of candidate genes. (D) Kyoto Encyclopedia of Genes and Genomes (KEGG) pathway enrichment analysis of candidate genes. GO, Gene Ontology; KEGG, Kyoto Encyclopedia of Genes and Genomes; MIMMRGs, mitochondrial metabolism-related genes. Please click here to view a larger version of this figure.
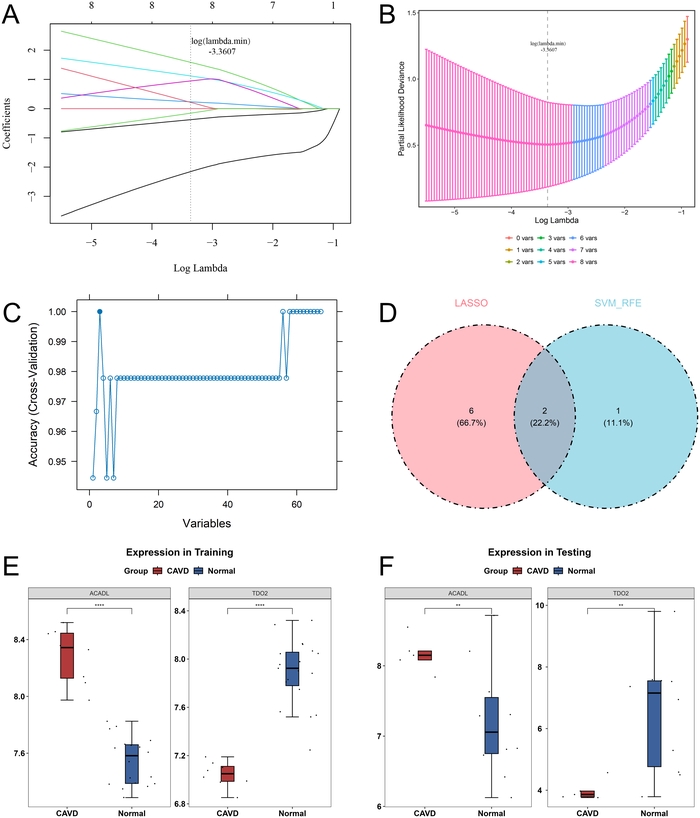
Figure 2: Identification of candidate biomarkers. (A) LASSO coefficient profiles of the candidate genes. (B) Ten-fold cross-validation for selection of the optimal parameter in the LASSO analysis. (C) SVM-RFE model. The horizontal axis represents the number of feature genes, and the vertical axis represents model prediction accuracy. (D) Venn diagram showing the overlap between feature genes identified by LASSO and SVM-RFE. (E) Expression levels of candidate biomarkers in the training dataset GSE83453. (F) Expression levels of candidate biomarkers in the validation dataset GSE51472. The diseased valve group included 10 samples (5 sclerotic and 5 calcified valve samples), and the normal group included 5 samples. LASSO, least absolute shrinkage and selection operator; SVM-RFE, support vector machine-recursive feature elimination. Please click here to view a larger version of this figure.
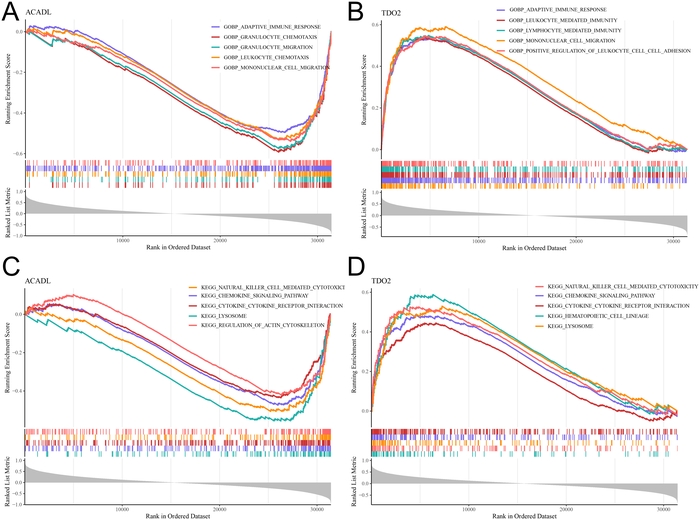
Figure 3: Gene set enrichment analysis of candidate biomarkers. (A) The top five Gene Ontology biological process (GO BP) terms associated with ACADL. (B) Top five GO BP terms associated with TDO2. (C) The top five Kyoto Encyclopedia of Genes and Genomes (KEGG) pathways associated with ACADL. (D) The top five KEGG pathways associated with TDO2. Gene set enrichment analysis (GSEA) was performed using clusterProfiler, with thresholds of |normalized enrichment score (NES)| > 1 and p < 0.05. Benjamini-Hochberg (BH)-adjusted p values were also calculated. GSEA, gene set enrichment analysis; GO BP, Gene Ontology biological process; KEGG, Kyoto Encyclopedia of Genes and Genomes; NES, normalized enrichment score. Please click here to view a larger version of this figure.
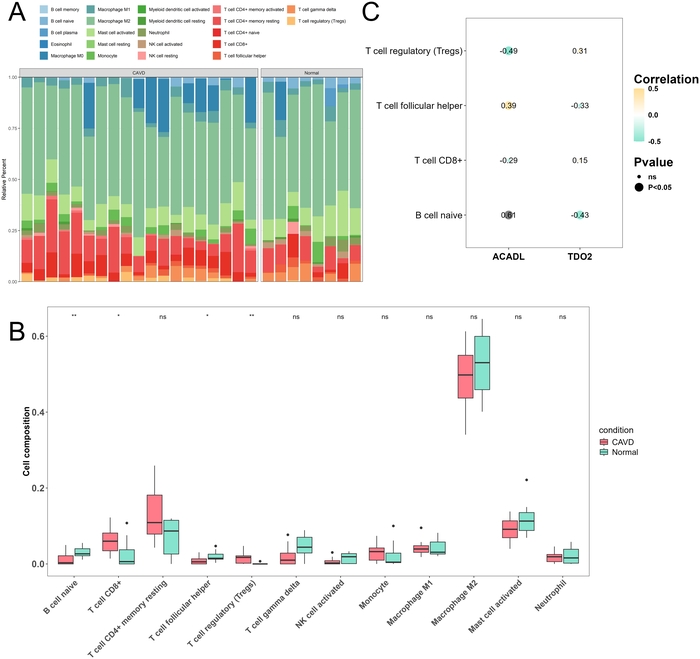
Figure 4: Immune infiltration analysis. (A) Percentage stacked plot showing the relative proportions of 22 immune cell types in GSE83453. The diseased valve group included 19 samples, and the normal group included 8 samples. (B) Differences in immune cell infiltration between the diseased valve and normal groups. (C) Correlations between candidate biomarkers and differential immune cell types. Please click here to view a larger version of this figure.
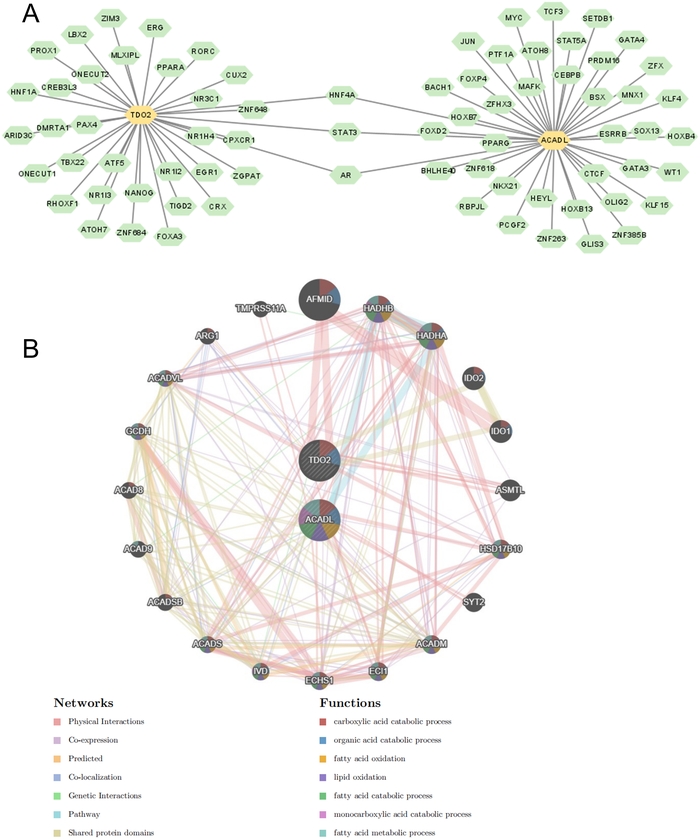
Figure 5: Molecular regulatory networks associated with candidate biomarkers. (A) Transcription factor (TF)-biomarker regulatory network. (B) Gene-gene interaction network associated with the candidate biomarkers. TF, transcription factor. Please click here to view a larger version of this figure.
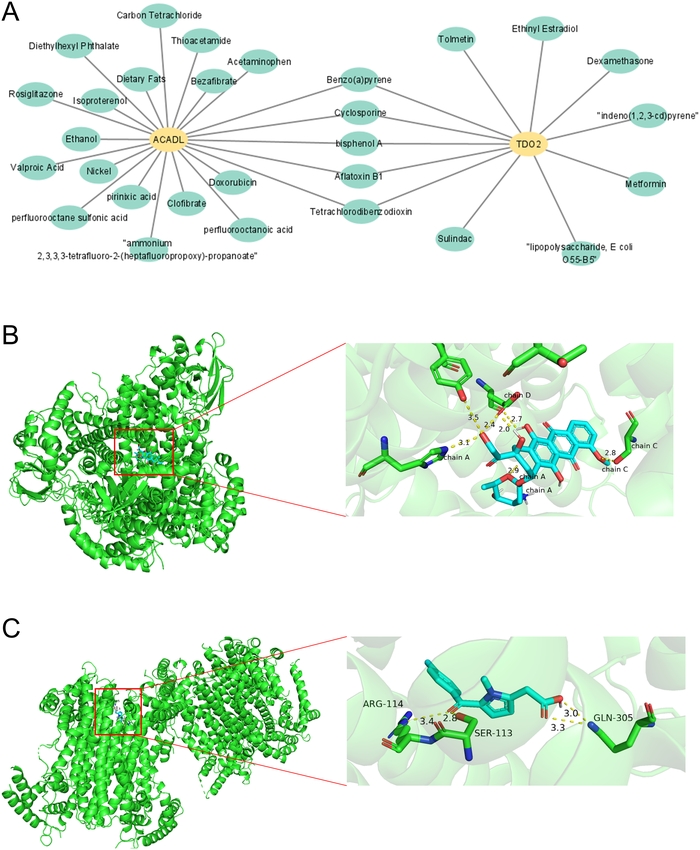
Figure 6: Biomarker-related drugs and compounds. (A) Drug/compound-biomarker interaction network. (B) Molecular docking of doxorubicin with ACADL. (C) Molecular docking of dexamethasone with TDO2. Please click here to view a larger version of this figure.
Supplementary Table 1: Sample information and group assignments for GSE83453 and GSE51472. Please click here to download this file.
Supplementary Table 2: List of 1,234 mitochondrial metabolism-related genes (MIMMRGs). Please click here to download this file.
Discussion
CAVD is a common cardiac valvular disease characterized primarily by calcification, fibrosis, and functional alterations in valvular cells14. Impaired mitochondrial function, increased oxidative stress, and disrupted intracellular calcium homeostasis may contribute to aortic valve calcification and degenerative changes15,16. Therefore, elucidating the mechanisms underlying mitochondrial involvement in CAVD may facilitate the identification of potential therapeutic targets and improve understanding of disease progression. In this exploratory analysis of heterogeneous groups of diseased valves, 67 candidate genes associated with mitochondrial metabolism were identified. Following screening with two machine learning algorithms and expression-direction validation, ACADL and TDO2 were identified as candidate biomarkers for CAVD-spectrum valve remodeling. GSEA and immune infiltration analyses indicated that these two genes were primarily associated with immune-regulatory pathways, and their expression levels were significantly correlated with naive B-cell infiltration. Furthermore, molecular docking predicted favorable binding affinities between doxorubicin and ACADL and between dexamethasone and TDO2, providing preliminary in silico evidence warranting further experimental validation.
The intersection of DEGs and MIMMRGs initially identified 67 candidate genes. Subsequent application of the LASSO and SVM-RFE algorithms identified two candidate biomarkers, ACADL and TDO2. ACADL (long-chain acyl-CoA dehydrogenase) is a key enzyme involved in fatty acid β-oxidation and plays an important role in mitochondrial hydrogen peroxide production and lipid homeostasis17. Previous studies have shown that abnormal ACADL expression can decrease intracellular ATP levels and promote the accumulation of reactive oxygen species, thereby disrupting mitochondrial bioenergetic homeostasis18. In atherosclerosis, glycosylation of ACADL has been reported to promote foam cell formation, exacerbate cellular damage in affected tissues, and enhance inflammatory responses19. TDO2 (tryptophan 2,3-dioxygenase) regulates tryptophan metabolism and has been implicated in mitochondrial function and immune and inflammatory responses20. In pulmonary arterial hypertension, TDO2 has been reported to upregulate the canine urea cycle, thereby exacerbating disease progression and shortening survival21. Furthermore, bioinformatics studies of carotid artery plaques and atherosclerosis have identified TDO2 as a potential factor associated with disease progression22,23. Although direct evidence regarding the specific roles of ACADL and TDO2 in CAVD remains limited, findings from other cardiovascular disease settings provide indirect support for their potential biological relevance as candidate biomarkers.
GSEA indicated that ACADL and TDO2 were associated with several biological processes and signaling pathways, particularly immune-related pathways, including natural killer (NK) cell-mediated cytotoxicity, chemokine signaling, cytokine-cytokine receptor interactions, and lysosomes. Abnormal NK cell function can impair innate immune responses and may be associated with an increased risk of cardiovascular disease24. In cardiovascular disease, B cells secrete cytokines involved in the regulation of inflammation, immune responses, and host defense25. Lysosomal dysfunction can impair autophagy and exacerbate chronic inflammation and metabolic dysfunction, thereby contributing to cardiovascular disease progression26,27. Immune infiltration analysis further identified differences in naive B cells, CD8+ T cells, follicular helper T cells, and Tregs between the CAVD and normal groups, suggesting an association between altered immune cell infiltration and CAVD. Correlation analysis showed that ACADL was positively correlated with naive B cells, whereas TDO2 was negatively correlated with them. These findings suggested that ACADL and TDO2 may be associated with immune-inflammatory processes in CAVD-spectrum valve remodeling. However, the present analyses did not establish whether these genes directly regulate immune cell infiltration, drug/compound predictionand the underlying mechanisms require experimental investigation.
Transcription factor prediction and GeneMANIA interaction network analysis indicated associations of ACADL and TDO2 with multiple transcription factors and functionally related genes, suggesting potential involvement in complex transcriptional regulatory networks associated with CAVD. Drug/compound prediction and molecular docking analyses generated computational hypotheses regarding interactions between doxorubicin and ACADL and between dexamethasone and TDO2. Doxorubicin is an anticancer drug associated with cardiotoxicity28, whereas dexamethasone is used in the treatment of hematological diseases such as multiple myeloma29. Previous studies have shown that dexamethasone inhibited the development of pulmonary arterial hypertension in mouse models of hypoxia by suppressing monocyte recruitment and infiltration30. Given the reported involvement of monocyte migration and immune activation in CAVD-associated valvular calcification31, the predicted interaction involving dexamethasone warrants further investigation. However, molecular docking alone does not establish therapeutic efficacy, and neither compound demonstrated therapeutic efficacy against CAVD in the present study.
Several limitations should be considered. First, the diseased groups were phenotypically heterogeneous: GSE83453 combined calcified bicuspid and stenotic tricuspid valves, and GSE51472 combined sclerotic and calcified valves. Therefore, the results are not specific to calcific CAVD. Second, sample sizes were small, particularly for machine-learning feature selection. Third, nested cross-validation, repeated resampling, and formal stability analysis were not performed; overfitting and selection bias cannot be excluded. Fourth, the primary DEG analysis used nominal p < 0.05, with FDR correction as a sensitivity analysis. Fifth, GSE51472 validated only expression direction, not diagnostic performance, effect sizes, confidence intervals, or subgroup robustness. Sixth, CIBERSORT was applied to 27 bulk samples, and the biomarker-immune correlations were modest and non-causal. Seventh, CTD prediction and molecular docking are computational only and do not establish therapeutic activity, target engagement, or biological efficacy. Independent clinical samples and cellular/animal experiments are required.
In summary, the exploratory bioinformatics study identified ACADL and TDO2 as candidate biomarkers associated with mitochondrial metabolism and immune-related processes in heterogeneous CAVD-spectrum valve lesions. These findings are preliminary and limited by small sample sizes, heterogeneous disease groups, lack of nested cross-validation and stability analysis, incomplete validation, and computational drug predictions. Further experimental and clinical validation is required before any diagnostic or therapeutic interpretation.
Disclosures
The authors declare no conflicts of interest.
Acknowledgements
This research received no external funding.
Materials
| Name | Company | Catalog Number | Comments |
|---|---|---|---|
| 20x objective lens | Olympus | MPLFLN | Objective lens/2D mapping analysis |
| Acetaminophen | Sigma-aldrich | 103-90-2 | Analyte/analysis |
| Anodisc aluminum oxide (AAO) membrane (200 nm pore size) | Whatman | 6809-5522 | Vaccum filtration/CNT scaffold |
| Ar | Hanyoung Gas Technology | www.gasmaster.co.kr | Ar gas purge source/ALD |
| Au (99.999%) | iTASCO | EAU0KI0001 | E-beam evaporation target |
| BPE (1,2-bis(4-pyridyl)ethylene) (97%) | Sigma-aldrich | 13362-78-2 | Analyte/analysis |
| Dream Plus | MDM instrument | www.wiley.com/doi/10.1002/adma.202203671 | DI-water purifier/CNT scaffold |
| DST1 | Vaccoat | www.vaccoat.com/products/magnetron-sputter-coater-dst1-300/ | Sputter/metal deposition |
| F 12/100/940 | Lenton | www.nature.com/articles/s41427-023-00523-7 | Furnace/CNT cleaning |
| FEX-MD | WEVE | www.mdpi.com/2079-6447/4/4/29 | Raman spectroscopy/LOD analysis |
| H1850 | Cence | 203270008 | Centrifuge/CNT scaffold |
| Invia confocal Raman microscope | Renishaw | www.renishaw.com | Raman spectroscopy/2D mapping analysis |
| JAC-3010 | KODO | U02-328-321 | Sonicator/CNT scaffold |
| KVE-C3001160 | Korea Vacuum Tech | www.koreavac.com | E-beam evaporator/metal deposition |
| Methanol (99.5%) | Samchun | www.samchun.com/en/sub/product/list.asp | Solvent/analysis |
| plus 200 | Quros | www.quros.co.kr | Atomic layer deposition/oxide intermediary layer |
| S-4800 | HITACHI | www.hitachi-hightech.com | SEM/analysis |
| Secure-seal | Electron Microscopy Sciences | 70333-36 | Hybridization chamber |
| TNWDS 0.2 wt% | Timesnano | TNWDS | SWNT CNT/CNT scaffold |
| Trimethylaluminium(TMA) | UPChem | www.upchem.co.kr/eng/product/product.php | Al2O3 precursor/ALD |
| VACNT with entangled canopy on top | Porifera Inc. | www.porifera.com | VACNT scaffold |
References
- Moncla LM, et al. Calcific aortic valve disease: mechanisms, prevention and treatment. Nat Rev Cardiol. 2023;20(8):546-559.
- Ossola P, et al. Aortic valve stenosis: progress from diagnosis to treatment. J Clin Med. 2026;15(2):659.
- Hafiane A, et al. Atherosclerosis, calcific aortic valve disease and mitral annular calcification: same or different? Int J Cardiol. 2025;420:132741.
- Klauzen P, et al. Macrophages in calcific aortic valve disease: paracrine and juxtacrine disease drivers. Biomolecules. 2024;14(12):1547.
- Li S, et al. Targeted inhibition of PTPN22 is a novel approach to alleviate osteogenic responses in aortic valve interstitial cells and aortic valve lesions in mice. BMC Med. 2023;21(1):252.
- Sarg NH, et al. The interplay of p38 MAPK signaling and mitochondrial metabolism, a dynamic target in cancer and pathological contexts. Biochem Pharmacol. 2024;225:116307.
- Chen B, Lyssiotis CA, Shah YM. Mitochondria-organelle crosstalk in establishing compartmentalized metabolic homeostasis. Mol Cell. 2025;85(8):1487-1508.
- Harrington JS, et al. Mitochondria in health, disease, and aging. Physiol Rev. 2023;103(4):2349-2422.
- Zhang J, et al. MARCH5 ameliorates aortic valve calcification via RACGAP1-DRP1-associated mitochondrial quality control. Biochim Biophys Acta Mol Cell Res. 2025;1872(3):119911.
- Chen G, et al. Predicting the molecular mechanism of ginger targeting PRMT1/BTG2 axis to inhibit gastric cancer based on WGCNA and machine algorithms. Phytomedicine. 2025;143:156892.
- Meng C, Sun Y, Liu G. Establishment of a prognostic model for ovarian cancer based on mitochondrial metabolism-related genes. Front Oncol. 2023;13:1144430.
- Kim S, et al. PubChem 2025 update. Nucleic Acids Res. 2025;53(D1):D1516-D1525.
- Flachsenberg F, et al. Redocking the PDB. J Chem Inf Model. 2024;64(1):219-237.
- Jiang C, et al. FOXO1 regulates RUNX2 ubiquitination through SMURF2 in calcific aortic valve disease. Redox Biol. 2024;73:103215.
- Itagawa R, et al. Mitochondrial extracellular vesicles enhance aortic valve calcification via carnitine O-octanoyltransferase-brief report. Arterioscler Thromb Vasc Biol. 2026;46(7):e324456.
- Luo H, et al. Epigenetic regulation in calcific aortic valve disease: mechanisms and therapeutic potential. Pharmacol Res. 2026;223:108073.
- Yin Y, et al. Integrated bioinformatics and machine learning analysis identify ACADL as a potent biomarker of reactive mesothelial cells. Am J Pathol. 2024;194(7):1294-1305.
- Wang Y, Ding Y. Integrated transcriptomic analysis and experimental validation identify ACADL as a mitochondrial tumor suppressor via the FOXO3a/PUMA axis in lung adenocarcinoma. Eur J Med Res. 2026;31(1):202.
- Ke K, et al. GFPT2 promotes macrophage dysfunction in atherosclerosis via ACADL glycosylation-dependent suppression of ACADL and Arg1. Cell Mol Life Sci. 2026;83(1):205.
- Zhu Y, et al. Genome-wide profiling of H3K27ac identifies TDO2 as a pivotal therapeutic target in metabolic associated steatohepatitis liver disease. Adv Sci (Weinh). 2024;11(45):e2404224.
- Simpson CE, et al. Kynurenine pathway metabolism evolves with development of preclinical and scleroderma-associated pulmonary arterial hypertension. Am J Physiol Lung Cell Mol Physiol. 2023;325(5):L617-L627.
- Jia X, et al. Identification and characterization of tryptophan metabolism-related genes in carotid artery plaques. PLoS One. 2026;21(2):e0341122.
- Li Z, et al. An oxidative stress-related molecular signature in atherosclerosis: identification of risk genes, construction of a diagnostic model, and characterization of immunocyte landscape. Front Cardiovasc Med. 2025;12:1600321.
- Saurabh A, et al. The interplay between loneliness, cortisol, and NK cell function: the role of cortisol in NK cell dysfunction. Psychoneuroendocrinology. 2026;189:107870.
- Yerly A, et al. Chemokine-receptor-guided B-cell immunity in cardiovascular disease. Basic Res Cardiol. 2025;120(6):1075-1090.
- Cheong LYT, et al. Autolysosomal dysfunction in obesity-induced metabolic inflammation and related disorders. Curr Obes Rep. 2025;14(1):43.
- Lopes E, et al. Cholesteryl hemiazelate present in cardiovascular disease patients causes lysosome dysfunction in murine fibroblasts. Cells. 2023;12(24):2826.
- Cui J, et al. Protosappanin A protects DOX-induced myocardial injury and cardiac dysfunction by targeting ACSL4/FTH1 axis-dependent ferroptosis. Adv Sci (Weinh). 2024;11(34):e2310227.
- Banerjee R, et al. Past, present, and future of dexamethasone in multiple myeloma and AL amyloidosis. J Clin Oncol. 2026;44(10):903-913.
- Kumar R, et al. Monocytes and interstitial macrophages contribute to hypoxic pulmonary hypertension. J Clin Invest. 2025;135(6):e176865.
- Salemizadehparizi F, et al. The contributions of increased reactive oxygen species and inflammatory macrophages to the development of aortic valve calcification. Free Radic Biol Med. 2025;241:64-75.