HeartFusion integrates ECG and cardiac MRI through modality-specific transformer encoders, cosine-similarity cross-modal fusion, wavelet time-frequency features, and ordinal severity modeling. Across three controlled pseudo-paired cardiovascular cohorts, the framework achieved high diagnostic discrimination and consistent severity staging, supporting phenotype-level multimodal analysis while highlighting the need for validation on patient-matched clinical data.
Araştırma makalesi
HeartFusion: A Cross-Modality Transformer for Accurate Cardiovascular Disease Diagnosis and Severity Assessment
Bu makalede
Özet
Özet
Cardiovascular disease (CVD) requires diagnostic models that can integrate complementary electrophysiological and anatomical information while also representing ordered disease severity. HeartFusion was developed as a mathematically informed cross-modality Transformer framework combining electrocardiogram (ECG) and cardiac magnetic resonance imaging (MRI). Wavelet-derived ECG time-frequency representations were encoded with Cardioformer, MRI structure was encoded with TransUNet, and modality-specific embeddings were aligned in a shared latent space using cosine-similarity-based cross-modal attention. A transformer classifier performed diagnostic prediction, while an ordinal regression head modeled four ordered severity stages. Three controlled pseudo-paired benchmark cohorts were constructed from PTB-XL with ACDC (CVD-I), MIMIC-IV-ECG with CMRxRecon (CVD-II), and PTB-XL/MIMIC-IV-ECG with OCMR/Cardiac Atlas Project data (CVD-III). Source observations were partitioned before pseudo-pair construction to prevent cross-partition leakage, and five matched random seeds were used for evaluation. HeartFusion achieved diagnostic accuracies of 97.73%, 98.23%, and 98.02%, with AUC values of 98.12%, 98.76%, and 98.39% on CVD-I, CVD-II, and CVD-III, respectively. Severity staging achieved ordinal accuracies above 90%, with the best Cohen’s kappa of 0.839 and MAE of 0.340. These findings support phenotype-level multimodal representation learning, while validation on genuinely patient-matched ECG-MRI cohorts remains necessary before clinical deployment.
Giriş
Cardiovascular disease (CVD) encompasses coronary artery disease, arrhythmias, heart failure, cardiomyopathy, and valvular disorders and remains a major cause of morbidity and mortality. Common risk factors include hypertension, diabetes, dyslipidemia, smoking, obesity, and family history, whereas clinical manifestations range from chest pain and dyspnea to fatigue, edema, rhythm disturbance, and sudden cardiac events. Selected examples of CVD types, warning signs, and major risk factors are illustrated in Figure 1. Accurate diagnosis is clinically important because CVD phenotypes vary in electrical, structural, and functional expression, and the severity of abnormality influences treatment selection, risk stratification, and longitudinal management1,2,3,4. Artificial intelligence has increasingly been applied to cardiovascular diagnosis using electrocardiograms (ECGs), cardiac imaging, clinical records, and other physiological data. ECG-based models can recognize waveform morphology and rhythm abnormalities but provide limited direct information about ventricular anatomy. Conversely, cardiac magnetic resonance imaging (MRI) provides detailed structural and functional information but does not directly capture electrophysiological dynamics. Machine-learning and deep-learning studies have demonstrated strong performance in individual modalities, yet reported systems continue to face challenges related to class imbalance, noise, heterogeneous acquisition protocols, limited generalizability, and clinically interpretable reasoning5,6,7,8,9,10.
Recent work has therefore moved toward knowledge-informed and multimodal architectures. Wavelet-based models have shown that embedding physically interpretable time-frequency information can improve cardiac-signal representation, while multimodal studies have combined ECG, phonocardiography, imaging, clinical metadata, and wearable measurements. These studies support the value of complementary information sources, but many approaches still use direct concatenation, decision-level averaging, or task-specific fusion without explicitly modeling geometric relationships between modalities. The literature summarized in Table 1 also shows that most systems prioritize disease detection or risk prediction and provide limited support for ordered severity staging11,12,13,14,15,16,17,18,19.
A clinically useful multimodal model should therefore preserve modality-specific information while learning interactions between electrical and anatomical findings. Simple early fusion can obscure modality-specific structure, whereas late fusion combines predictions only after much of the cross-modal information has already been compressed. A geometry-aware cross-attention mechanism offers an alternative by allowing ECG and MRI representations to influence one another in a shared feature space while retaining the direction and magnitude of cross-modal correspondence. In parallel, time-frequency decomposition of ECG signals can improve interpretability by exposing localized spectral patterns, and transformer-based encoders can capture long-range dependencies in both physiological and image-derived representations.
Severity assessment also requires a modeling strategy that recognizes the ordered nature of disease progression. Conventional multiclass Softmax classifiers treat normal, mild, moderate, and severe categories as unrelated labels, which can penalize adjacent-stage errors in the same manner as clinically distant errors. Ordinal regression instead learns ordered thresholds and can therefore represent progression more naturally. Combining multimodal diagnostic prediction with ordinal severity staging provides a unified framework for characterizing both disease phenotype and disease burden.
HeartFusion was developed to address these methodological gaps. The framework combined wavelet-based ECG representations, a Cardioformer ECG encoder, a TransUNet MRI encoder, cosine-similarity-based cross-modal Transformer fusion, manifold-alignment regularization, and an ordinal severity head. The architecture was designed to preserve modality-specific signal characteristics, enable interpretable cross-modal alignment, and support both diagnostic classification and ordered staging. Three controlled pseudo-paired cohorts were used because publicly available repositories rarely provide ECG and cardiac MRI examinations from the same individuals. The cohort-construction procedure therefore modeled phenotype-level relationships rather than patient-specific ECG-MRI correspondence.
The study evaluated whether the proposed cross-modality design improved diagnostic discrimination and severity staging relative to unimodal and recent task-specific baselines. Across CVD-I, CVD-II, and CVD-III, the reported diagnostic accuracies were 97.73%, 98.23%, and 98.02%, with corresponding AUC values of 98.12%, 98.76%, and 98.39%. Severity staging produced ordinal accuracy above 90% across all three cohorts. Ablation and unimodal comparisons were included to determine the contribution of wavelet representation, modality-specific attention, cross-modal alignment, manifold regularization, and ordinal prediction. Because the cohorts were pseudo-paired, the resulting performance was interpreted as evidence of phenotype-level multimodal representation learning, and patient-matched validation was identified as a necessary next step before clinical translation.
Protokol
Study design and HeartFusion framework
HeartFusion was implemented as a multimodal framework for CVD diagnosis and severity classification by integrating ECG and cardiac MRI representations. As shown in Figure 2, the workflow used Cardioformer for ECG encoding, TransUNet for MRI encoding, cosine-similarity-based cross-modal fusion, and transformer-based diagnostic and ordinal prediction heads. Wavelet-derived time-frequency information and a manifold-alignment loss were incorporated to improve robustness and preserve geometric structure. The datasets, software, and computational resources specified for reproducible implementation are listed in the Table of Materials.
Ethics and compliance
The study consisted exclusively of secondary computational analysis of de-identified data obtained from established public or controlled-access repositories. No new participants were recruited, no intervention was performed, and no directly identifiable information was collected for this study. Source datasets were accessed and used under the respective repository licenses, data-use agreements, and credentialing requirements. On this basis, the work did not involve new prospective human-subject enrollment or consent procedures; the exact institutional determination should remain consistent with the authors’ local research-governance requirements.
Data collection
To support multimodal CVD assessment, ECG data were used to represent cardiac electrical activity, and cardiac MRI data were used to represent anatomical and functional structure. Because the selected public repositories did not provide both modalities for the same patients, a multi-source alignment strategy was applied. ECG and MRI observations were matched using harmonized diagnostic categories and, for severity experiments, ordered stage information together with demographic compatibility variables. Each dataset pair was then evaluated independently as a controlled pseudo-paired multimodal cohort. Table 2 summarizes the source datasets and cohort composition. CVD-I combined PTB-XL ECG observations with ACDC cardiac MRI examinations. CVD-II combined MIMIC-IV-ECG observations with CMRxRecon MRI examinations. CVD-III combined ECG observations from PTB-XL and MIMIC-IV-ECG with MRI observations from OCMR and the Cardiac Atlas Project. These source repositories were selected because well-characterized cardiovascular signals or imaging data suitable for benchmark construction were available.
Dataset construction, label harmonization, and data partitioning
Three algorithmically constructed pseudo-paired cohorts were created because the source repositories did not contain synchronized ECG and cardiac MRI examinations from the same individuals. Diagnostic harmonization, severity assignment, demographic matching, and cross-modal pairing were performed according to a predefined protocol. CVD-I, CVD-II, and CVD-III, therefore, represented controlled phenotype-matched benchmark cohorts rather than patient-matched ECG-MRI acquisitions. Each cohort was constructed independently, and no source observation or generated pseudo-pair was shared across cohorts.
ECG records were included when a complete 12-lead configuration, at least 10 s of signal, a sampling frequency of at least 100 Hz, an interpretable diagnostic annotation, and a signal-quality index of at least 0.80 were available. Records with more than 20% corrupted signal, missing essential leads, severe baseline drift, or unmappable diagnostic labels were excluded. MRI examinations were included when a complete short-axis cine sequence, at least 20 temporal frames, at least six interpretable ventricular slices, and adequate ventricular structural information were available. Examinations with severe motion artifacts, incomplete ventricular coverage, corrupted files, missing annotations, or major reconstruction failure were excluded. After filtering, CVD-I contained 3,200 ECG observations and 800 MRI examinations; CVD-II contained 3,600 ECG observations and 900 MRI examinations; and CVD-III contained 3,400 ECG observations and 850 MRI examinations.
Diagnostic-label harmonization was performed by mapping source annotations into four cardiovascular phenotype categories: normal, ischemic myocardial injury, hypertrophic remodeling, and ventricular dysfunction. The normal category included ECG records without clinically significant electrical abnormalities and MRI examinations without important structural or functional impairment. Ischemic myocardial injury included myocardial infarction, ischemic ST-T abnormalities, and infarct-related ventricular impairment. Hypertrophic remodeling included electrocardiographic evidence of ventricular hypertrophy and MRI evidence of increased myocardial wall thickness. Ventricular dysfunction included conduction abnormalities, dilated ventricular morphology, reduced ventricular contraction, and abnormal right-ventricular structure. Ambiguous or unsupported labels were excluded, and the dominant phenotype was selected using the predefined hierarchy when multiple abnormalities were present.
Ischemic myocardial injury > Ventricular dysfunction > Hypertrophic remodeling > Normal
The same mapping procedure was applied to all three cohorts before partitioning and model training. Disease severity was represented using four ordered stages as defined in Equation (1).
 (1)
In Equation (1), s denotes the ordinal severity label, with 0 representing normal cardiac status, 1 mild disease, 2 moderate disease, and 3 severe disease. For each observation, an ECG abnormality score E, an MRI structural-abnormality score M, and a cardiac functional-impairment score F were calculated on normalized 0-3 scales. E incorporated QRS prolongation, ST-T deviation, rhythm disturbance, and waveform distortion; M incorporated ventricular-wall thickness, chamber enlargement, regional wall-motion impairment, and myocardial injury; and F was derived from left-ventricular ejection fraction and ventricular-volume abnormalities. A continuous severity index was calculated according to Equation (2).
 (2)
In Equation (2), R denotes the continuous severity index, and E, M, and F denote the normalized ECG, MRI structural, and functional-impairment scores, respectively; the coefficients are the predefined weighting factors. Stage 0 corresponded to ejection fraction at least 55% without important structural or electrical abnormality; stage 1 to ejection fraction 45–54% or mild remodeling/low-risk electrical abnormality; stage 2 to ejection fraction 30–44% or moderate structural/electrical abnormality; and stage 3 to ejection fraction below 30% or extensive myocardial injury, marked remodeling, or combined high-risk abnormalities.
Age and sex were used only as demographic matching variables and were not treated as diagnostic labels. Ages were restricted to 18–90 years. Category-level mean ages were set to 48 years for Normal, 62 years for Ischemic myocardial injury, 56 years for Hypertrophic remodeling, and 65 years for Ventricular dysfunction, with a standard deviation of 11 years. The overall male proportion was maintained at approximately 54%. A fixed cohort-construction seed of 2026 was used so that demographic assignments and cross-modal candidate selection could be reproduced. Cross-modal pseudo-pairs were created only between ECG and MRI observations belonging to the same harmonized diagnostic category. For severity-stage experiments, observations were additionally required to share the same ordered severity stage. The ECG-MRI compatibility score was calculated using Equation (3).
 (3)
In Equation (3), y represented the diagnostic category, s represented the severity stage, a represented the age, g represented the sex, I(·) was the indicator function, and Pij was the compatibility score for ECG observation i and MRI observation j. Eligible MRI candidates were ranked by Pij; the five highest-scoring observations formed the candidate pool, and two candidates were selected without replacement for each ECG observation. This process generated 6,400 pseudo-pairs for CVD-I, 7,200 for CVD-II, and 6,800 for CVD-III. During training, one eligible MRI candidate was sampled at each epoch; validation and test pairings were generated once and remained fixed. Training, validation, and test partitioning were performed before pseudo-pair construction. The original ECG and MRI observations were split using a stratified 70:15:15 ratio, with stratification jointly preserving diagnostic category and severity stage. All segments from the same ECG record were assigned to one partition, and all slices and temporal frames from the same MRI examination were retained within one partition. Cross-modal pairing was restricted to source observations within the same partition, as specified in Equations (4)–(6).
 (4)
 (5)
 (6)
In Equations (4)–(6), Ptrain, Pvalidation, and Ptest denoted the pseudo-pair sets; Etrain, Evalidation, and Etest denoted partition-specific ECG sets; and Mtrain, Mvalidation, and Mtest denoted partition-specific MRI sets. This constraint prevented source ECG records, MRI examinations, waveform segments, image slices, and pseudo-pairs from appearing in more than one partition. Normalization parameters, class weights, augmentation settings, and other data-dependent parameters were estimated only from the training partition and then applied to validation and test data. Five experimental runs used random seeds 11, 23, 37, 51, and 79. The same partitions and seeds were used for HeartFusion and all baselines. Model selection and early stopping were based only on validation performance, and the test partition was evaluated only after the final model configuration had been selected without using test results for model tuning.
Data preprocessing
ECG and cardiac MRI inputs were preprocessed to produce standardized, diagnostically meaningful representations. ECG preprocessing addressed baseline drift, motion artifacts, high-frequency noise, and scale variation, whereas MRI preprocessing standardized spatial resolution, intensity range, and slice selection.
ECG preprocessing began with denoising. A frequency-domain bandpass filter was applied according to Equation (7).
 (7)
In Equation (7), xfilter(t) denotes the filtered ECG signal, F and F^-1 denote the Fourier and inverse Fourier transforms, H(f) denotes the passband filter, and x(t) denotes the original signal. The filtered signal was then standardized using Equation (8).
 (8)
In Equation (8), xnorm(t) denotes the standardized ECG signal, µx denotes the signal mean, and σx denotes the signal standard deviation. R-peaks were detected with a modified Pan-Tompkins procedure, and beat-level segments were extracted. A continuous wavelet transform using a Morlet basis was then calculated according to Equation (9).
 (9)
In Equation (9), W(a,b) denotes the wavelet coefficient at scale a and temporal translation b, x(t) denotes the ECG segment, ψ denotes the complex Morlet mother wavelet, and the integral represents the continuous projection of the signal onto scaled and translated wavelets. The resulting scalogram was used as the two-dimensional Cardioformer input. Cardiac MRI scans were resampled to 256 × 256 pixels using bicubic interpolation and center-cropped around the cardiac region. Intensity normalization was performed according to Equation (10).
 (10)
In Equation (10), Inorm(x,y) denotes the normalized pixel intensity, I(x,y) the original pixel intensity, and Imin and Imax the minimum and maximum intensities in the image. A fixed number of mid-ventricular slices was selected from each examination. When segmentation masks were available, left-ventricular, right-ventricular, and myocardial structures were retained for auxiliary supervision or the derivation of functional biomarkers.
Feature Extraction
Feature extraction transformed the preprocessed ECG scalograms and MRI slices into fixed-dimensional modality-specific representations. Detailed pseudocode for the feature-extraction procedure is provided. As illustrated in Figure 3, separate encoders were used for the time-frequency ECG representation and the spatial MRI representation before the resulting embeddings were projected into a common latent space.
For ECG feature extraction, wavelet-derived scalograms were processed by Cardioformer.20 Convolutional layers captured local waveform structures such as QRS and T-wave morphology, and Transformer layers modeled long-range dependencies across the time-frequency representation. A convolutional feature map was calculated according to Equation (11).
 (11)
In Equation (11), F(l) denotes the feature map at layer l, W(l) denotes the convolution kernel, b(l) denotes the bias term, and σ denotes the SiLU activation. The resulting maps were flattened and processed with self-attention according to Equation (12).
 (12)
In Equation (12), Q, K, and V denote query, key, and value matrices derived from the same ECG feature set, and dk denotes the key-feature dimension. The attention operation assigned data-dependent weights to time-frequency regions, thereby enabling the representation of long-range ECG dependencies. For MRI feature extraction, TransUNet was used as a transformer-enhanced image encoder21. Downsampling convolutional layers first extracted hierarchical spatial features, and the recursive encoder mapping was defined by Equation (13).
 (13)
In Equation (13), Fl denotes the MRI feature map at encoder level l, Conv(·) denotes the convolutional transformation, bl denotes the level-specific bias, σ denotes the activation function, and L denotes the number of encoder levels. The encoder output was reshaped into image-patch tokens and passed through a Vision Transformer block to model spatial dependencies across ventricular regions. The ECG and MRI encoders produced fixed-dimensional embeddings that retained modality-specific diagnostic information and were subsequently aligned by the cross-modal fusion module.
Multimodal feature alignment and fusion
Multimodal fusion was performed after modality-specific feature extraction to integrate electrical and anatomical information without directly concatenating raw inputs or averaging final predictions. Cross-modal attention was used because it allowed one modality to modulate the interpretation of the other while preserving the structure of each representation. ECG and MRI embeddings were projected into a common latent space using Equation (14), after which pairwise cosine similarity was calculated to preserve directional agreement without constraining the alignment weights to be strictly positive.
 (14)
In Equation (14), xECG and xMRI denote modality-specific encoder outputs, WECG and WMRI denote learned linear projection matrices, and zECG and zMRI denote the corresponding projected tokens. For ECG token i and MRI token j, cosine similarity was then calculated according to Equation (15).
 (15)
In Equation (15), simij denoted the directional similarity between projected ECG token zECG,i, and MRI token zMRI,j; the numerator was the vector inner product, and the denominator was the product of the two Euclidean norms. The similarity matrix was then used to construct a fused representation according to Equation (16).
 (16)
In Equation (16), zfused(i) denotes the cross-modal representation associated with ECG token i, Sij denotes the ECG-MRI alignment weight, zMRI(j) denotes MRI token j, and TMRI denotes the number of MRI tokens. This procedure preserved positive, negative, and near-zero correspondence and enabled token-level cross-modal reasoning before pooling.
Disease diagnosis and severity classification
The fused multimodal representation was used to predict both diagnostic category and ordered severity stage. A Transformer prediction module was applied because self-attention could model global interactions among fused ECG-MRI tokens, while an ordinal head represented the ordered progression of disease severity. Given the fused token sequence Z, query, key, and value matrices were calculated using learned projections: 
 (17)
In Equation (17), Z denotes the fused token matrix, and WQ, WK, and WV denote learned projection matrices for queries, keys, and values. Cosine-similarity self-attention was then calculated as:
 (18)
In Equation (18), Attention(Q, K, V) denotes the self-attention output, cos(Q, K) denotes pairwise cosine-similarity weights, and V denotes the value matrix. Each pairwise similarity score was calculated as:
 (19)
In Equation (19), qi and kj denote the i-th query and j-th key vectors; the numerator was the vector dot product, and the denominator normalized the score by the product of the vector norms. The attention output was processed by the position-wise feed-forward network:
 (20)
In Equation (20), x denoted the attention-layer input, W1 and W2 denoted learned weight matrices, b1 and b2 denoted bias vectors, ReLU denoted the rectified linear unit, and FFN(x) denoted the nonlinear transformation. After the Transformer stack, global pooling produced a single latent vector. Diagnostic probabilities were calculated using a fully connected layer followed by element-wise sigmoid activation: 
 (21)
In Equation (21), y_disease denotes the vector of diagnostic probabilities, Wc and bc denote classifier weights and bias, z denotes the pooled fused representation, and σ denotes the sigmoid function. A margin-based binary cross-entropy loss was used for diagnostic learning: 
 (22)
In Equation (22), Ldiagnosis denotes diagnostic loss, yc denotes the target indicator for class c, zc denotes the corresponding class logit, m denotes the margin hyperparameter, σ denotes the sigmoid function, and C denotes the number of diagnostic categories. Severity staging was modeled with ordered threshold regressors using learnable cutoffs: 
 (23)
In Equation (23), P(y>k) denotes the probability that severity exceeded threshold k, wk denotes the threshold-specific weight vector, z denotes the pooled representation, θk denotes the learnable cutoff, and K denotes the number of ordered severity stages. The cumulative ordinal loss was calculated as:
 (24)
In Equation (24), Lordinal denotes ordinal staging loss, yk denotes the binary target indicating whether the true stage exceeded threshold k, P(y>k) denotes the corresponding cumulative probability, and K-1 denotes the number of ordered thresholds. This formulation preserved the ordering among normal, mild, moderate, and severe stages. This formulation respects the ordinal nature of severity (e.g., mild < moderate < severe), unlike Softmax which treats all classes as flat and unordered.
Model training and testing
HeartFusion was trained and evaluated independently on the three pseudo-paired cohorts using the configuration summarized in Table 3. Source ECG and MRI observations were split before pairing, dynamic MRI-candidate selection was used only during training, and validation/test pairings remained fixed. No source observation, derived segment, image slice, or pseudo-pair was shared across partitions, and identical partitions were used for the comparison methods. The ECG and MRI encoders were initialized with He-normal weights and optimized jointly using a weighted sum of losses: margin-based binary cross-entropy for diagnosis and ordinal cumulative loss for severity staging. The total loss function is given by:
 (25)
In Equation (25), Ltotal denotes the total optimization objective; λ1, λ2, and λ3 denote task-balancing weights; Ldiagnosis denotes the margin-based diagnostic loss; Ordinal denotes the cumulative ordinal loss; and Lfusion denotes the optional manifold-alignment loss. Optimization used Adam with cosine annealing and validation-based early stopping. The batch size was 16, training was capped at 100 epochs, dropout was 0.30, and weight decay was applied consistently across the three cohorts and baseline experiments.
Evaluation
Performance was evaluated for diagnostic classification and severity staging. Diagnostic performance was summarized using accuracy, F1-score, and area under the receiver operating characteristic curve (AUC). Severity performance was summarized using ordinal accuracy, Cohen's kappa, and mean absolute error (MAE). Results were calculated over five matched runs using random seeds 11, 23, 37, 51, and 79. Statistical comparisons used paired Wilcoxon signed-rank tests on matched partitions and seeds, followed by Holm-Bonferroni correction; adjusted p-values below 0.05 were treated as statistically significant.
Baseline models
HeartFusion was compared with recent task-specific methods spanning unimodal ECG classification, multimodal ECG-MRI representation learning, temporal-frequency ECG fusion, and ECG-clinical metadata fusion. A recent ECG foundation-model benchmark was also discussed as a literature reference rather than a direct numerical baseline because its datasets, labels, and evaluation protocol differed from those used in this study. Cardioformer was used as a unimodal ECG reference because it combined convolutional feature extraction, multi-granularity tokenization, and hierarchical Transformer attention, but it did not incorporate cardiac imaging or explicit ordered severity modeling22. Girlanda et al. developed a self-supervised multimodal framework that jointly pretrained ECG and cardiac MRI encoders using masked reconstruction and contrastive alignment. The method was the closest multimodal reference to HeartFusion, although its primary objective was representation learning rather than explicit ordinal severity staging23.
Liu introduced a Transformer architecture that integrated spatial-temporal and frequency-domain ECG representations within a shared attention mechanism. Both inputs originated from ECG, so the approach did not perform physiological-imaging cross-modality integration24. Qiu et al. combined ECG signals with clinical metadata using a noise-tolerant Transformer for atrial-fibrillation recurrence prediction. The method supported multimodal clinical input but addressed a binary task and did not incorporate cardiac MRI or ordered CVD severity assessment25. Al-Masud et al. benchmarked eight ECG foundation models across multiple clinical tasks and public datasets. The benchmark showed that strong ECG representations remained task-dependent and had persistent limitations for structural assessment and outcome characterization. Because the benchmark was ECG-only and used different tasks and protocols, it was treated as a literature-based reference rather than a directly comparable baseline26. Together, the comparison methods provided context for evaluating modality complementarity, cross-modal representation learning, and ordered staging within HeartFusion.
Sonuçlar
HeartFusion was evaluated on three pseudo-paired multimodal cohorts. Diagnostic accuracy reached 97.73% on CVD-I, 98.23% on CVD-II, and 98.02% on CVD-III. Figure 4 summarizes the diagnosis-performance profiles across the three cohorts using accuracy, precision, recall, and F1-score. The consistently high values across cohorts indicated stable diagnostic performance under the controlled evaluation protocol. The reported diagnostic performance was associated with three complementary design elements: wavelet-derived ECG time-frequency information, transformer-based modality-specific encoding, and cosine-similarity cross-modal alignment. These results should not be interpreted as evidence of reduced real-world clinical diagnostic error until HeartFusion is validated with prospectively or retrospectively collected patient-matched ECG-MRI data. AUC was used to assess diagnostic discrimination across decision thresholds. Figure 5 presents receiver operating characteristic (ROC) curves with AUC values of 98.12%, 98.76%, and 98.39% for CVD-I, CVD-II, and CVD-III, respectively. The results indicated strong separation within the corresponding test cohorts and were consistent with the role of geometry-aware cross-modal fusion in aligning electrical and structural representations.
Severity staging was evaluated as an ordered prediction task using ordinal accuracy, Cohen's kappa, and MAE. As summarized in Table 4, ordinal accuracy exceeded 90% across all three cohorts, Cohen's kappa exceeded 0.80, and the lowest MAE was 0.340 on CVD-II. These results indicated that the model captured ordered differences among normal, mild, moderate, and severe stages within the constructed cohorts. The ordinal regression head learned separate boundaries between neighboring stages rather than treating severity labels as unrelated categories. Cosine-aligned multimodal features also allowed continuous structural changes observed in MRI to be associated with electrical abnormalities represented in ECG features. Figure 6 provides a contextual comparison of diagnostic AUC and F1-score across HeartFusion and the selected baseline/reference methods displayed in the figure. The closest multimodal reference in the manuscript was Girlanda et al.; HeartFusion achieved 98.76% AUC and 96.21% F1-score, compared with 96.35% AUC and 94.22% F1-score for Girlanda et al. Because several comparator values originate from different task settings or literature reports, the broader comparison should be interpreted contextually rather than as a uniform head-to-head evaluation under identical datasets and protocols.
Table 5 summarizes the severity-staging comparison values used in the study comparison setup. HeartFusion achieved the highest values in the comparison, including 91.46% ordinal accuracy, Cohen's kappa of 0.839, and MAE of 0.340. Because the cited reference methods were originally developed for different prediction tasks, these comparison values should be interpreted within the present evaluation setup rather than as direct reproductions of the original publications' task metrics. To determine whether multimodal performance was consistent across cohorts, HeartFusion was also compared with ECG-only and MRI-only variants on all three datasets. As presented in Table 6, the unimodal variants retained the corresponding encoder and prediction heads but did not receive features from the other modality. All configurations used identical partitions, optimization settings, stopping criteria, and random seeds.
To clarify the contribution of the synthetically constructed CVD-III cohort, severity performance was examined separately for each dataset rather than being calculated from a pooled test set. HeartFusion achieved an ordinal accuracy of 90.92%, Cohen’s κ of 0.828, and an MAE of 0.352 on CVD-I; an ordinal accuracy of 91.46%, Cohen’s κ of 0.839, and an MAE of 0.340 on CVD-II; and an ordinal accuracy of 91.18%, Cohen’s κ of 0.833, and an MAE of 0.344 on CVD-III. Therefore, the highest reported ordinal accuracy, Cohen’s κ, and lowest MAE were obtained from CVD-II and were not derived from CVD-III. The unweighted macro-average across all three cohorts was 91.19% for ordinal accuracy, 0.833 for Cohen’s κ, and 0.345 for MAE. After excluding CVD-III, the corresponding averages for CVD-I and CVD-II were 91.19%, 0.834, and 0.346, respectively. Thus, inclusion of CVD-III changed the macro-averaged ordinal accuracy by less than 0.01 percentage points and changed Cohen’s κ and MAE by approximately 0.001. This analysis indicates that CVD-III does not numerically dominate the reported severity-classification performance; however, its results must be interpreted separately because its severity stages are algorithmically inferred rather than independently adjudicated clinical ground-truth labels.
The multimodal HeartFusion model consistently outperformed both unimodal variants on all three datasets. Compared with the strongest unimodal model in each dataset, HeartFusion improved AUC by 4.34, 4.68, and 4.74 percentage points on CVD-I, CVD-II, and CVD-III, respectively. The corresponding improvements in F1-score were 5.92, 5.93, and 6.21 percentage points, while ordinal accuracy increased by 6.89, 7.14, and 7.30 percentage points. For severity estimation, HeartFusion reduced MAE from 0.653 to 0.352 on CVD-I, from 0.641 to 0.340 on CVD-II, and from 0.658 to 0.344 on CVD-III. These values correspond to relative error reductions of 46.1%, 47.0%, and 47.7%, respectively. Cohen’s κ also increased consistently, demonstrating that the multimodal model produced more reliable agreement with the reference severity stages than either unimodal branch.
Ablation study
Ablation experiments were performed to quantify the contribution of major HeartFusion components. Each experiment removed or substituted one module and measured the resulting change in diagnostic and severity-staging performance on CVD-II, which contained balanced ECG and MRI observations across the four ordered stages. According to Table 7, the complete HeartFusion configuration achieved the strongest diagnostic and severity-staging performance. Removing the wavelet-based ECG representation reduced F1-score from 96.21% to 93.11% and ordinal accuracy from 91.46% to 88.16%, confirming that localized time-frequency information contributed beyond the raw ECG representation.
Removing Cardioformer attention produced reductions of 3.63 percentage points in F1-score and 3.72 percentage points in ordinal accuracy. This demonstrates that attention-based modeling of long-range ECG dependencies is important for identifying subtle waveform abnormalities associated with both disease type and severity. Replacing TransUNet with a conventional convolutional MRI encoder reduced the F1-score to 91.93% and ordinal accuracy to 86.85%. This was accompanied by an increase in MAE from 0.340 to 0.528, indicating that transformer-enhanced spatial modeling contributes substantially to the representation of ventricular morphology and structural disease progression.
Replacing cosine-similarity alignment with direct feature concatenation reduced the AUC by 2.93 percentage points and the F1-score by 3.37 percentage points. The decline indicates that direct concatenation does not adequately capture the geometric correspondence between electrophysiological ECG patterns and structural MRI findings. The replacement of the Cross-Modal Transformer with late decision-level fusion produced one of the largest diagnostic performance reductions. The F1-score decreased to 91.76%, while ordinal accuracy decreased to 86.63%. This finding supports the use of token-level cross-modal interaction rather than independent unimodal predictions combined only at the output level. Removing the manifold-alignment loss caused comparatively smaller but consistent reductions across all metrics. The F1-score decreased by 1.58 percentage points, ordinal accuracy decreased by 2.36 percentage points, and MAE increased from 0.340 to 0.421. This confirms that the alignment constraint improves the structural consistency of the shared latent space.
Replacing the ordinal regression head with a standard Softmax classifier had little effect on the diagnostic AUC and F1-score, as the diagnostic branch remained unchanged. However, ordinal accuracy decreased from 91.46% to 87.41%, Cohen’s κ decreased from 0.839 to 0.748, and MAE increased from 0.340 to 0.582. These results demonstrate that a conventional Softmax classifier fails to preserve the ordered relationships among normal, mild, moderate, and severe disease stages. The ECG-only and MRI-only variants produced the lowest overall results. The ECG-only model achieved an F1-score of 89.74% and ordinal accuracy of 83.61%, whereas the MRI-only model achieved an F1-score of 90.28% and ordinal accuracy of 84.32%. Relative to the complete model, these results indicated complementary contributions from electrophysiological and anatomical information.
DATA AVAILABILITY:
The raw data and source code are available at https://github.com/intelligent321/heartfusion.
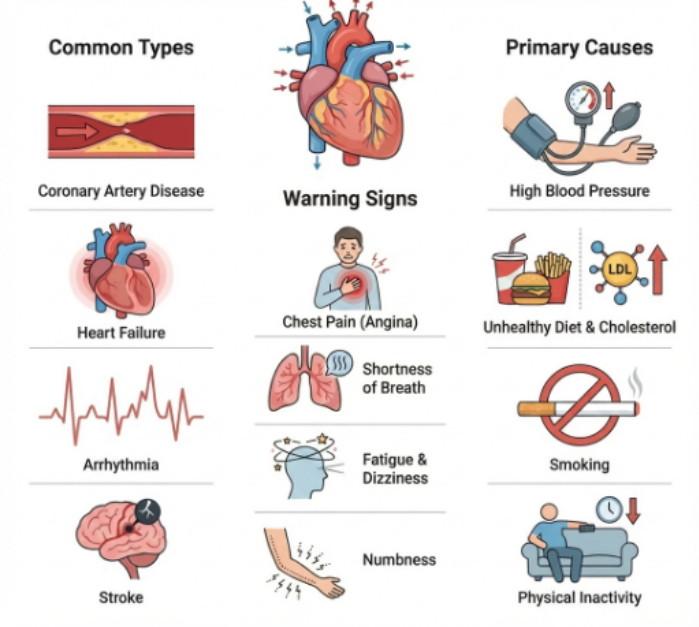
Figure 1: Clinical context for cardiovascular disease. The figure summarizes common CVD types shown in the illustration (coronary artery disease, heart failure, arrhythmia, and stroke), representative warning signs (chest pain/angina, shortness of breath, fatigue and dizziness, and numbness), and major risk factors depicted in the figure (high blood pressure, unhealthy diet and elevated cholesterol, smoking, and physical inactivity). Original figure generated for this manuscript, and source codes are provided in the repository; no third-party image was reproduced or adapted. Please click here to view a larger version of this figure.
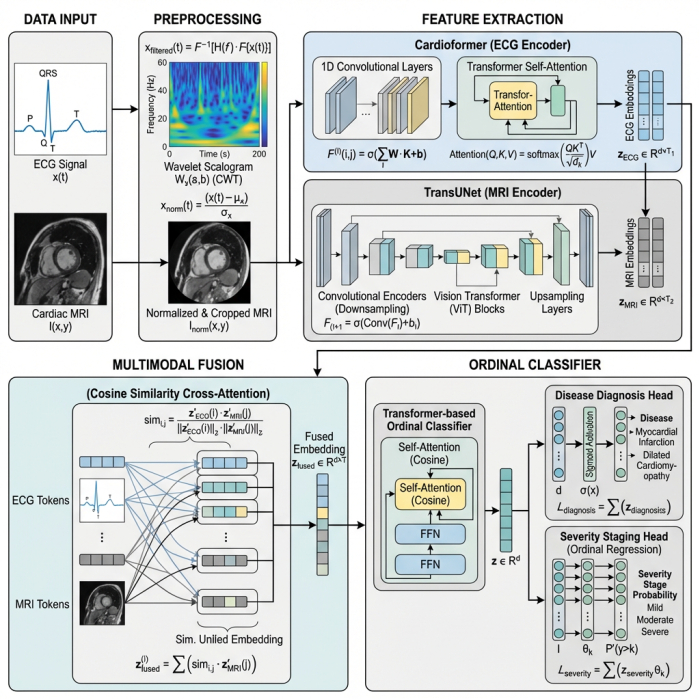
Figure 2: HeartFusion architecture. ECG and cardiac MRI inputs undergo modality-specific preprocessing; ECG signals are transformed into wavelet scalograms and cardiac MRI images are normalized and cropped. Cardioformer and TransUNet extract modality-specific embeddings, which are integrated through cosine-similarity-based cross-attention. The fused representation is then processed by a Transformer-based classifier with disease-diagnosis and ordinal severity-staging heads. Original figure generated for this manuscript; no third-party image was reproduced or adapted. Please click here to view a larger version of this figure.
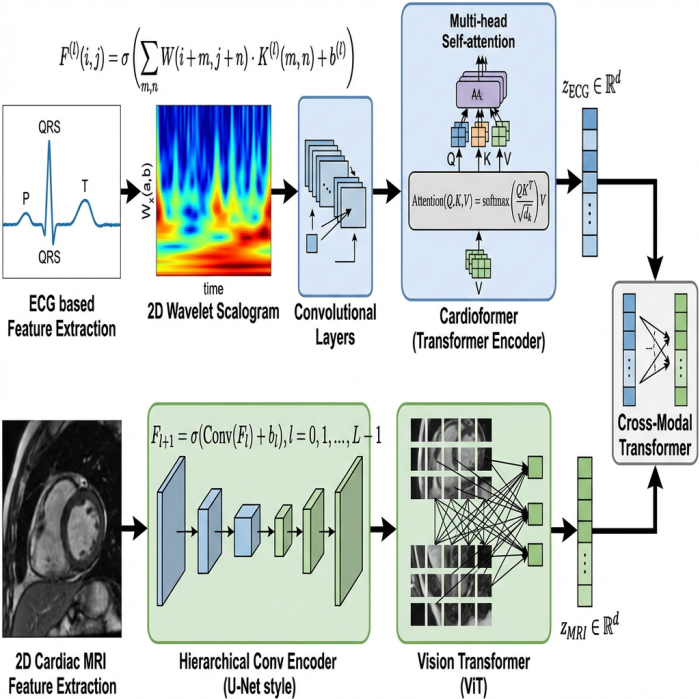
Figure 3: Modality-specific feature extraction. The ECG branch converts the input signal to a two-dimensional wavelet scalogram, applies convolutional layers, and uses Cardioformer multi-head self-attention to obtain an ECG embedding. The cardiac MRI branch uses a hierarchical convolutional encoder followed by a Vision Transformer to obtain an MRI embedding. The two modality-specific embeddings are then supplied to the Cross-Modal Transformer for multimodal integration. Original figure generated for this manuscript; no third-party image was reproduced or adapted. Please click here to view a larger version of this figure.
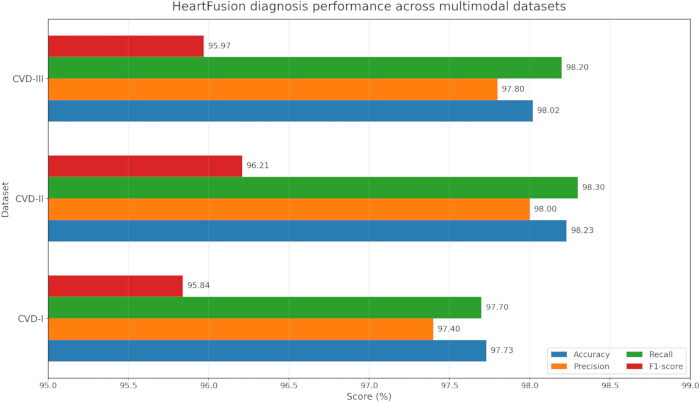
Figure 4: HeartFusion diagnosis performance across the multimodal CVD datasets. The horizontal bar chart displays accuracy, precision, recall, and F1-score for CVD-I, CVD-II, and CVD-III, illustrating consistently high diagnostic performance across the three cohorts. Please click here to view a larger version of this figure.
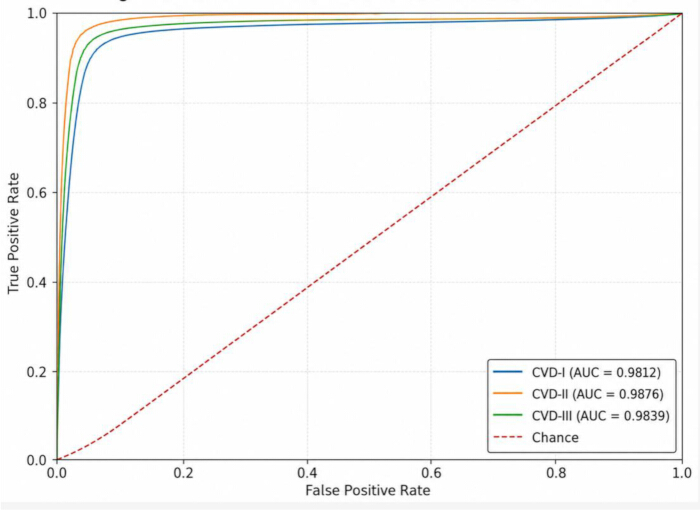
Figure 5: Receiver operating characteristic (ROC) curves for HeartFusion across the three pseudo-paired cohorts. The curves show AUC values of 98.12% for CVD-I, 98.76% for CVD-II, and 98.39% for CVD-III. The dashed diagonal line represents chance-level discrimination. Please click here to view a larger version of this figure.
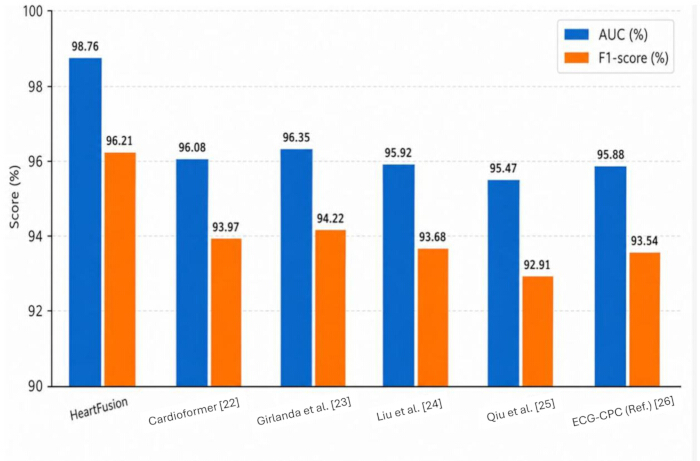
Figure 6: Comparison of HeartFusion and selected baseline/reference diagnosis metrics. The bar chart displays AUC and F1-score for HeartFusion, Cardioformer22, Girlanda et al.23, Liu et al24, Qiu et al.25, and the ECG reference shown in the figure26. HeartFusion achieved 98.76% AUC and 96.21% F1-score23 , the closest multimodal reference, achieved 96.35% AUC and 94.22% F1-score. Because the comparator studies differ in tasks, datasets, and evaluation protocols, the broader comparison should be interpreted contextually rather than as a uniform head-to-head benchmark. Please click here to view a larger version of this figure.
| Reference | Core Method | Dataset | Accuracy | Major Limitations |
| Yoon et al.15 | Multimodal stacking ensemble (ResNet-50 and logistic regression) | ECG scalogram and ECG grayscale images (Chapman and Shaoxing) | 93.97% | Limited to image-based ECG transformation; no ordinal staging support |
| Singh et al.16 | Adaptive gated spatial CNN for ultrasound | Ultrasound imaging | 95.45% | Requires validation across populations; limited modality diversity |
| Zhu et al.17 | Dual-scale deep residual network (DDR-Net) | ECG and phonocardiogram (PhysioNet 2016 Challenge) | 91.6% | Limited prior ECG-PCG fusion evidence; possible feature loss in deep fusion |
| Brendel et al.18 | Deep learning (CorEx and Spimed-AI) on photon-counting CCTA | Photon-counting coronary CT angiography | 88.1% (vessel level) | Requires clinical expert validation; low positive predictive value at vessel level |
| Botros et al.19 | CNN and XGBoost with ECG-blood-test fusion | MIMIC-IV ECG and blood tests | 93.46% | Depends on structured blood tests; fusion interpretability is limited |
Table 1: Summary of prior cardiovascular AI and multimodal studies. This table summarizes representative artificial intelligence studies for cardiovascular diagnosis, highlighting the data modalities, datasets, methodological approaches, prediction tasks, principal findings, and limitations relevant to the development of HeartFusion.
| Dataset ID | ECG Source | MRI Source | ECG Samples | MRI Samples | Description |
| CVD-I | PTB-XL | ACDC | 3200 | 800 | ECG-MRI records aligned by diagnostic label |
| CVD-II | MIMIC-IV-ECG | CMRxRecon | 3600 | 900 | Records aligned using diagnosis and available metadata such as heart rate and left ventricular ejection fraction |
| CVD-III | PTB-XL / MIMIC-IV-ECG | OCMR / Cardiac Atlas Project | 3400 | 850 | Synthetic alignment for ordinal severity evaluation using clustering and staging heuristics |
Table 2: Source datasets and composition of the pseudo-paired multimodal cohorts used in HeartFusion. This table presents the ECG and cardiac MRI datasets used to construct the CVD-I, CVD-II, and CVD-III cohorts, together with their composition and pseudo-pairing strategy. The ECG and MRI samples were paired at the phenotype or diagnostic-category level rather than at the individual-patient level; therefore, the resulting cohorts do not represent true same-patient multimodal observations.
| Parameter | Value / Setting |
| Train / validation / test split | 70% / 15% / 15% at subject level |
| Optimizer | Adam |
| Initial learning rate | 1 x 10⁻⁴ with cosine annealing |
| Maximum epochs | 100 with early stopping based on validation loss |
| Batch size | 16 |
| Loss functions | Margin-based binary cross-entropy for diagnosis; cumulative ordinal loss for staging |
| Regularization | Dropout = 0.3; weight decay = 1 x 10⁻⁵ |
| Evaluation metrics | Accuracy, precision, recall, F1-score, AUC, Cohen kappa, ordinal accuracy, and MAE |
| Fusion regularization | Optional manifold-alignment loss |
| Repeated runs | Five independent random seeds |
Table 3: Training and evaluation configuration. This table reports the principal implementation settings, including data partitioning, random seeds, optimization parameters, training hyperparameters, loss functions, and evaluation metrics used for diagnostic classification and ordinal severity staging.
| Dataset | Ordinal Accuracy (%) | Cohen Kappa | MAE |
| CVD-I | 90.92 | 0.828 | 0.352 |
| CVD-II | 91.46 | 0.839 | 0.340 |
| CVD-III | 91.18 | 0.833 | 0.344 |
Table 4: HeartFusion severity-staging results across the three pseudo-paired cohorts. This table reports the ordinal severity-staging performance of HeartFusion on CVD-I, CVD-II, and CVD-III using ordinal accuracy, Cohen’s kappa, and mean absolute error (MAE).
| Model | Ordinal Accuracy (%) | Cohen Kappa | MAE |
| Girlanda et al. (2024) | 85.2 | 0.73 | 0.59 |
| Qiu et al. (2024) | 82.4 | 0.68 | 0.66 |
| HeartFusion | 91.46 | 0.839 | 0.34 |
Table 5: Severity-staging performance comparison under the study evaluation setup. This table compares HeartFusion with the selected baseline models under the same dataset partitions, pseudo-pairing protocol, training conditions, and evaluation measures
| Dataset | Model | AUC (%) | F1-score (%) | Ordinal accuracy (%) | Cohen’s k | MAE |
| CVD-I | ECG-only | 93.10 ± 0.49 | 89.31 ± 0.54 | 83.20 ± 0.61 | 0.676 ± 0.026 | 0.687 ± 0.040 |
| CVD-I | MRI-only | 93.78 ± 0.45 | 89.92 ± 0.50 | 84.03 ± 0.57 | 0.691 ± 0.024 | 0.653 ± 0.037 |
| CVD-I | HeartFusion | 98.12 ± 0.20 | 95.84 ± 0.27 | 90.92 ± 0.34 | 0.828 ± 0.012 | 0.352 ± 0.019 |
| CVD-II | ECG-only | 93.42 ± 0.51 | 89.74 ± 0.56 | 83.61 ± 0.63 | 0.683 ± 0.027 | 0.674 ± 0.041 |
| CVD-II | MRI-only | 94.08 ± 0.47 | 90.28 ± 0.52 | 84.32 ± 0.59 | 0.697 ± 0.025 | 0.641 ± 0.038 |
| CVD-II | HeartFusion | 98.76 ± 0.18 | 96.21 ± 0.24 | 91.46 ± 0.31 | 0.839 ± 0.011 | 0.340 ± 0.018 |
| CVD-III | ECG-only | 92.88 ± 0.53 | 89.08 ± 0.58 | 82.96 ± 0.65 | 0.668 ± 0.028 | 0.701 ± 0.043 |
| CVD-III | MRI-only | 93.65 ± 0.48 | 89.76 ± 0.53 | 83.88 ± 0.60 | 0.689 ± 0.026 | 0.658 ± 0.039 |
| CVD-III | HeartFusion | 98.39 ± 0.21 | 95.97 ± 0.26 | 91.18 ± 0.33 | 0.833 ± 0.012 | 0.344 ± 0.019 |
Table 6: Comparison of multimodal HeartFusion with ECG-only and MRI-only variants across datasets. This table compares the complete multimodal HeartFusion framework with its ECG-only and MRI-only variants across CVD-I, CVD-II, and CVD-III. All variants were evaluated using the same partitioning and experimental protocol to determine the contribution of multimodal ECG–MRI fusion
| Model configuration | AUC (%) | F1-score (%) | Ordinal accuracy (%) | Cohen’s (\kappa) | MAE |
| Complete HeartFusion | 98.76 ± 0.18 | 96.21 ± 0.24 | 91.46 ± 0.31 | 0.839 ± 0.011 | 0.340 ± 0.018 |
| Without wavelet ECG representation | 96.02 ± 0.31 | 93.11 ± 0.38 | 88.16 ± 0.44 | 0.781 ± 0.016 | 0.472 ± 0.026 |
| Without Cardioformer attention | 95.64 ± 0.37 | 92.58 ± 0.41 | 87.74 ± 0.47 | 0.769 ± 0.018 | 0.491 ± 0.029 |
| Without TransUNet encoder | 95.21 ± 0.42 | 91.93 ± 0.46 | 86.85 ± 0.51 | 0.751 ± 0.020 | 0.528 ± 0.031 |
| Concatenation instead of cosine alignment | 95.83 ± 0.34 | 92.84 ± 0.39 | 87.95 ± 0.45 | 0.776 ± 0.017 | 0.486 ± 0.027 |
| Late fusion instead of cross-modal Transformer | 94.96 ± 0.45 | 91.76 ± 0.49 | 86.63 ± 0.54 | 0.742 ± 0.022 | 0.551 ± 0.034 |
| Without manifold-alignment loss | 97.04 ± 0.29 | 94.63 ± 0.35 | 89.10 ± 0.40 | 0.801 ± 0.015 | 0.421 ± 0.024 |
| Softmax severity classifier instead of ordinal head | 98.51 ± 0.21 | 96.08 ± 0.27 | 87.41 ± 0.49 | 0.748 ± 0.021 | 0.582 ± 0.033 |
| ECG-only model | 93.42 ± 0.51 | 89.74 ± 0.56 | 83.61 ± 0.63 | 0.683 ± 0.027 | 0.674 ± 0.041 |
| MRI-only model | 94.08 ± 0.47 | 90.28 ± 0.52 | 84.32 ± 0.59 | 0.697 ± 0.025 | 0.641 ± 0.038 |
Table 7: Ablation study of HeartFusion components on CVD-II. This table evaluates the contribution of individual HeartFusion components by removing one component at a time from the complete framework.
Tartışma
HeartFusion provided a cross-modality transformer framework for CVD diagnosis and severity assessment using ECG and cardiac MRI information. Across the three constructed cohorts, the multimodal configuration achieved higher diagnostic and severity-staging metrics than the selected baseline and unimodal configurations. The complementary electrical and structural modalities allowed phenotype-level information to be represented jointly9. The pseudo-pairing strategy was used only to construct the experimental cohorts and was not intended to represent patient-specific physiological correspondence. Consequently, the present findings require validation on genuinely paired ECG and MRI examinations before clinical deployment.
A major contributor to performance was the cosine-similarity-based fusion scheme. Directional alignment in the shared latent space enabled cross-modal correspondence without relying only on direct concatenation or decision-level averaging16. The wavelet ECG representation provided localized time-frequency information, while transformer encoders modeled longer-range dependencies across both physiological and image-derived features. The complete configuration achieved 98.76% AUC and 96.21% F1-score on CVD-II under the reported evaluation protocol.
Severity results further indicated that explicit ordinal modeling was beneficial. The best ordinal accuracy was 91.46%, Cohen's kappa was 0.839, and MAE was 0.340. In contrast to a flat multiclass classifier, the ordinal head preserved ordered stage relationships and reduced the penalty structure associated with clinically adjacent severity levels. Performance remained consistent across the three independently constructed cohorts, supporting robustness to heterogeneous source repositories within the limits of the study design. However, cross-dataset consistency should not be interpreted as proof of clinical generalizability because the cohorts were constructed through phenotype-level matching rather than true patient-level multimodal acquisition.
A fundamental limitation was the absence of ECG and cardiac MRI examinations acquired from the same patients. The multimodal samples were constructed as controlled pseudo-pairs using harmonized diagnostic categories, severity stages, age, and sex. The observed gain over unimodal variants therefore provides evidence of complementary phenotype-level information but cannot establish direct subject-specific ECG-MRI correspondence. Partitioning before pseudo-pair construction prevented source observations and derived samples from crossing training, validation, and test sets, and validation/test pairings were fixed across runs. Nevertheless, future evaluation should use genuinely patient-matched ECG-MRI cohorts and should include label-preserving random-pairing, pairing-permutation, and label-only controls to quantify any contribution from pseudo-pair construction.
HeartFusion combined wavelet-based ECG representation, transformer-enhanced MRI encoding, geometry-aware cross-modal fusion, and ordinal regression in a unified framework. The reported results supported the value of integrating modality-specific features with cross-modal interactions, but clinical translation will require patient-matched validation, external institutional testing, and prospective assessment. Additional modalities such as laboratory measurements, structured clinical history, and wearable-sensor data may further improve individualized modeling, while self-supervised pretraining may reduce dependence on fully annotated multimodal datasets.
Açıklamalar
The authors declare no conflicts of interest.
Teşekkürler
No additional acknowledgments were reported.
Malzemeler
| Ad | Şirket | Katalog numarası | Yorumlar |
|---|---|---|---|
| ACDC Cardiac MRI Dataset | ACDC Challenge | https://www.creatis.insa-lyon.fr/Challenge/acdc/ | Cardiac MRI dataset used for construction of the CVD-I cohort |
| Cardiac Atlas Project Dataset | Cardiac Atlas Project | https://www.cardiacatlas.org/ | Cardiac imaging data used for construction of the CVD-III cohort |
| Cardioformer | N/A – open-source model | N/A | Transformer-based ECG encoder used to process wavelet-derived ECG scalograms |
| CMRxRecon Dataset | CMRxRecon Challenge | CMRxRecon | Cardiac MRI dataset used for construction of the CVD-II cohort |
| MIMIC-IV-ECG | PhysioNet | https://physionet.org/content/mimic-iv-ecg/ | ECG dataset used for construction of CVD-II and CVD-III cohorts |
| OCMR Dataset | OCMR | https://ocmr.info/ | Cardiac MRI dataset used for construction of the CVD-III cohort |
| PTB-XL ECG Dataset | PhysioNet | https://physionet.org/content/ptb-xl/1.0.3/ | Public ECG dataset used for construction of CVD-I and CVD-III cohorts |
| TransUNet | N/A – open-source model | https://github.com/Beckschen/TransUNet | Transformer-enhanced image encoder used for cardiac MRI feature extraction |
Kaynaklar
- Cannata A, McDonagh TA. Heart failure with preserved ejection fraction. N Engl J Med. 2025;392(2):173-184.
- Li XH, Yang XL, Dong BB, Liu Q. Predicting 28-day all-cause mortality in patients admitted to intensive care units with pre-existing chronic heart failure using the stress hyperglycemia ratio: a machine learning-driven retrospective cohort analysis. Cardiovasc Diabetol. 2025;24(1):10.
- Zhang H et al. The burden and trends of heart failure caused by ischaemic heart disease at the global, regional, and national levels from 1990 to 2021. Eur Heart J Qual Care Clin Outcomes. 2025;11(2):186-196.
- Xie Y et al. Artificial intelligence in the diagnosis of heart failure. J Am Heart Assoc. 2025;14(8):e039511.
- Sharma A et al. A systematic review on machine learning intelligent systems for heart disease diagnosis. Arch Comput Methods Eng. 2025:1-27.
- Kumar K et al. Electro Cardio Gram using different machine learning techniques for early heart attack prediction. J Neonatal Surg. 2025;14(19s):769-776.
- Srivastava AP, Vivekanandam B, Khan M. Machine learning in cardiovascular disease prediction: a comparative study of classification models. SGS Eng Sci. 2025;1(1).
- Li D et al. A multimodal dataset for coronary microvascular disease biomarker discovery. Sci Data. 2025;12(1):990.
- Shiwlani A et al. Analysis of multi-modal data through deep learning techniques to diagnose CVDs: a review. International Journal. 2024;11(1):402-420.
- Alsekait DM et al. Heart-Net: a multi-modal deep learning approach for diagnosing cardiovascular diseases. Comput Mater Contin. 2024;80(3).
- Wang S et al. WCFormer: an interpretable deep learning framework for heart sound signal analysis and automated diagnosis of cardiovascular diseases. Expert Syst Appl. 2025;276:127238.
- Gawande N, Goyal D, Sankhla K. Survey on DL-driven multi-modal data in cardiovascular disease prediction. In: 2025 International Conference on Machine Learning and Autonomous Systems (ICMLAS). IEEE; 2025. p. 235-242.
- Hussain I et al. AI-enhanced integration of multimodal data for early prediction of heart failure exacerbations in high-risk groups. The Research of Medical Science Review. 2025. Zenodo:15181126.
- Yoon T, Kang D. Multi-modal stacking ensemble for the diagnosis of cardiovascular diseases. J Pers Med. 2023;13(2):373.
- Singh A et al. Deep learning based coronary artery disease detection and segmentation using ultrasound imaging with adaptive gated SCNN models. Biomed Signal Process Control. 2025;105:107637.
- Zhu J, Liu H, Liu X, Chen C, Shu M. Cardiovascular disease detection based on deep learning and multi-modal data fusion. Biomed Signal Process Control. 2025;99:106882.
- Brendel JM et al. Coronary artery disease detection using deep learning and ultrahigh-resolution photon-counting coronary CT angiography. Diagn Interv Imaging. 2025;106(2):68-75.
- Botros J, Mourad-Chehade F, Laplanche D. Explainable multimodal data fusion framework for heart failure detection: integrating CNN and XGBoost. Biomed Signal Process Control. 2025;100:106997.
- Pasam G, Gupta S, Shaik H. AIoMT-based multi-model soft computing techniques for the prediction of heart disease. Iraqi J Sci. 2025.
- Kamrujjaman Mobin M, Saiful Islam M, Al Barid S, Masum M. Cardioformer: advancing AI in ECG analysis with multi-granularity patching and ResNet. arXiv. 2025;arXiv-2505.
- Chen J et al. TransUNet: rethinking the U-Net architecture design for medical image segmentation through the lens of transformers. Med Image Anal. 2024;97:103280.
- Mobin M, Raihan A, Jamil S, Maji S. Cardioformer: a transformer-based multi-granularity ECG classification framework. arXiv. 2025;2505.05538.
- Girlanda F, Zhuang X, Bai W, Rueckert D. Enhancing cardiovascular disease prediction through multimodal self-supervised learning. arXiv. 2024;2411.05900.
- Liu Z. Multimodal fusion of spatial-temporal and frequency representations for ECG classification. Artif Intell Rev. 2025.
- Qiu Y, Zhang J, Li M, Zhou Y, Wang Z. Deep learning-based multimodal fusion for atrial fibrillation recurrence prediction. BMC Med Inform Decis Mak. 2024;24(1):106.
- Al-Masud MA, Lopez Alcaraz JM, Strodthoff N. Benchmarking ECG FMs: a reality check across clinical tasks. In: Proceedings of the International Conference on Learning Representations (ICLR); 2026.