This protocol describes procedures for extracting mouse eyeballs, staining retinal tissue, and visualizing and quantifying retinal ganglion cells to assess inflammation-mediated neurodegeneration in experimental mouse models of multiple sclerosis.
Yöntem makalesi
Retinal Ganglion Cell Quantification for Evaluating Neurodegeneration in Mouse Models of Multiple Sclerosis
Bu makalede
Özet
Özet
Quantification of retinal ganglion cell (RGC) loss provides a sensitive and reproducible measure of neurodegeneration in mouse models of neurological disease and injury. In experimental autoimmune encephalomyelitis (EAE), a widely used mouse model of multiple sclerosis, inflammation of the optic nerve can lead to optic neuritis, axonal injury, and progressive RGC loss. Therefore, quantification of RGC survival provides a valuable readout of inflammation-mediated neurodegeneration and can be used to evaluate disease severity and neuroprotective interventions. Here, we describe a protocol for retinal dissection, flatmount preparation, immunostaining, and quantification of RGCs in the mouse retina. Using whole-mount preparations, this method preserves the structure and spatial organization of the retina, which allows visualization and quantification of RGCs using markers such as Brn3a. This protocol enables reliable identification and quantification of Brn3a-positive RGCs. When combined with complementary neuronal and stress markers, changes in labeling intensity and cellular morphology can help identify stressed or injured RGCs and distinguish reduced marker expression from overt cell loss. Representative results demonstrate that the protocol detects both early RGC stress and overt RGC loss in EAE mice. This approach provides a robust and scalable framework for evaluating inflammation-driven neuronal injury and assessing neuroprotective strategies in preclinical studies.
Giriş
Multiple sclerosis (MS) is a chronic autoimmune inflammatory disease of the central nervous system (CNS). It is characterized by immune-mediated demyelination, glial activation, axonal injury, and neuronal loss, which contribute to irreversible disability1,2,3,4. Optic neuritis, a frequent manifestation of MS, involves inflammatory injury to the optic nerve and is often associated with acute visual impairment followed by incomplete recovery and chronic retinal neurodegeneration5,6,7,8.
Both patients with MS and mouse models such as experimental autoimmune encephalomyelitis (EAE) exhibit loss of retinal ganglion cells (RGCs), the neurons whose axons form the optic nerve and are particularly vulnerable to inflammatory and metabolic stress9,10,11,12. RGC neurodegeneration persists beyond the acute inflammatory phase and has been shown to correlate with long-term structural abnormalities, visual dysfunction, and disease progression in both clinical and preclinical studies10,11,13,14.
The retina provides a valuable system for studying inflammation-associated neurodegeneration in EAE and optic neuritis15,16,17,18. In these models, immune cells attack the optic nerve, which is directly connected to the retina through the axons of RGCs (Figure 1A). This makes the eye a unique site where both inflammatory injury in the optic nerve and neuronal loss in the retina can be measured within the same visual pathway. Because RGCs are organized in a well-defined layer and can be identified using specific markers such as Brn3a or RBPMS, the retina provides a reliable and accessible tissue for quantifying neuronal damage19,20. This is especially valuable for studying the relationship between CNS inflammation, glial activation, axonal injury, and neuronal loss, as well as for evaluating novel therapeutic strategies aimed at protecting neurons during neuroinflammatory disease.
The adoption of unbiased stereological techniques over the last several decades was an important methodological advance for studying neurodegeneration21,22,23. These approaches allow investigators to estimate the total number of neurons in three dimensions without bias from differences in cell size, shape, or orientation. More recently, advances in high-resolution confocal microscopy, tissue clearing, and computational image analysis have further refined neuronal counting strategies in inflammatory models24,25,26. Semi-automated and machine-learning–based segmentation pipelines now enable large-scale, spatially resolved quantification of neurons across regions of the CNS and retina, while maintaining strong concordance with classical stereological estimates when appropriately validated27,28.
In this protocol, we describe a detailed workflow for retinal flatmount preparation, RGC immunostaining, and quantitative analysis of RGCs together with additional markers of interest. The protocol incorporates experimental and analytical elements tailored to the study of neuronal stress, degeneration, and neuroprotection in neuroinflammatory disease. Together, these elements provide a robust platform for mechanistic studies and preclinical evaluation of candidate neuroprotective interventions.
Protokol
All procedures involving animals were reviewed and approved by the Institutional Animal Care and Use Committee of Johns Hopkins University (Protocol number: MO25M330). Buffers, reagents, and tools used in this protocol are listed in the Table of Materials.
1. Harvesting adult mouse eyes for retinal flatmount dissection
- Induce EAE according to established protocols. For analysis of stressed or injured RGCs, harvest eyes at peak disease (generally 14-16 days post EAE induction). For analysis of RGC degeneration and loss, harvest eyes at day 42 post-EAE induction or at a later chronic disease time point.
- Following deep anesthesia according to the approved institutional animal protocol, perform transcardial perfusion with at least 30 mL PBS to remove blood from the ocular and CNS vasculature.
- Carefully enucleate the eyes using curved forceps by gently pulling the eyeball together with the optic nerve. Immediately place the intact eyes in 4% paraformaldehyde (PFA) and fix for at least 4 h, up to overnight, at room temperature (RT) on a shaker.
CAUTION: Paraformaldehyde is toxic. Handle PFA in a certified chemical fume hood while wearing appropriate personal protective equipment. Collect and dispose of PFA-containing waste according to institutional safety requirements.- If transcardial perfusion with PFA is required for the experiment, perform enucleation before perfusion, as fixation significantly stiffens the eye tissues and makes enucleation difficult.
- Before placing the eye and attached optic nerve in PFA, gently straighten the optic nerve, as fixation makes it rigid and difficult to reposition. This step is particularly important for downstream immunohistochemistry (IHC) of the optic nerve.
NOTE: The fixation conditions were validated using immersion fixation of the intact whole eye in 4% PFA for 4 h before retinal dissection. Removing the cornea and lens before fixation was not evaluated in this study and would require independent optimization of fixation and antigen-retrieval conditions.
- After fixation, transfer the eyes (that will be used for retina dissections) to fresh PBS to prepare for dissection.
- If the retina cannot be dissected immediately, transfer the eye to 30% sucrose solution in PBS (1–2 mL) and incubate at 4 °C for 24–48 h, or until the eyes sink.
- For short-term preservation, keep the eyes in 30% sucrose at 4 °C for up to 3 weeks before subsequent processing. However, prolonged storage may affect antigenicity and staining quality.
- Dissect whole retinas from the fixed eyeballs using fine forceps and scissors. First, remove the anterior portion of the eye, including the cornea and lens (Figure 1B).
- Next, carefully separate the retina from the sclera, taking care to avoid tearing or damaging the retinal tissue. Using precision scissors, make four radial cuts in each retina to allow the tissue to relax and flatten, creating a “clover-like” shape. If the retina already contains a tear, use the tear as one of the four loosening cuts (Figure 1B).
- Careful dissection of the retina from the mouse eyeball is essential, as excessive force or incomplete separation from surrounding tissues can introduce tears, folding artifacts, or tissue distortion that compromise downstream imaging and cell enumeration.
NOTE: The four radial relaxing cuts are particularly important for generating a flattened whole-mount preparation while preserving retinal architecture and spatial orientation. When pre-existing tears are observed, incorporating these defects into one of the planned relaxing incisions minimizes additional mechanical damage.
- Careful dissection of the retina from the mouse eyeball is essential, as excessive force or incomplete separation from surrounding tissues can introduce tears, folding artifacts, or tissue distortion that compromise downstream imaging and cell enumeration.
- Using a fine brush, gently pick up and handle the retina and transfer it into a 12-well plate containing PBS. Under a dissection microscope, carefully flatten the retina in the well using the brush. Avoid applying excessive pressure, as this may damage the retinal tissue, particularly the retinal surface and RGC layer.
- Maintain the correct orientation during flattening. The inner retinal surface, containing the RGC layer, should face upward, while the outer retinal surface, adjacent to the sclera, should face downward. Once the retina is flattened, gently place a small, round coverslip over the tissue and add PBS until the retina is fully covered beneath the coverslip.
NOTE: This helps reduce wrinkles and maintains the retina in a flat position for subsequent washing and staining steps.- Use only a minimal volume of PBS. Add just enough PBS to keep the retina hydrated and covered under the coverslip, but not so much that the retina floats.
- Samples can be stored at 4 °C for up to 2–3 days until all tissues from the cohort have been collected. To prevent drying, maintain samples in a humidified chamber, for example, by wrapping the plate in a damp paper towel and sealing it with plastic wrap.
NOTE: Ensure that the samples remain moist at all times. Alternatively, retinas may be stored in a 24-well plate containing 1 mL PBS per well for 2–3 days, ensuring that the tissue remains fully submerged.
2. Staining the retina
- On the day of staining, wash the retinas in PBS. Using a fine brush, gently transfer each retina into a 1.5 mL microcentrifuge tube containing 1 mL sodium citrate solution (10 mM, pH 6.0) for antigen retrieval.
- Place the tubes in a heat block at 80 °C for 30 min. Following incubation, remove the tubes and allow them to cool at RT for 10 min.
- Transfer the retinas to 3% Triton X-100 in PBS and perform three 1h permeabilization incubations at room temperature on a shaker with gentle agitation, replacing the solution between incubations.
NOTE: In our laboratory, this permeabilization condition provides reproducible antibody penetration in intact retinal flatmount for the nuclear, cytoplasmic, cytoskeletal, stress-associated, and glial markers evaluated in this protocol. Because detergent concentration and incubation time can affect antigenicity and tissue morphology, optimize the Triton X-100 concentration and incubation duration when using additional antibodies, particularly those targeting membrane-associated or synaptic proteins.- Prepare the 3% Triton X-100 permeabilization solution on the day of use and mix thoroughly before adding it to the retinas. Ensure that for each step, the shaker is set to a minimum speed while still slowly moving the solutions.
- Prepare a blocking solution containing 5% normal goat serum and 1% Triton X-100 in PBS. Transfer each retina to a 48-well plate containing 400 µL of blocking solution per well. Incubate for 2 h at room temperature on a shaker with gentle agitation.
- Add the primary antibody or antibody mixture directly to the blocking solution containing each free-floating retina. Incubate for 72 h at 4 °C on a shaker with gentle agitation.
NOTE: RGCs may be detected using the nuclear marker Brn3a or the cytoplasmic marker RBPMS29. These markers may be combined with other markers including GFAP, p-cJun, or βIII-tubulin as described in the Table of Materials. - Transfer each retina to a 12-well plate containing PBS. Wash three times for 1 h per wash at room temperature on a shaker with gentle agitation.
- Transfer each retina to a 48-well plate containing 400 µL of secondary antibody solution. Incubate overnight at 4 °C on a shaker with gentle agitation.
- Transfer each retina to a 12-well plate containing PBS. Wash three times for 1 h per wash at room temperature on a shaker with gentle agitation.
3. Cleaning and mounting the retina
- Place the free-floating retinas in fresh PBS and keep them floating in PBS at RT until mounting.
- Using a fine brush, gently guide each free-floating retina out of the PBS and transfer it onto a clean glass slide. Carefully spread the retina into a flattened “clover” shape, ensuring the tissue remains properly oriented and as flat as possible. Allow the retina to dry for ~5–8 min, or until the retina itself is nearly dry (still moist on the glass slide without any remaining “puddle” surrounding it, but not dry enough to cause tissue shrinkage/shriveling).
- During flattening, apply gentle pressure with the brush around, rather than directly on, the optic nerve head to flatten the retinal leaflets while maintaining tissue integrity. The retina is considered adequately flattened when all four leaflets rest in a single plane, and no visible folds, wrinkles, or areas of tissue overlap remain.
- Use an absorbent paper towel to gently wick away excess buffer from the edges of the retina. Before mounting, allow the retina to air dry slightly on the slide so that it adheres to the glass; however, do not allow the tissue to dry completely or begin to wilt.
- Apply several drops of the antifade mounting medium to a glass coverslip. Slowly lower the coverslip over the retina, allowing the mounting medium to spread without pressing directly on the tissue. Use a substantial amount of mounting medium here (due to the thickness of each retina) before carefully dropping the coverslip onto the glass slide.
- During mounting, insufficient antifade medium or rapid coverslip placement may introduce compression artifacts, air bubbles, or tissue folding. When placing the coverslip, do not press directly on the tissue to spread the mounting medium. Instead, allow the medium to distribute naturally. If adjustment is needed, apply gentle pressure only at the edges (corners) of the coverslip, not over the tissue itself.
- Allow the slides to sit flat at RT until the mounting medium fully embeds the tissue and seals the coverslip onto the slide. Store the slides flat at 4 °C in the dark until imaging.
4. Imaging and quantification
- Image the retinal flatmounts using a fluorescence microscope. Acquire images of the entire flatmount at 20× magnification (Figure 1C).
- Capture images as a z-stack of approximately 8 optical layers to ensure adequate sampling through the thickness of the retinal tissue and to include the RGC layer. Keep consistent imaging settings, including exposure time, laser intensity, gain, and z-step size, across all samples within the experiment.
- After imaging the whole retina, segment each retinal flatmount into four quadrants. Further divide each quadrant into three regions: central, middle, and peripheral retina, for a total of 12 regions per retina (Figure 1C).
- Within each of the four retinal sectors, select one central, one middle, and one peripheral ROI based on relative eccentricity from the optic nerve head to the retinal margin. Apply the same selection criteria to all retinas while masked to the experimental group, and avoid major vessels, folds, tears, and damaged tissue.
- Avoid selecting regions that are folded, damaged, torn, or contain excessive vasculature, as these areas may interfere with accurate RGC quantification.
- Count labeled RGCs in each region at 20× magnification. Average the counts from all 12 regions to calculate the representative RGC density for each mouse retina (Figure 1C). Perform all analyses masked to genotype and behavioral score, and compare automated counts with manual counts when applicable.
NOTE: RGCs can be quantified across all 12 regions using the automated MATLAB script9. Briefly, the image files are exported as tagged image file format (TIF) and imported into a custom MATLAB-based size segmentation algorithm to perform automated counts9. Each segment is approximately 350 × 350 µm. Cells in the selected retinal segment undergo filtering, automatic or user-defined thresholding, and binarization, followed by identification of cell boundaries. The RGC density is reported and expressed as counts per mm2.
Sonuçlar
This protocol provides a reproducible approach for quantifying RGC survival in flat-mounted mouse retinas in different experimental models of neuroinflammation and neurodegeneration. In previous studies, this method was used to demonstrate that EAE induces significant RGC loss at chronic stages of the disease, whereas RGC numbers are relatively preserved at early or peak disease stages. RGCs were labeled in whole-mounted retinas using an anti-Brn3a antibody, and Brn3a-positive nuclei were quantified using a semi-automated MATLAB-based algorithm9.
To optimize the staining strategy for RGC quantification, we compared three commonly used neuronal/RGC markers in retinal flatmounts: RBPMS, Brn3a, and neuronal nuclei (NeuN). All three antibodies labeled neurons within the ganglion cell layer and produced comparable overall staining patterns9. However, Brn3a offers several practical advantages for quantitative analysis, including strong nuclear localization, a high signal-to-noise ratio, and well-defined cell boundaries that facilitate reliable automated detection and counting. Brn3a and RBPMS staining can be combined to detect RGC loss in manual quantification.
As shown in Figure 2, retinal flatmounts were imaged on a fluorescence microscope using a Plan-Apochromat 20×/0.8 NA objective. Whole-retina tiled z-stack images (56 tiles, 8 optical sections over a total depth of 7 µm) were acquired at a sampling resolution of 0.345 µm/pixel. Acquisition of z-stacks across this relatively large and uneven tissue preparation facilitates identification of the optimal focal plane throughout the retina and ensures accurate visualization and quantification of Brn3a-positive RGCs. These details have been added to improve the reproducibility of the imaging and quantification workflow.
For quantification, retinal images were analyzed using a customized MATLAB script9 that combines user-defined retinal segmentation, threshold adjustment, background subtraction, and automated cell detection. This approach allows quantification of overall mean RGC density and regional RGC density across defined retinal sectors (Figure 2A–C). These images illustrate the ability of the protocol to detect spatial differences in RGC survival in the retina and to compare RGC density between healthy/control and disease conditions.
In addition to quantifying RGC survival, the protocol can be adapted for multiplexed immunofluorescence staining to assess neuronal structure, stress signaling, glial activation, and retinal vasculature within the same retinal tissue. For example, Brn3a labeling can be combined with βIII-tubulin (Tuj1) to assess neuronal cytoskeletal integrity, and with phosphorylated c-Jun (p-cJun) to detect activation of neuronal stress pathways. It was previously observed that p-cJun expression closely follows EAE progression. Phosphorylated c-Jun, a downstream target of stress-activated MAPK signaling, is a key marker of RGC stress and injury. In control retinas, p-cJun expression is absent or detected in fewer than 1% of RGCs. Following EAE induction, p-cJun becomes detectable in approximately 11% of RGCs at disease onset and in more than 70% of RGCs at peak clinical disease (Figure 2D–F). Although total RGC numbers progressively decline during disease progression, the proportion of remaining RGCs expressing p-cJun remains high, suggesting ongoing neuronal stress and injury throughout the disease course. Co-staining with βIII-tubulin or Brn3a and p-cJun in flat-mounted retinas further demonstrates widespread activation of stress-associated signaling in RGCs from EAE mice compared with controls. βIII-tubulin staining is particularly important for identifying RGC cell bodies, as Brn3a expression is known to decrease in stressed, damaged, or neurodegenerating RGCs30. Consistent with this, we observed a significant inverse relationship between p-cJun and Brn3a expression intensity within individual RGCs (Figure 2G,H).
Together with RGC markers, the protocol enables immunofluorescence staining of glial fibrillary acidic protein (GFAP) to assess astrocyte and Müller glia activation (Figure 2I). Retinal vascular architecture can be examined using endothelial and vascular markers such as CD31 (PECAM-1), to visualize blood vessels31. These markers enable the assessment of vascular density, integrity, and potential neurovascular interactions under pathological conditions.
The current findings demonstrate that Brn3a-based whole-mount retinal staining combined with semi-automated MATLAB analysis is a robust and adaptable method for quantifying RGC survival. The approach can be used to compare control and disease conditions, evaluate temporal patterns of neurodegeneration, assess regional vulnerability across the retina, test candidate neuroprotective drugs, and define cellular or molecular pathways that regulate RGC injury during neuroinflammation. Its compatibility with additional neuronal and glial markers further expands its utility for mechanistic studies of retinal and optic nerve pathology in EAE and other models of neurodegenerative disease.
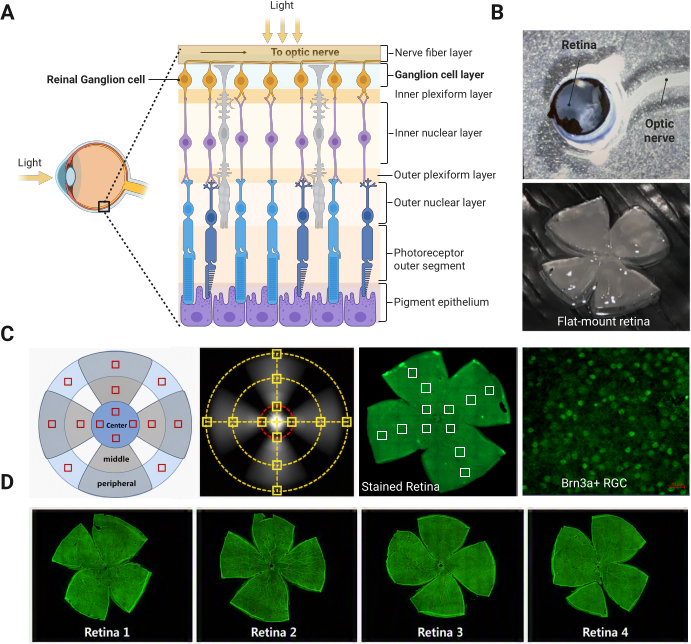
Figure 1: Retinal flatmount workflow for RGC staining and quantification. (A) Schematic illustration of retinal architecture highlighting retinal ganglion cells (RGCs) in the ganglion cell layer and their axonal projections through the nerve fiber layer toward the optic nerve. Major retinal layers are indicated. (B) Representative workflow for retinal preparation. Eyes are harvested with the optic nerve attached (top), followed by dissection and preparation of retinal flatmounts (bottom) for whole-retina imaging and quantitative analysis. (C) Strategy for systematic RGC sampling and quantification. The retina is divided into central, middle, and peripheral regions. Twelve sampling areas (red boxes) are distributed across the retina, consisting of four central, four middle, and four peripheral regions positioned in four radial sectors around the optic nerve head. Corresponding sampling locations are illustrated on the retinal flatmount, where regions are selected within each sector while avoiding major retinal vessels. Representative whole-retina Brn3a staining and a high-magnification image of Brn3a-positive RGCs are shown. (D) Representative retinal flatmounts obtained using our dissection protocol, illustrating the reproducibility and typical variation in flatmount preparation quality. Successful preparations retain four intact retinal leaflets positioned in a single plane, with minimal folding and limited peripheral tearing. Suboptimal preparations may contain folds, overlapping tissue, incomplete flattening around the optic nerve head, or extensive tears. Such artifacts can interfere with regional sampling and automated RGC segmentation and should be documented before analysis. Please click here to view a larger version of this figure.
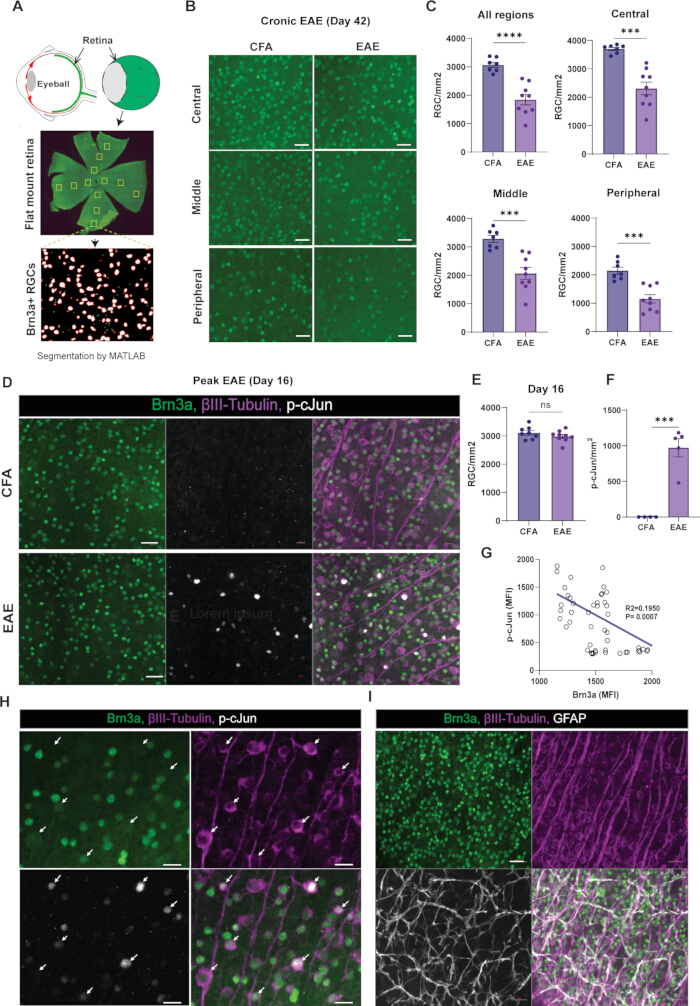
Figure 2: Quantification of RGC survival and stress responses in EAE. (A) Schematic of retinal flatmount preparation and regional sampling strategy, illustrating central, middle, and peripheral areas used for Brn3a⁺ RGC quantification, followed by automated segmentation analysis using MATLAB. (B) Representative images of Brn3a⁺ RGCs in retinal flatmounts from control (CFA) and chronic EAE mice (day 42), shown across central, middle, and peripheral regions. Scale bars, 50 µm. (C) Quantification of RGC density (RGC/mm2) across all regions and by retinal subregions (central, middle, peripheral), demonstrating significant RGC loss in EAE compared to CFA controls, n = 7 CFA and n = 9 EAE. (D) Representative immunofluorescence images at peak EAE (day 16) showing Brn3a, βIII-tubulin, and phosphorylated c-Jun (p-cJun) labeling in CFA and EAE retinas. (E) Quantification of RGC density at day 16 showing no significant difference between CFA and EAE groups at peak disease, n = 8 CFA and n = 9 EAE. (F) Quantification of p-cJun signal reveals increased neuronal stress signaling in EAE retinas compared to controls, n = 4 CFA and n = 5 EAE. (G) Correlation analysis between Brn3a intensity and p-cJun signal indicates an inverse relationship between RGC integrity and stress activation. (H) High-magnification images of p-cJun⁺ RGCs (arrows) demonstrating colocalization with neuronal markers and a negative correlation between p-cJun and Brn3a expression. Scale bars, 20 µm. (I) Representative images of Brn3a, βIII-tubulin, and GFAP immunostaining, illustrating glial activation and structural changes in the retinal network. Scale bars, 50 µm. Each data point in panels (C), (E), and (F) represents one retina/mouse. The data are presented as mean ± SEM with individual data points; statistical significance is indicated as ***p < 0.001, ns = not significant. Please click here to view a larger version of this figure.
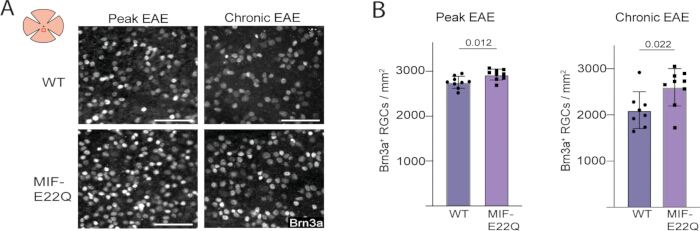
Figure 3: MIF-E22Q is neuroprotective in the retina during EAE. (A) Representative high-magnification regions of interest showing Brn3a-positive retinal ganglion cells in retinal flatmounts from WT and MIF-E22Q mice at peak and chronic stages of EAE. Scale bars, 50 µm. (B) Quantification of Brn3a-positive RGC density in WT and MIF-E22Q mice at peak and chronic EAE. At peak EAE, WT n = 9 and MIF-E22Q n = 9 mice. At chronic EAE, WT n = 8 and MIF-E22Q n = 9 mice. Data are presented as mean ± SD, and each data point represents one mouse. Statistical significance was determined using two-sided unpaired t-tests, with exact p-values indicated in the graphs. This figure is reproduced from Mace et al32. Please click here to view a larger version of this figure.
Tartışma
We have applied this Brn3a-based quantification method, which is compatible with additional markers, in multiple EAE models, including active EAE9,10,33 and spontaneous EAE34,35. The retinal quantification can also be paired with optic nerve histopathology, allowing investigators to evaluate neuronal cell body loss in the retina together with axonal degeneration, inflammatory infiltration, demyelination, and gliosis in the optic nerve. This combined retina–optic nerve analysis is particularly valuable for studies of anterior visual pathway injury in EAE and related models of inflammatory neurodegeneration. Our laboratory uses MS experimental models, including retinal injury and optic neuritis models, as a platform to study mechanisms of neurodegeneration and neuroprotection.
This protocol has also been used to test disease-modifying pathways and candidate neuroprotective interventions. For example, in the prior work, this RGC quantification approach was used to evaluate neurodegeneration in EAE mice and to compare RGC survival between Complete Freund’s Adjuvant (CFA) control and EAE groups at chronic disease stages. Using the same method, we have examined pathways implicated in inflammatory neurodegeneration, including NLRX134, MIF32, irisin-mediated neuroprotection36, and therapeutic interventions such as NLY0137 and LABP6634.
In studies of NLRX1, loss of NLRX1 was associated with increased RGC loss and axonal injury in EAE, supporting a neuroprotective role for NLRX1 in the anterior visual pathway. Similarly, recent work examining MIF-mediated neuronal injury showed that MIF-E22Q EAE mice had higher RGC counts at peak and chronic EAE time points compared with wild-type EAE mice, consistent with a neuroprotective effect of the MIF-E22Q mutation (Figure 3)32. These examples illustrate how this protocol can be used not only to compare healthy and disease states, but also to evaluate specific molecular pathways that regulate neuronal vulnerability or resistance during CNS inflammation.
RGCs can be identified using either Brn3a or RBPMS immunolabeling, as a previous study demonstrated that these markers yield broadly comparable RGC counts and reliably detect RGC loss9. Brn3a was selected for this protocol because it produces nuclear labeling with minimal background, making it suitable for semi-automated quantification9. However, Brn3a-based measurements may modestly underestimate absolute RGC density38, but remain appropriate for comparisons of RGC survival when staining and quantification conditions remain constant. Nevertheless, because neuronal stress may reduce Brn3a expression before cell death, validation using RBPMS or Brn3a/RBPMS co-labeling may be valuable when estimating total RGC survival or evaluating modest neuroprotective effects.
During mounting, insufficient antifade medium or rapid coverslip placement may introduce compression artifacts, air bubbles, or tissue folding. Excess moisture can lead to elevated background signals. A semi-dry mounting approach is recommended, with careful removal of residual buffer prior to mounting. Allowing retinas to partially dry and adhere to slides before coverslipping improves tissue flattening and enhances image consistency9,32,39.
A limitation of this method is that whole-mount preparations require terminal tissue collection and, therefore, cannot be used for longitudinal assessment in the same animal. One alternative is to use rodent retinal optical coherence tomography (OCT), which enables longitudinal assessment of retinal thickness without euthanizing the animal40. In addition, retinal extraction and flatmounting are operator-dependent procedures that require technical practice to minimize variability. Retinas are extremely fragile and tear easily, especially when extracted from the small mouse eyeball. Furthermore, while automated image analysis substantially increases throughput and reduces observer bias, segmentation algorithms may require manual correction in regions with tissue folds, high background fluorescence, or inflammatory infiltrates10,41,42. Retinal regions containing prominent vasculature may disrupt regular RGC tiling patterns and should be considered carefully when selecting ROIs.
Compared to traditional cross-section-based histology or density-based sampling, flatmount retinal analysis provides comprehensive spatial resolution across the entire retina and avoids under-sampling of regional neuronal loss7,8,9,10,19. This method is valuable in models of multiple sclerosis, optic neuritis, glaucoma, optic nerve crush injury, and other neurodegenerative or neuroinflammatory conditions where RGC loss serves as a robust endpoint1,9,10,11,32,43,44,45. Moreover, because RGCs are highly sensitive to inflammatory and metabolic stress46,47, this protocol provides a scalable and reproducible platform for evaluating neuronal injury, synaptic pathology, disease progression, and candidate neuroprotective interventions in preclinical studies.
In summary, the flatmount RGC quantification approach described here provides a robust, reproducible, and anatomically comprehensive method for assessing neurodegeneration in models of inflammatory and degenerative CNS disease. By preserving the native retinal architecture while enabling high-resolution immunolabeling and spatially distributed imaging, this protocol overcomes key limitations of section-based sampling strategies, including regional undersampling and stereological bias. When combined with validated RGC markers such as Brn3a and RBPMS and supported by automated or semi-automated image analysis pipelines, this method yields highly sensitive and spatially resolved measures of neuronal loss across the entire retina. Given the strong association between optic nerve inflammation, retinal neurodegeneration, and disability in multiple sclerosis and experimental autoimmune encephalomyelitis, this approach provides a valuable experimental platform for linking immune-mediated pathology to neuronal outcome measures. Altogether, this protocol enables standardized cross-study comparisons and facilitates the evaluation of neuroprotective and disease-modifying therapies targeting inflammation-driven neurodegeneration in vivo.
Açıklamalar
The authors have nothing to disclose.
Teşekkürler
This work was supported, in part, by grants from the National Institutes of Health (F31NS132520) and the Karen Toffler Charitable Trust (90105789) to J.W.M.; R01NS041435 to P.A.C.; National MS Society (TA-2104-37423), Race to Erase MS Foundation Young Investigator Award (147096), and Wieden Family Public Foundation (151499) to M.G. The illustration in Figure 1C was created with BioRender.com (License #VH29J0GHXN).
Malzemeler
| Ad | Şirket | Katalog numarası | Yorumlar |
|---|---|---|---|
| 30% sucrose | Millipore | 8550 | Dissolve 300 g sucrose in ~800 mL PBS with gentle string; bring to 1 L. Store at 4 °C. |
| 4% Paraformaldehyde (PFA) | Sigma | P6148 | Heat ~800 mL PBS to 70 °C with stirring; add 40 g PFA; Filter and cool to RT; add PBS to bring up to 1 L. Prepare fresh and store at 4 °C. |
| Anti Phospho-c-Jun antibody | Cell Signaling Technology | 3270S | Retina staining, dilution: 1:1000 |
| Anti-Brn3a antibody | Synaptic Systems | 411 004 | Retina staining, dilution: 1:1000 |
| Anti-GFAP antibody | Thermofisher Scientific | PA1-10004 | Retina staining, dilution: 1:1000 |
| Anti-RBPMS antibody | GeneTex | GTX57225 | Retina staining, dilution: 1:400 |
| Anti-Tubulin β 3 (TUBB3) Antibody (TUJ1) | Biolegend | 801201 | Retina staining, dilution: 1:1000 |
| Brush, Red Sable, Size #2/0 | Electron Microscopy Sciences | 66100-20 | |
| Dumont SS Forceps | Fine Science Tools | Cat#11203-25 | |
| Fisherbrand Petri Dishes with Clear Lid | Fisher scientific | FB0875712 | |
| Permeabilization + blocking solution | Triton X-100 (Sigma# T8787); Normal Goat Serum (Jackson ImmunoResearch, 005-000-121) | Permeabilization solution: PBS containing 3% v/v Triton X-100 Blocking solution: Permeabilization solution + 5% NGS. | |
| Phosphate-Buffered Saline (PBS) 10× | Corning | 46-013-CM | Dilute 100 mL of 10× PBS with 900 mL of deionized water. Store at RT. |
| Sodium citrate antigen retrieval buffer (10mM, pH 6) | Sodium citrate dihydrate (Thomas Scientific#0147J04) | In distilled water, add 10 mM sodium citrate dihydrate; adjust pH to 6.0. Store at RT. | |
| Vannas Spring Scissors - 8mm cutting edge | Fine Science Tools | Cat#15009-08 | |
| Vwr Micro Cover Glasses, Round Diameter = 18 mm | VWR | 48382-042 |
Kaynaklar
- Lassmann H. Multiple sclerosis pathology. Cold Spring Harb Perspect Med. 2018;8(3):a028936.
- Trapp BD, Nave KA. Multiple sclerosis: an immune or neurodegenerative disorder? Annu Rev Neurosci. 2008;31:247-269.
- Oh J. Diagnosis of multiple sclerosis. Continuum (Minneap Minn). 2022;28(4):1006-1024.
- Reich DS, Lucchinetti CF, Calabresi PA. Multiple sclerosis. N Engl J Med. 2018;378(2):169-180.
- de Seze J. Inflammatory optic neuritis: from multiple sclerosis to neuromyelitis optica. Neuroophthalmology. 2013;37(4):141-145.
- Bennett JL. Optic neuritis. Continuum (Minneap Minn). 2019;25(5):1236-1264.
- Saidha S et al. Primary retinal pathology in multiple sclerosis as detected by optical coherence tomography. Brain. 2011;134(2):518-533.
- Galetta KM, Calabresi PA, Frohman EM, Balcer LJ. Optical coherence tomography (OCT): imaging the visual pathway as a model for neurodegeneration. Neurotherapeutics. 2011;8(1):117-132.
- Jin J et al. Glial pathology and retinal neurotoxicity in the anterior visual pathway in experimental autoimmune encephalomyelitis. Acta Neuropathol Commun. 2019;7(1):125.
- Gharagozloo M et al. Complement component 3 from astrocytes mediates retinal ganglion cell loss during neuroinflammation. Acta Neuropathol. 2021;142(5):899-915.
- Trapp BD et al. Axonal transection in the lesions of multiple sclerosis. N Engl J Med. 1998;338(5):278-285.
- Green AJ, McQuaid S, Hauser SL, Allen IV, Lyness R. Ocular pathology in multiple sclerosis: retinal atrophy and inflammation irrespective of disease duration. Brain. 2010;133(6):1591-1601.
- Mix E, Meyer-Rienecker H, Hartung HP, Zettl UK. Animal models of multiple sclerosis--potentials and limitations. Prog Neurobiol. 2010;92(3):386-404.
- Filippi M et al. Multiple sclerosis. Nat Rev Dis Primers. 2018;4(1):43.
- Henderson AP et al. A serial study of retinal changes following optic neuritis with sample size estimates for acute neuroprotection trials. Brain. 2010;133(9):2592-2602.
- Gordon-Lipkin E et al. Retinal nerve fiber layer is associated with brain atrophy in multiple sclerosis. Neurology. 2007;69(16):1603-1609.
- Petracca M et al. Retinal degeneration in primary-progressive multiple sclerosis: a role for cortical lesions? Mult Scler. 2017;23:43-50.
- Costello F, Burton JM. Retinal imaging with optical coherence tomography: a biomarker in multiple sclerosis? Eye Brain. 2018;10:47-63.
- Nadal-Nicolás FM et al. Brn3a as a marker of retinal ganglion cells: qualitative and quantitative time course studies in naive and optic nerve-injured retinas. Invest Ophthalmol Vis Sci. 2009;50(8):3860-3868.
- Buckingham BP et al. Progressive ganglion cell degeneration precedes neuronal loss in a mouse model of glaucoma. J Neurosci. 2008;28(11):2735-2744.
- West MJ, Gundersen HJG. Unbiased stereological estimation of the number of neurons in the human hippocampus. J Comp Neurol. 1990;296(1):1-22.
- Gundersen HJG, Jensen EB, Kiêu K, Nielsen J. The efficiency of systematic sampling in stereology--reconsidered. J Microsc. 1999;193(Pt 3):199-211.
- Schmitz C, Hof PR. Design-based stereology in neuroscience. Neuroscience. 2005;130(4):813-831.
- Ertürk A et al. Three-dimensional imaging of solvent-cleared organs using 3DISCO. Nat Protoc. 2012;7(11):1983-1995.
- Renier N et al. iDISCO: a simple, rapid method to immunolabel large tissue samples for volume imaging. Cell. 2014;159(4):896-910.
- Schindelin J et al. Fiji: an open-source platform for biological-image analysis. Nat Methods. 2012;9(7):676-682.
- Longair MH, Baker DA, Armstrong JD. Simple Neurite Tracer: open source software for reconstruction, visualization and analysis of neuronal processes. Bioinformatics. 2011;27(17):2453-2454.
- Meijering E. Neuron tracing in perspective. Cytometry A. 2010;77(7):693-704.
- Rodriguez AR, de Sevilla Müller LP, Brecha NC. The RNA binding protein RBPMS is a selective marker of ganglion cells in the mammalian retina. J Comp Neurol. 2014;522(6):1411-1443.
- Nadal-Nicolás FM et al. Whole number, distribution and co-expression of brn3 transcription factors in retinal ganglion cells of adult albino and pigmented rats. PLoS One. 2012;7(11):e49830.
- Rust R, Grönnert L, Dogançay B, Schwab ME. A revised view on growth and remodeling in the retinal vasculature. Sci Rep. 2019;9(1):3263.
- Mace JW et al. Autoimmune neuroinflammation leads to neuronal death via MIF nuclease-mediated parthanatos. Nat Neurosci. 2026;29(4):796-809.
- Liu C et al. Temporal progression of axonal degeneration in the visual system in experimental autoimmune encephalomyelitis: insights from high-resolution neuropathology. J Neuropathol Exp Neurol. 2025;84(11):1036-1052.
- Gill AJ et al. NLRX1 limits inflammatory neurodegeneration in the anterior visual pathway. J Neuroinflammation. 2025;22(1):21.
- Jin J et al. Retinal pathology in spontaneous opticospinal experimental autoimmune encephalitis mice. J Neuroimmunol. 2022;367:577859.
- Rosenkranz SC et al. The exercise hormone irisin has neuroprotective effects in a mouse model of multiple sclerosis. Nat Metab. 2026;8:1051–1066.
- Gharagozloo M et al. Therapeutic potential of a novel glucagon-like peptide-1 receptor agonist, NLY01, in experimental autoimmune encephalomyelitis. Neurotherapeutics. 2021;18(3):1834-1848.
- Meng M et al. Comparison of Brn3a and RBPMS labeling to assess retinal ganglion cell loss during aging and in a model of optic neuropathy. Invest Ophthalmol Vis Sci. 2024;65(4):19.
- Hecht RM, Shi Q, Garrett TR, Sivyer B, Morgans C. Split retina as an improved flatmount preparation for studying inner nuclear layer neurons in vertebrate retina. J Vis Exp. 2024;(203):65757.
- Berger A et al. Spectral-domain optical coherence tomography of the rodent eye: highlighting layers of the outer retina using signal averaging and comparison with histology. PLoS One. 2014;9(5):e96494.
- Masin L et al. A novel retinal ganglion cell quantification tool based on deep learning. Sci Rep. 2021;11(1):702.
- Liu X, Tan H, Wang W, Chen Z. Deep learning based retinal vessel segmentation and hypertensive retinopathy quantification using heterogeneous features cross-attention neural network. Front Med. 2024;11:1377479.
- Wu GF, Parker Harp CR, Shindler KS. Optic neuritis: a model for the immuno-pathogenesis of central nervous system inflammatory demyelinating diseases. Curr Immunol Rev. 2015;11(2):85-92.
- Sekyi MT et al. Demyelination and neurodegeneration early in experimental autoimmune encephalomyelitis contribute to functional deficits in the anterior visual pathway. Sci Rep. 2024;14(1):24048.
- Garton T et al. Myeloid lineage C3 induces reactive gliosis and neuronal stress during CNS inflammation. Nat Commun. 2025;16(1):3481.
- Osborne NN et al. Retinal ischemia: mechanisms of damage and potential therapeutic strategies. Prog Retin Eye Res. 2004;23(1):91-147.
- Calabresi PA, Balcer LJ, Frohman EM. Retinal pathology in multiple sclerosis: insight into the mechanisms of neuronal pathology. Brain. 2010;133(Pt 6):1575-1577.
Yeniden basım ve izinler
Bu makale yayımlandı
Video yakında