In two large intensive care unit (ICU) databases, international normalized ratio (INR) was inversely associated with stroke status, whereas hematocrit was positively associated. Secondary analyses among patients with stroke used six prognostic variables to develop machine-learning models for ICU mortality, with internal and external validation.
Araştırma makalesi
Associations of International Normalized Ratio and Hematocrit With Stroke Status and Machine Learning Mortality Prediction in Critical Care Databases
Bu makalede
Özet
Özet
Stroke is a major cause of mortality and long-term disability. This retrospective cohort study evaluated associations of international normalized ratio (INR) and hematocrit (Hct) with stroke status in 29,831 adult intensive care unit (ICU) patients from the Medical Information Mart for Intensive Care IV (MIMIC-IV) and eICU Collaborative Research Database (eICU-CRD). Stroke status was identified using predefined International Classification of Diseases, Ninth and Tenth Revision codes. INR and Hct were defined using the first measurements within 24 h after ICU admission. Associations were evaluated using multivariable logistic regression, quartile analyses, restricted cubic splines (RCS), subgroup analyses, and sensitivity analyses. Primary analyses used complete-case cohorts, with multiple imputation as a sensitivity analysis. A post hoc exploratory secondary analysis among patients with stroke used Cox regression to identify six prognostic variables for machine learning-based prediction of ICU mortality. Stroke proportions decreased across increasing INR quartiles and increased across increasing Hct quartiles. After full adjustment, each 1-unit increase in INR was associated with lower stroke odds, with odds ratios (ORs) of 0.105–0.395 across cohorts, whereas each 1-percentage-point increase in Hct was associated with higher stroke odds (ORs, 1.076–1.103). RCS analyses supported overall associations but not consistent nonlinearity after full adjustment. Multiple-imputation results were directionally consistent. The gradient boosting machine (GBM) model yielded areas under the receiver operating characteristic curve (AUCs) of 0.717 (95% confidence interval [CI], 0.669–0.766), 0.670 (95% CI, 0.603–0.737), and 0.630 (95% CI, 0.557–0.703) in the training, internal validation, and external validation cohorts, respectively. INR was inversely associated and Hct positively associated with stroke status. These observational associations require cautious interpretation; the exploratory ICU mortality analysis provides a complementary prognostic perspective among patients with stroke.
Giriş
Stroke is a severe neurological disease and remains a major source of death and persistent functional impairment among adults worldwide1. Global estimates indicate that nearly 15 million new cases occur annually; more than 6 million individuals die, and approximately 5 million survivors experience permanent disability, creating considerable pressure on families and healthcare systems1. Pathologically, stroke is commonly divided into ischemic and hemorrhagic subtypes. Ischemic stroke accounts for about 87% of all cases and is mainly caused by cerebral vessel obstruction, which leads to brain ischemia and hypoxia2,3. Hemorrhagic stroke results from rupture of a cerebral vessel and subsequent blood leakage into the brain parenchyma or related intracranial spaces4. As population aging accelerates and unhealthy lifestyles become more common, the incidence and burden of stroke continue to increase, especially in low- and middle-income countries5,6. Although the epidemiological importance of stroke is well recognized, large-scale clinical evidence remains limited regarding how coagulation status and hemorheological parameters, particularly international normalized ratio (INR) and hematocrit (Hct), relate to stroke status and clinical prognosis.
Stroke development involves multiple interacting pathophysiological processes, among which coagulation balance and blood rheology are particularly important7,8. Normal circulation depends on equilibrium between coagulation and anticoagulation; when this balance is disrupted, either thrombosis or bleeding may occur. INR is derived from prothrombin time and is routinely used to standardize the assessment of coagulation, particularly in patients receiving vitamin K antagonist therapy9,10. Hct can affect brain injury through several mechanisms. Higher Hct increases blood viscosity and may impair cerebral microcirculation, especially in narrowed cerebral vessels11. In contrast, lower Hct may reduce oxygen-carrying capacity and worsen oxygen delivery to ischemic tissue. Previous clinical studies have evaluated INR and Hct in relation to cerebrovascular disease, but most have focused on selected stroke populations or prognostic settings. In patients with ischemic stroke, anticoagulation intensity and admission INR have been associated with stroke severity, short-term mortality, and acute infarct volume12,13. For Hct, a large prospective population-based cohort reported an association between higher baseline Hct and increased stroke incidence, whereas a recent cohort of patients with acute ischemic stroke or transient ischemic attack found that both lower and higher Hct levels were associated with adverse clinical outcomes13,14.
These discrepancies may reflect differences in study populations, limited sample sizes, and incomplete adjustment for confounders. Importantly, most of the earlier research focused on general inpatients. ICU patients with severe stroke usually have greater disease severity, more frequent anemia or coagulation disorders, and more common abnormalities in INR and Hct. However, previous studies have generally examined INR or Hct separately, often in patients with established stroke, specific stroke etiologies, or prognostic settings, and evidence from large independent ICU populations remains limited15,16,17,18. In particular, it remains unclear whether the associations of both markers with stroke status are reproducible across different ICU databases, whether they differ between ischemic and hemorrhagic stroke, and whether the INR association persists after accounting for measured anticoagulant exposure and liver dysfunction.
To address this gap, we performed a retrospective cohort analysis using two large public ICU databases, MIMIC-IV and eICU-CRD. MIMIC-IV contains detailed clinical records from patients admitted to the intensive care units of Beth Israel Deaconess Medical Center, whereas eICU-CRD provides multicenter ICU data from hospitals across the United States. The primary objective was to evaluate the associations of INR and Hct with stroke status among eligible critically ill patients and to assess the consistency of these associations across independent cohorts and sensitivity analyses. In addition, we conducted a post hoc exploratory secondary analysis to identify clinical variables associated with ICU mortality in patients with confirmed stroke and explore their application in machine learning-based mortality prediction. By integrating two large ICU databases with internal and external validation, stroke-subtype analyses, and sensitivity analyses addressing measured anticoagulant exposure and liver function, the present study extends previous evidence by providing an ICU-specific, cross-database assessment of INR and Hct within a unified analytical framework. The secondary mortality analysis was intended to complement the primary association analysis by extending the investigation from stroke status to short-term prognosis among patients with established stroke, rather than to validate the associations of INR and Hct with stroke status.
Protokol
Ethical statement
This study used de-identified data from the MIMIC-IV and eICU Collaborative Research Database (eICU-CRD), both of which are publicly available databases distributed through PhysioNet under data use agreements. The original collection and creation of the MIMIC-IV research resource were reviewed and approved by the Institutional Review Boards of the Massachusetts Institute of Technology and Beth Israel Deaconess Medical Center, which granted a waiver of informed consent and approved the sharing of the research resource for research purposes. The eICU-CRD contains fully de-identified data collected during routine clinical care, and its use for research is exempt from institutional review board approval owing to its retrospective design, lack of direct patient intervention, and a security schema certified as meeting safe harbor standards by an independent privacy expert. Access to both databases was granted after completion of the required human-subjects training and approval of the corresponding PhysioNet data use agreements. Because this study involved only secondary analysis of fully de-identified, publicly available data, no additional institutional review board approval or informed consent was required. Written informed consent was therefore waived for this study.
Database access and cohort construction
This study used data from the MIMIC-IV (v3.1)19 and eICU Collaborative Research Database (eICU-CRD) (v2.0)20. MIMIC-IV contained detailed clinical information from patients admitted to the intensive care units (ICUs) of Beth Israel Deaconess Medical Center in Boston, USA, and data from the first quarter of 2008 to the fourth quarter of 2019 were used in this study. eICU-CRD was a multicenter ICU database containing data from 208 hospitals across the United States, and data from the first quarter of 2014 to the fourth quarter of 2015 were used. We identified eligible adult ICU admissions from both databases. Patients aged <18 years were excluded; for patients with multiple ICU admissions, only the first ICU stay was retained; patients with missing ICU length of stay or an ICU stay shorter than 24 h were excluded; and patients with missing key study variables required for the primary complete-case analysis were also excluded. After these criteria were applied, MIMIC-IV retained 8,982 patients, eICU-CRD retained 20,849 patients, and the total study cohort comprised 29,831 eligible ICU patients. The details of the software packages used for database extraction, data preprocessing, statistical analyses, and machine learning model development are provided in the Table of Materials to facilitate reproducibility.
Stroke identification and cohort allocation
Stroke cases were identified using predefined diagnostic codes from the Ninth and Tenth Revisions of the International Classification of Diseases (ICD-9 and ICD-10)21,22. Hemorrhagic stroke was defined using ICD-9 codes 430-432 and ICD-10 codes I60-I62, and ischemic stroke was defined using ICD-9 codes 433-434 and ICD-10 codes I63, I65, and I66 (Table 1). Patients meeting at least one of the predefined ischemic or hemorrhagic stroke codes were classified into the stroke group, and all remaining eligible ICU patients without these predefined stroke codes were classified into the non-stroke group. In the association analyses of INR and Hct, stroke status was treated as the primary binary outcome, with non-stroke coded as 0 and stroke coded as 1. It should be noted that stroke status was identified from diagnostic codes recorded during hospitalization; therefore, the exact timing of stroke onset relative to the laboratory measurements could not be determined for all patients. The 8,982 patients from MIMIC-IV were randomly divided at a 7:3 ratio into a training cohort (n = 6,289) and an internal validation cohort (n = 2,693), and the 20,849 patients from eICU-CRD were used as an independent external validation cohort. The patient-selection process is shown in Figure 1.
Variable extraction and preprocessing
We extracted baseline demographic characteristics (age, sex, race, height, weight, and body mass index (BMI)), vital signs at ICU admission (heart rate, systolic blood pressure, diastolic blood pressure, mean arterial pressure, temperature, respiratory rate, and oxygen saturation), and laboratory measurements (hematocrit, INR, white blood cell count, glucose, creatinine, blood urea nitrogen, sodium, potassium, chloride, calcium, bicarbonate, and anion gap). For INR and Hct, the first available measurement recorded within 24 h after ICU admission was used, rather than the most abnormal value or a mean, median, or other summary measure within this period. Comorbidities and disease-severity variables were also extracted, including diabetes mellitus, congestive heart failure, chronic pulmonary disease, renal disease, severe liver disease, metastatic solid tumor, Acute Physiology Score III (APS III)23, and Sequential Organ Failure Assessment (SOFA) score24. For the additional sensitivity analysis addressing potential confounding by anticoagulant exposure and liver function, measured anticoagulant use was identified from available medication records; the anticoagulants considered were warfarin, heparin, enoxaparin, dalteparin, rivaroxaban, apixaban, edoxaban, and dabigatran. The first available aspartate aminotransferase (AST), alanine aminotransferase (ALT), total bilirubin, and albumin measurements within 48 h after admission were also extracted. The primary analyses used complete-case cohorts, and patients with missing key study variables were excluded during cohort construction so that the final cohorts contained complete data for the variables required in the primary association analyses. We quantified variable-specific missingness before complete-case exclusion and reported the corresponding missing-data proportions in Supplementary Table 1. As an additional missing-data sensitivity analysis, multiple imputation by chained equations was performed in the broader MIMIC-IV cohort before complete-case exclusion (n = 35,242). Ten imputed datasets (m = 10) were generated using a maximum of 10 iterations and a fixed random seed of 12345; predictive mean matching was applied to continuous variables, and logistic regression imputation was used for binary categorical variables. The fully adjusted logistic regression model was then fitted separately in each of the 10 imputed datasets, and regression coefficients and standard errors were combined according to Rubin's rules to obtain pooled odds ratios (ORs), 95% confidence intervals (CIs), and p values. This multiple-imputation analysis served only as a sensitivity analysis and did not replace the primary complete-case analysis.
Primary association analyses
In the primary association analyses, baseline characteristics were summarized according to variable type: categorical variables were presented as frequencies and percentages and compared between groups using the chi-square test or Fisher's exact test as appropriate; normally distributed continuous variables were presented as mean ± standard deviation and compared using the t-test or analysis of variance; and skewed continuous variables were presented as median (interquartile range) and compared using the Mann-Whitney U test or Kruskal-Wallis test. For the quartile-based descriptive analysis, INR and Hct were each categorized into four groups (Q1-Q4) according to their distributions within each study cohort, and the proportion of patients with stroke was compared across quartiles; this analysis was regarded as a descriptive quartile-based analysis distinct from the continuous-variable logistic regression analysis. We fitted ordinary multivariable logistic regression models with stroke status as the binary outcome, without applying sampling weights, inverse probability weights, or other weighting procedures. Model 1 used INR or Hct as the only exposure variable to estimate the crude association with stroke status; Model 2 additionally adjusted for age, sex, and race; and Model 3 further adjusted for weight, height, BMI, heart rate, systolic blood pressure, diastolic blood pressure, mean arterial pressure, respiratory rate, temperature, oxygen saturation, APS III score, SOFA score, congestive heart failure, chronic pulmonary disease, diabetes, renal disease, severe liver disease, metastatic solid tumor, white blood cell count, creatinine, glucose, chloride, bicarbonate, sodium, potassium, and anion gap. Adjustment covariates were selected a priori based on the study aims, relevant literature, clinical relevance, potential confounding roles, and availability across the study databases, rather than according to statistical significance in the current dataset. Female was used as the reference category for sex, White as the reference category for race, and absence of the corresponding condition (No/0) as the reference category for each comorbidity; continuous covariates were entered in their original continuous form. In the logistic regression analyses, INR and Hct were modeled as continuous variables; the OR for INR represented the change in stroke odds associated with each 1-unit increase in INR, and the OR for Hct represented the change in stroke odds associated with each 1-percentage-point increase in Hct. We also performed restricted cubic spline (RCS) analyses to evaluate potential nonlinear associations of INR and Hct with stroke status, placing four knots at the 5th, 35th, 65th, and 95th percentiles of the respective exposure distributions and using the median exposure value as the reference (OR = 1); RCS analyses were performed separately in the MIMIC-IV training cohort, MIMIC-IV internal validation cohort, and eICU-CRD external validation cohort using the same three adjustment structures as the logistic regression analyses, and both the overall association (p-overall) and the nonlinear component (p-nonlinear) were evaluated. In addition, for the fully adjusted primary multivariable logistic regression model (Model 3), multicollinearity among covariates was assessed separately in the MIMIC-IV training set, MIMIC-IV internal validation set, and eICU-CRD external validation set: with INR or Hct as the exposure variable, covariates included age, sex, race, weight, height, BMI, vital signs, APS III, SOFA, comorbidities, and laboratory indicators; variance inflation factors (VIFs) were calculated for continuous and binary variables, and generalized variance inflation factors (GVIFs) and their adjusted values, GVIF^(1/(2×Df)), were calculated for multilevel categorical variables, with VIF or adjusted GVIF > 5 used as the threshold suggesting potential multicollinearity; simultaneously, rank tests were performed on the model design matrices to determine whether perfect linear dependence existed.
Subgroup and sensitivity analyses
In subgroup and sensitivity analyses, we performed subgroup analyses to examine the associations of INR and Hct with stroke status and to assess consistency across demographic strata, including age and sex, and we summarized subgroup-specific estimates using ORs and 95% CIs. We performed an extreme-value sensitivity analysis by excluding observations in the upper and lower 2.5% of the respective INR and Hct distributions and repeated the same three logistic regression models used in the primary analysis. After excluding extreme values, we conducted ischemic and hemorrhagic stroke subtype-specific sensitivity analyses in the MIMIC-IV training and internal validation cohorts, applying the same three sequential logistic regression models used in the primary analysis to each stroke subtype separately. To evaluate whether measured anticoagulant exposure and liver function indicators substantially affected the observed associations, we performed additional sensitivity analyses in the MIMIC-IV training and internal validation cohorts, adding measured anticoagulant use, AST, ALT, total bilirubin, and albumin to the fully adjusted Model 3 and comparing the resulting estimates with those from the original Model 3. We used the previously described multiple imputation analysis as an additional sensitivity analysis for the impact of complete-case exclusion. In addition, we conducted an extended sensitivity analysis to evaluate the impact of residual confounding on the associations of INR and Hct with stroke status: we added reliably extractable additional variables to the original fully adjusted Model 3, including atrial fibrillation, anemia, venous thromboembolism, other coagulation abnormalities, anticoagulant medication use, liver function indicators (AST, ALT, total bilirubin, and albumin), coagulation indicators (prothrombin time (PT), activated partial thromboplastin time (aPTT), fibrinogen, and platelet count), and net fluid balance within 24 h after ICU admission; these variables were extracted from structured diagnosis, medication, laboratory, and fluid input/output data in MIMIC-IV and eICU-CRD, respectively, and were matched with the original analysis data. Anticoagulant medication use was identified based on medication records, excluding nonsystemic anticoagulant uses such as flushing, catheter locking, dialysis, or continuous renal replacement therapy (CRRT). Because the two databases recorded anticoagulant dose, duration, indication, and adherence inconsistently, and medication orders were not equivalent to actual medication use, this study did not construct cross-database variables for dose, duration, or adherence; anticoagulant indications were partially reflected by diagnoses such as atrial fibrillation and venous thromboembolism but could not be fully reconstructed. Therefore, this analysis adjusted for identifiable anticoagulant use status and related clinical factors rather than fully controlling for all dimensions of anticoagulant therapy. Statistically, the original unadjusted model, the age + sex + race-adjusted model, and the fully adjusted model remained unchanged, and a "fully adjusted + extended sensitivity variables" model was added, in which the above variables were added to Model 3; logistic regressions were fitted with INR and Hct as the exposures, respectively, and stroke status as a binary outcome. Because the extended model required complete data for the exposure, original covariates, and newly added variables, this analysis was a complete-case sensitivity analysis, and the sample size and number of events were reduced compared with the original models.
ICU mortality prognostic analysis
After completion of the primary stroke-status association analyses, we conducted a post hoc exploratory secondary analysis among patients with stroke in the MIMIC-IV training cohort. ICU admission was used as the time origin, and patients were followed until death during the ICU stay or ICU discharge/transfer. Death during the ICU stay was treated as the event (OS = 1), and patients who survived to ICU discharge or transfer were treated as censored observations (OS = 0) at their actual ICU length of stay. Univariate Cox proportional hazards regression was used to evaluate candidate prognostic variables; variables with p < 0.1 that also satisfied the proportional hazards (PH) assumption (p > 0.05) were considered for multivariable Cox regression, and variables with p < 0.1 in the multivariable Cox model that also satisfied the proportional hazards assumption were retained. Six variables-creatinine, SOFA score, respiratory rate, white blood cell count, Hct, and bicarbonate-were identified through this procedure and used as fixed prognostic predictors for subsequent machine learning model development. Pairwise correlations among the six retained predictors were assessed using Pearson correlation coefficients, and |r| ≥ 0.7 was considered to indicate strong correlation.
Machine learning model development and validation
In machine learning model development and validation, we used creatinine, SOFA score, respiratory rate, white blood cell count, Hct, and bicarbonate as fixed input features for all machine learning models and did not reselect features in any validation cohort. We defined the machine learning endpoint as binary ICU mortality over the entire ICU stay rather than mortality at fixed time points such as 28 or 90 days; patients who died during the ICU stay were coded as 1, and patients who survived to ICU discharge or transfer were coded as 0. Because the machine learning analysis was designed as a binary classification task and did not directly model survival time or censoring, we treated patients who were censored in the Cox analysis because they survived to ICU discharge or transfer as non-deaths (0) in the machine learning analysis. Using the same six predictors, we constructed six machine learning models: naive Bayes, k-nearest neighbors (KNN), support vector machine (SVM), logistic regression, gradient boosting machine (GBM), and random forest. All preprocessing procedures and model development parameters were determined solely from the MIMIC-IV training cohort. All machine learning models were trained in the MIMIC-IV training cohort using 10-fold cross-validation, with the area under the receiver operating characteristic curve (AUC) used as the metric for model evaluation and hyperparameter optimization; preprocessing parameters were estimated only from the MIMIC-IV training cohort and, after model training was completed, were fixed for use in the MIMIC-IV internal validation cohort and the eICU-CRD external validation cohort. The hyperparameter settings and optimization strategies for each algorithm were as follows: the naive Bayes model was set with laplace = 0, usekernel = FALSE, and adjust = 1; for the KNN model, candidate values of the number of neighbors, k = 5, 7, and 9, were compared, and the optimal k value was selected based on the AUC in 10-fold cross-validation; the radial basis kernel SVM was set with sigma = 0.1 and C = 1; no additional hyperparameters requiring optimization were set for logistic regression; the GBM model was set with n.trees = 100, interaction.depth = 3, shrinkage = 0.1, and n.minobsinnode = 10; for the random forest model, mtry was set to the rounded-down value of the square root of the number of predictors p, that is, floor(sqrt(p)); in this study, p = 6, so mtry = 2, and ntree was set to 300. Except for KNN, for which multiple candidate k values were compared, all other algorithms used prespecified parameter combinations, and no additional grid search was performed. The MIMIC-IV internal validation cohort and the eICU-CRD external validation cohort did not participate in feature selection, preprocessing parameter estimation, model fitting, or hyperparameter optimization and were used only for final independent performance evaluation.
Model evaluation
In model evaluation, we used receiver operating characteristic curves and the area under the curve to assess model discrimination and calculated 95% confidence intervals for the AUC; we used calibration curves and Brier scores to assess model calibration; we used decision curve analysis25 to assess clinical net benefit; we generated nomograms using the six retained prognostic predictors; we used Shapley additive explanations (SHAP) to interpret the best GBM model and summarized global feature importance and feature effects; and we evaluated final model performance in the MIMIC-IV training cohort, the MIMIC-IV internal validation cohort, and the eICU-CRD external validation cohort, respectively. Where applicable, we used a two-sided p < 0.05 as the threshold for statistical significance.
Sonuçlar
Baseline characteristics
The final cohort comprised 29,831 eligible ICU patients from MIMIC-IV and eICU-CRD. Based on the predefined ICD-9 and ICD-10 diagnostic codes, patients were classified into stroke and non-stroke groups. The MIMIC-IV training set included 588 patients with stroke and 5,701 without stroke; the MIMIC-IV internal validation set included 251 patients with stroke and 2,442 without stroke; and the eICU-CRD external validation set included 741 patients with stroke and 20,108 without stroke. Baseline characteristics for these cohorts are presented in Table 2, Table 3, and Table 4.
Several variables showed consistent statistically significant associations with stroke status. In particular, INR and Hct differed significantly between stroke and non-stroke groups in all datasets (p < 0.05). Race, age, systolic blood pressure, diastolic blood pressure, and multiple laboratory indicators were also associated with stroke status across the cohorts (p < 0.05).
Association of INR and Hct quartiles with stroke status
For the quartile-based analysis, INR and Hct were each categorized into four groups according to their distributions within each dataset, and the proportion of patients with stroke was compared across Q1-Q4. Quartile categories of both INR and Hct were strongly associated with stroke status in the MIMIC-IV training set, the MIMIC-IV validation set, and the eICU validation set (all p < 0.001). The proportion of stroke patients decreased stepwise across higher INR quartiles, indicating lower stroke frequency at higher INR values. In contrast, the stroke proportion increased across higher Hct quartiles. These quartile-based patterns describe changes in stroke proportion across increasing INR and Hct categories (Table 5) and are distinct from the continuous-variable OR estimates reported in Table 6. Detailed baseline profiles for all quartile groups, including demographics, laboratory indices, vital signs, comorbidities, and severity scores, are provided in the Supplementary Material (Supplementary Table 2, Supplementary Table 3, Supplementary Table 4, Supplementary Table 5, Supplementary Table 6, and Supplementary Table 7).
Independent associations of INR and Hct with stroke status
To further clarify the associations of INR and hematocrit (Hct) with stroke status, ordinary multivariable logistic regression models were constructed without the use of sampling weights, inverse probability weights, or other weighting procedures. Stroke status was treated as a binary outcome, with non-stroke coded as 0 and stroke as 1. Three sequential adjustment models were applied. Model 1 included only INR or Hct and was used to estimate the crude association with stroke status. Model 2 additionally adjusted for age, sex, and race to control for basic demographic confounding. Model 3 further adjusted for weight, height, BMI, heart rate, systolic blood pressure, diastolic blood pressure, mean arterial pressure, respiratory rate, temperature, oxygen saturation, APS III score, SOFA score, congestive heart failure, chronic pulmonary disease, diabetes, renal disease, severe liver disease, metastatic solid tumor, white blood cell count, creatinine, glucose, chloride, bicarbonate, sodium, potassium, and anion gap, thereby providing estimates after additional adjustment for physiological status, disease severity, comorbidities, and laboratory characteristics. Female was the reference category for sex, White was the reference category for race, and absence of the corresponding condition (No/0) was the reference category for each comorbidity. Continuous covariates were entered in their original continuous form. Both INR and Hct remained significantly associated with stroke status across the three cohorts (Table 6). INR showed a consistent inverse association with stroke status.
In these regression models, INR and Hct were entered as continuous variables. Accordingly, the OR for INR represents the change in stroke odds associated with each 1-unit increase in INR, whereas the OR for Hct represents the change in stroke odds associated with each 1-percentage-point increase in Hct. In the primary complete-case analysis, each 1-unit increase in INR was associated with lower stroke odds in the fully adjusted Model 3, with ORs of 0.395 (95% CI: 0.247-0.602, p = 4.50 × 10⁻⁵) in the MIMIC-IV training cohort, 0.273 (95% CI: 0.121-0.550, p = 8.04 × 10⁻⁴) in the MIMIC-IV internal validation cohort, and 0.105 (95% CI: 0.063-0.172, p = 3.54 × 10⁻¹⁸) in the eICU-CRD external validation cohort. Each 1-percentage-point increase in Hct was associated with higher stroke odds, with corresponding ORs of 1.099 (95% CI: 1.080-1.118, p = 1.08 × 10⁻²⁶), 1.103 (95% CI: 1.073-1.134, p = 6.28 × 10⁻¹²), and 1.076 (95% CI: 1.062-1.090, p = 1.05 × 10⁻²⁹), respectively (Table 6).
In the fully adjusted primary multivariable logistic regression models, the design matrices of all models were full rank, and no perfect linear dependence was found. In the MIMIC-IV training and internal validation sets, the higher VIFs were mainly concentrated in weight, height, and BMI: in the training set, the VIFs for weight, BMI, and height were 69.77, 58.06, and 14.90, respectively, in the INR model, and 69.76, 58.05, and 14.90, respectively, in the Hct model; in the internal validation set, they were 73.67, 60.28, and 14.17, respectively, in the INR model, and 73.60, 60.22, and 14.16, respectively, in the Hct model. This pattern was consistent with the structural relationship whereby BMI is calculated from weight and height. Apart from the above anthropometric variables, in the MIMIC dataset, the VIFs for chloride and sodium were approximately 3.63-4.00 and 3.30-3.72, respectively, and the VIFs for APS III and SOFA were both below 5; for the multilevel categorical variable race, the adjusted GVIF^(1/(2×Df)) was approximately 1.02. In eICU-CRD, the VIFs for all single-degree-of-freedom variables were below 5, with the highest being chloride (approximately 2.92), and the maximum adjusted GVIF was approximately 1.71 (chloride); for age as a multilevel categorical variable, the adjusted GVIF was also below 5. The VIFs for the main exposure variables INR and Hct were both low: in the MIMIC training set, the VIF was 1.18 for INR and 1.31 for Hct; in the MIMIC internal validation set, it was 1.23 for INR and 1.34 for Hct; and in eICU-CRD, it was 1.11 for INR and 1.33 for Hct. Overall, except for weight, height, and BMI in the MIMIC dataset, which had high VIFs due to structural relationships, no other obvious multicollinearity issues were found in the main models; these variables were prespecified covariates, and because the main exposure variables had low VIFs and the design matrices were full rank, they were retained in the models. In the mortality/machine learning analysis, the pairwise Pearson correlation analysis results for the six predictors complemented the multicollinearity assessment of the main regression models (Supplementary Table 8, Supplementary Table 9, Supplementary Table 10, Supplementary Table 11, Supplementary Table 12 and Supplementary Table 13).
Restricted cubic spline analyses
Restricted cubic spline analyses were performed using four knots placed at the 5th, 35th, 65th, and 95th percentiles of the respective exposure distributions, with the median value of each exposure used as the reference (OR = 1). For INR, the overall association with stroke status remained statistically significant across all three adjustment models in the three study cohorts. In the MIMIC-IV training cohort, the p-overall values for Models 1-3 were all < 0.001, whereas the p-nonlinear values for Models 1, 2, and 3 were < 0.001, < 0.001, and 0.286, respectively. In the MIMIC-IV internal validation cohort, the p-overall values were < 0.001, < 0.001, and 0.001, respectively, and the corresponding p-nonlinear values were 0.002, 0.046, and 0.214. In the eICU-CRD external validation cohort, the p-overall values for all three models were < 0.001, whereas the p-nonlinear values for Models 1, 2, and 3 were < 0.001, 0.003, and 0.107, respectively. Thus, although the overall association of INR with stroke status remained statistically significant, evidence for nonlinearity was attenuated with increasing covariate adjustment and was no longer statistically significant in the fully adjusted Model 3 in any of the three cohorts (Figure 2A-C).
For Hct, the overall association with stroke status was statistically significant across Models 1-3 in the MIMIC-IV training cohort, MIMIC-IV internal validation cohort, and eICU-CRD external validation cohort (all p-overall < 0.001). In the MIMIC-IV training cohort, the p-nonlinear values for Models 1-3 were < 0.001, < 0.001, < 0.001, respectively; in the MIMIC-IV internal validation cohort, they were < 0.001, 0.012, and 0.052, respectively; and in the eICU-CRD external validation cohort, they were < 0.001, < 0.001, and 0.005, respectively. These results suggested that the overall association between Hct and stroke status was stable across cohorts, and most models supported the presence of a nonlinear component; however, the evidence for nonlinearity was not entirely consistent across cohorts and adjustment models, especially in the MIMIC-IV internal validation cohort, where the p-nonlinear for the fully adjusted Model 3 was 0.052, which was close to but did not reach the 0.05 significance threshold, suggesting that the robustness of the nonlinear association after full adjustment was limited (Figure 2D-F).
Visual inspection of the spline curves suggested that the OR for stroke status generally decreased across the lower-to-moderate range of INR, with flattening or a slight upturn at higher INR values in some models and cohorts. In contrast, increasing Hct was consistently accompanied by increasing ORs across the three cohorts. These visual patterns should be interpreted together with the formal tests above, particularly because the nonlinear component for INR was not statistically significant after full adjustment and evidence for Hct nonlinearity was not entirely consistent across cohorts after full adjustment.
Subgroup analysis
Subgroup analyses were conducted to examine whether the associations of INR and Hct with stroke status were stable across population strata (Figure 3A-F). The direction of the associations was consistent in subgroups defined by age and sex. For both markers, most subgroup estimates reached statistical significance (p < 0.05) across the MIMIC-IV training, MIMIC-IV validation, and eICU validation sets. These findings indicate that the inverse association of INR and the positive association of Hct with stroke were broadly stable across different demographic and clinical profiles.
Sensitivity analysis
To evaluate robustness, extreme observations from the upper and lower 2.5% of the INR and Hct distributions were removed, and the multivariable logistic regression was repeated. The sensitivity results were consistent with the primary analysis (Table 7). INR continued to show a stable inverse association in all datasets and models, with ORs below 1. Conversely, Hct remained positively associated with stroke, with ORs above 1. These findings indicate that the main associations were not driven by distributional extremes.
Subtype-specific sensitivity analyses after exclusion of extreme values further indicated heterogeneity in the association between INR and stroke status. For ischemic stroke, the inverse association of INR was attenuated after full adjustment and was no longer statistically significant in either the MIMIC-IV training cohort (OR = 0.648, 95% CI: 0.315-1.224, p = 0.208) or the internal validation cohort (OR = 0.470, 95% CI: 0.143-1.308, p = 0.182). In contrast, the inverse association between INR and hemorrhagic stroke remained statistically significant after full adjustment in both the training cohort (OR = 0.136, 95% CI: 0.057-0.298, p = 2.13 × 10⁻⁶) and the internal validation cohort (OR = 0.071, 95% CI: 0.014-0.292, p = 6.06 × 10⁻4). Hct showed a more consistent positive association across stroke subtypes. For ischemic stroke, the fully adjusted ORs were 1.136 (95% CI: 1.102-1.172, p = 6.80 × 10⁻16) in the training cohort and 1.104 (95% CI: 1.055-1.158, p = 3.32 × 10⁻5) in the internal validation cohort. For hemorrhagic stroke, the corresponding ORs were 1.119 (95% CI: 1.091-1.149, p = 5.35 × 10⁻¹⁸) and 1.136 (95% CI: 1.090-1.187, p = 3.86 × 10⁻⁹), respectively. These findings suggest that the association of INR with stroke status differed by stroke subtype, whereas the positive association of Hct was comparatively consistent (Supplementary Figure 1A-D).
Additional adjustment for anticoagulant use and liver-function variables produced effect estimates that were similar to those from the original fully adjusted model. In the MIMIC-IV training cohort, the OR for INR was 0.383 (95% CI: 0.235-0.590) in the original fully adjusted model and 0.380 (95% CI: 0.234-0.586) after additional adjustment for anticoagulant use, AST, ALT, total bilirubin, and albumin. In the internal validation cohort, the corresponding ORs were 0.290 and 0.292, respectively. Similar stability was observed for Hct: in the training cohort, the OR changed from 1.097 to 1.100 (95% CI: 1.081-1.120), whereas in the internal validation cohort it changed from 1.099 to 1.103 (95% CI: 1.072-1.135). Thus, additional adjustment for anticoagulant use and liver-function indicators did not materially alter the direction or magnitude of the associations of INR and Hct with stroke status (Supplementary Figure 2A,B).
To further evaluate whether the complete-case approach materially influenced the primary findings, an additional multiple-imputation sensitivity analysis was performed in the broader MIMIC-IV cohort before exclusion for missing key variables (n = 35,242). After 10 multiply imputed datasets were generated and the fully adjusted logistic regression estimates were pooled according to Rubin's rules, INR remained inversely associated with stroke status (OR = 0.390, 95% CI: 0.319-0.476, p = 4.081 × 10⁻¹⁹), whereas Hct remained positively associated with stroke status (OR = 1.122, 95% CI: 1.114-1.131, p = 2.074 × 10⁻192). These estimates were directionally consistent with those from the primary complete-case analysis, supporting the robustness of the observed associations to the handling of missing data.
When only anticoagulant use and liver function indicators were additionally adjusted for, the effect estimates for INR and Hct were similar to those from the original fully adjusted model. After further inclusion of atrial fibrillation, anemia, venous thromboembolism, other coagulation abnormalities, anticoagulant use, coagulation-related laboratory indicators, and volume status, the results of the extended sensitivity analysis showed that in MIMIC-IV, the full sensitivity model included 1,971 patients, of whom 36 developed stroke; the OR of INR with stroke status was 0.2395 (95% CI: 0.0270-2.1275, p = 0.1996), and the OR of Hct with stroke status was 1.0433 (95% CI: 0.9798-1.1108, p = 0.1858). Compared with the original fully adjusted model, the directions of the effects of INR and Hct did not change, but neither reached statistical significance in this extended model; the effective sample size and number of events in this model were markedly reduced compared with the original model, and multiple covariates were added, so the power for estimation decreased accordingly.
In eICU-CRD, the extended sensitivity model included 1,121 patients, of whom 44 had stroke. After the above variables were added, the model showed complete or near-complete separation: the INR model had OR = 0 (95% CI: 0-0, p < 1 × 10⁻300), and the Hct model had OR = Inf (95% CI: Inf-Inf, p < 1 × 10-300). This result indicated that the data structure of the extended model had complete or near-complete separation, and the above boundary estimates could not be interpreted as stable or reliable effect sizes. The corresponding results are shown in Supplementary Figure 3A-C.
Overall, the above extended sensitivity analysis was limited by factors such as complete-case analysis, reduced effective sample size and number of events, and model separation, and could not provide stable effect estimates; however, within the range of data that could be adjusted, the directions of the effects of INR and Hct on stroke status remained consistent with the primary analysis, suggesting that the directions of associations observed in the primary analysis were not entirely influenced by these additionally included confounders. In addition, the primary association analysis should still be treated as the main result and cautiously interpreted as an observational association, whereas the extended sensitivity analysis provided supplementary information for understanding its robustness and sources of residual confounding.
Identification of independent predictors for ICU mortality
Cox proportional hazards modeling was performed in patients with stroke from the MIMIC-IV training cohort to identify factors associated with ICU mortality. Univariate analysis identified ten significant variables (p < 0.1), all of which met the PH assumption (p > 0.05) (Figure 4A,B). Multivariable Cox regression further identified six independent mortality predictors (p < 0.1), and all also satisfied the PH assumption (p > 0.05). Six variables were retained in the multivariable Cox analysis. Higher creatinine, SOFA score, respiratory rate, and white blood cell count were associated with higher ICU mortality, whereas higher Hct and bicarbonate were associated with lower ICU mortality (Figure 4C,D). Pearson correlation analysis showed no strong pairwise correlations among the six retained predictors (all |r| < 0.7) (Figure 4E). In the Cox analysis, follow-up extended from ICU admission to ICU death or ICU discharge/transfer, with patients surviving to ICU discharge or transfer treated as censored observations. These six predictors were subsequently fixed as the input features for machine learning model development and were not reselected in either validation cohort.
Machine learning model development and evaluation
Using the six predictors identified in the MIMIC-IV training cohort, six machine learning models were trained and tuned exclusively within the training cohort using 10-fold cross-validation. The MIMIC-IV internal validation and eICU-CRD external validation cohorts were used only for independent performance evaluation after model development was completed. The prediction endpoint was death during the ICU stay; no fixed 28-day or 90-day prediction horizon was used. Patients who died during the ICU stay were classified as death cases, whereas those who survived to ICU discharge or transfer were classified as non-death cases.
The gradient boosting machine (GBM) model showed the best overall performance among the six candidate models (Figure 5A-C). For ICU mortality discrimination, the AUC was 0.717 (95% CI: 0.669-0.766) in the MIMIC-IV training cohort, 0.670 (95% CI: 0.603-0.737) in the MIMIC-IV internal validation cohort, and 0.630 (95% CI: 0.557-0.703) in the eICU-CRD external validation cohort (Figure 6D). These AUC values reflect model discrimination, that is, the ability to distinguish patients who died during the ICU stay from those who survived to ICU discharge or transfer, rather than model calibration.
SHAP analysis of the optimal GBM model identified SOFA score as the most influential predictor (Figure 5D). A nomogram was developed using the six predictors (Figure 6A). Model calibration was evaluated separately using calibration curves and Brier scores (Figure 6B). The Brier scores were 0.2067 in the training cohort, 0.2286 in the internal validation cohort, and 0.3244 in the external validation cohort, indicating greater calibration deviation in the external validation cohort. Decision curve analysis was used to assess clinical net benefit (Figure 6C).
DATA AVAILABILITY:
The data analyzed in this study are publicly available to credentialed researchers through PhysioNet: MIMIC-IV (https://physionet.org/content/mimiciv/) and the eICU Collaborative Research Database (https://physionet.org/content/eicu-crd/), subject to the corresponding credentialing and data-use requirements.
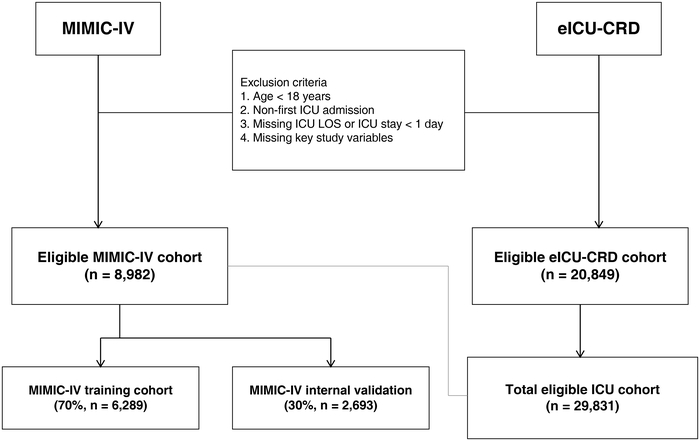
Figure 1: Flow diagram of study cohort selection. Eligible adult intensive care unit (ICU) patients were identified from the Medical Information Mart for Intensive Care IV (MIMIC-IV) and eICU Collaborative Research Database (eICU-CRD). Stroke status was determined using predefined International Classification of Diseases, Ninth Revision (ICD-9) and Tenth Revision (ICD-10) diagnostic codes. After application of the eligibility criteria, 8,982 patients from MIMIC-IV and 20,849 patients from eICU-CRD were included, yielding a total study population of 29,831 patients. The MIMIC-IV cohort was randomly divided into a training cohort (n = 6,289) and an internal validation cohort (n = 2,693) at a 7:3 ratio, and the eICU-CRD cohort (n = 20,849) was used for external validation. Please click here to view a larger version of this figure.
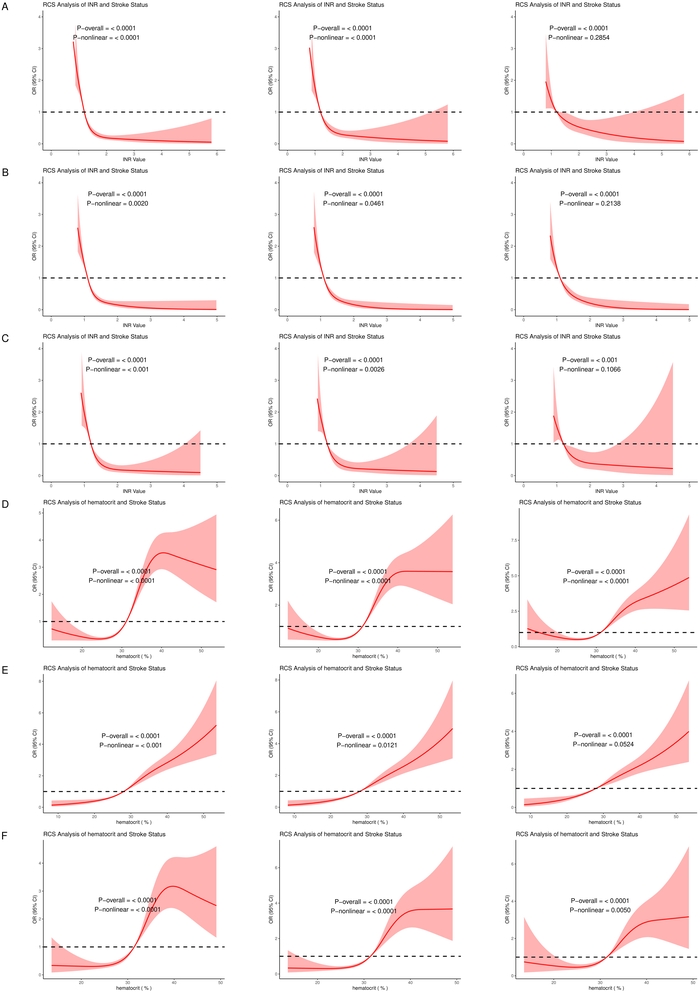
Figure 2: Restricted cubic spline analyses of INR and Hct in relation to stroke status. Panels A-C show restricted cubic spline (RCS) analyses for international normalized ratio (INR) in the MIMIC-IV training cohort, MIMIC-IV internal validation cohort, and eICU-CRD external validation cohort, respectively; panels D-F show the corresponding analyses for hematocrit (Hct). Four knots were placed at the 5th, 35th, 65th, and 95th percentiles of the respective exposure distributions, and the median exposure value was used as the reference (odds ratio [OR] = 1). Model 1 included INR or Hct only; Model 2 additionally adjusted for age, sex, and race; and Model 3 further adjusted for the prespecified physiological, disease-severity, comorbidity, and laboratory covariates described in the Primary association analyses subsection. Curves represent estimated ORs and shaded regions represent 95% confidence intervals (CIs), where shown. p-overall represents the statistical significance of the overall association, whereas p-nonlinear evaluates evidence for a nonlinear component. Please click here to view a larger version of this figure.
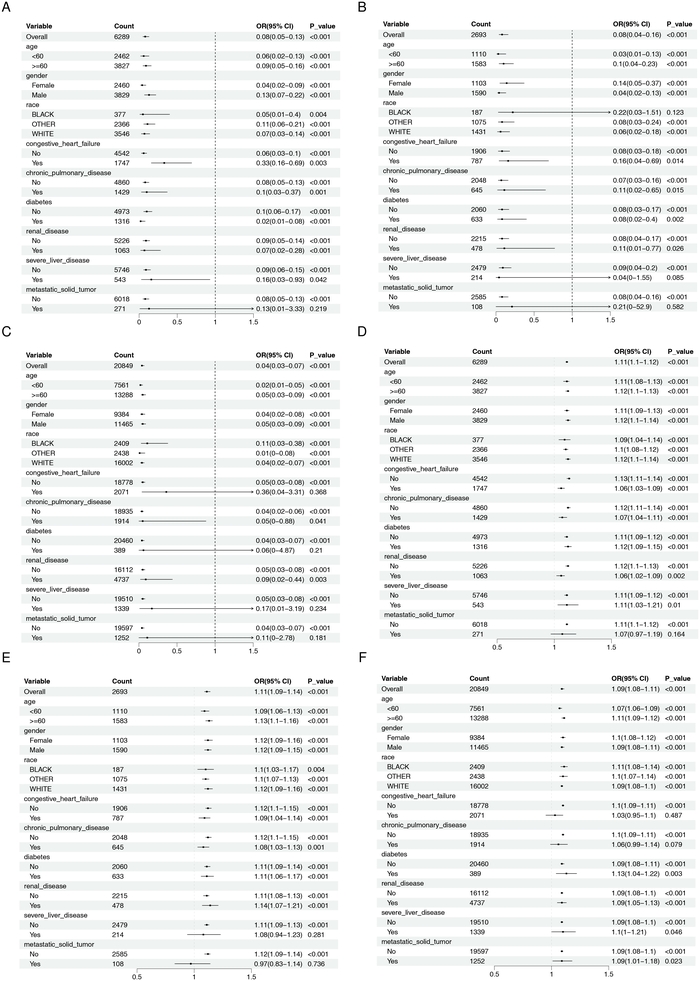
Figure 3: Subgroup analyses of the associations of INR and Hct with stroke status. Panels A-C present subgroup-specific estimates for international normalized ratio (INR) in the MIMIC-IV training cohort, MIMIC-IV internal validation cohort, and eICU-CRD external validation cohort, respectively; panels D-F present the corresponding estimates for hematocrit (Hct). Forest plots display odds ratios (ORs) and 95% confidence intervals (CIs) across the demographic and clinical subgroups shown in each panel. An OR of 1 represents the null value. Please click here to view a larger version of this figure.
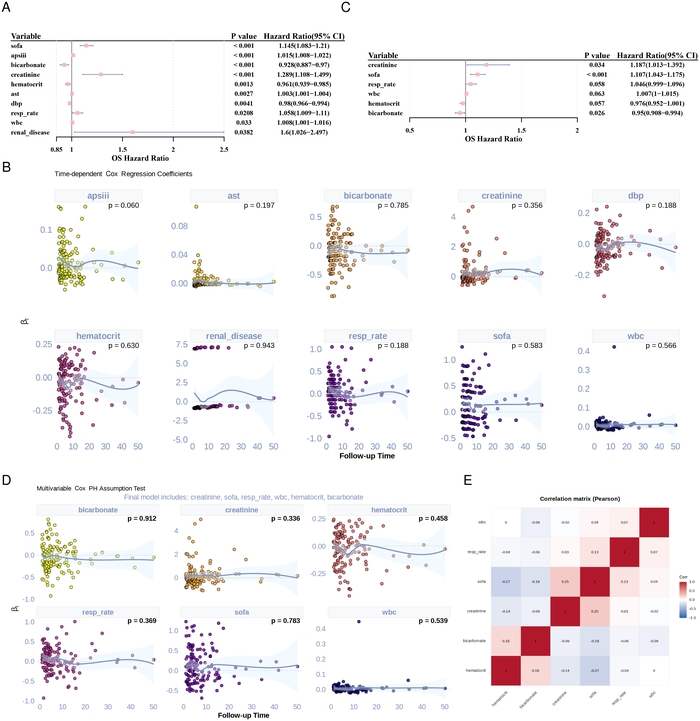
Figure 4: Identification and assessment of variables associated with ICU mortality among patients with stroke. A, univariate Cox proportional hazards regression of candidate variables; B, proportional hazards (PH) assumption assessment for variables retained after univariate screening; C, multivariable Cox proportional hazards regression of retained variables; D, PH assumption assessment for variables retained in the multivariable model; E, pairwise Pearson correlation matrix of the six variables subsequently used for machine learning model development. Variables with p < 0.1 in univariate Cox analysis and satisfying the PH assumption (p > 0.05) were considered for multivariable analysis. Hazard ratios (HRs) are presented with 95% confidence intervals (CIs). Pairwise absolute correlation coefficients |r| ≥ 0.7 were considered indicative of strong correlation. ICU, intensive care unit; SOFA, Sequential Organ Failure Assessment; WBC, white blood cell count; Hct, hematocrit. Please click here to view a larger version of this figure.
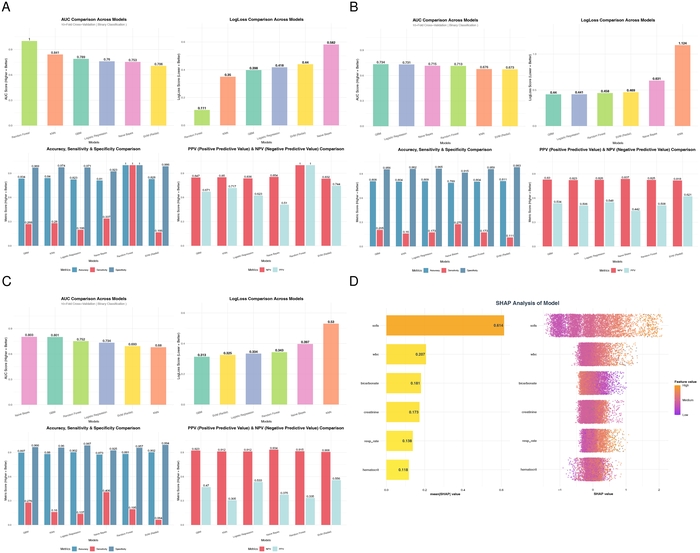
Figure 5: Performance comparison and interpretation of machine learning models for ICU mortality prediction. Panels A-C compare the performance of the six candidate machine learning algorithms in the MIMIC-IV training cohort, MIMIC-IV internal validation cohort, and eICU-CRD external validation cohort, respectively. The evaluated algorithms were Naive Bayes (NB) (v1.0.0), k-nearest neighbors (KNN) (KNN 3()), support vector machine (SVM) (v0.9.33), logistic regression (GLM), gradient boosting machine (GBM) (v2.2.2), and random forest (RF) (v4.7.1.2). Panel D presents Shapley additive explanations (SHAP)-based interpretation of the optimal GBM model, showing the relative contribution and feature effects of the six fixed prognostic predictors. The prediction endpoint was death during the ICU stay. ICU, intensive care unit; SHAP, Shapley Additive explanations. Please click here to view a larger version of this figure.
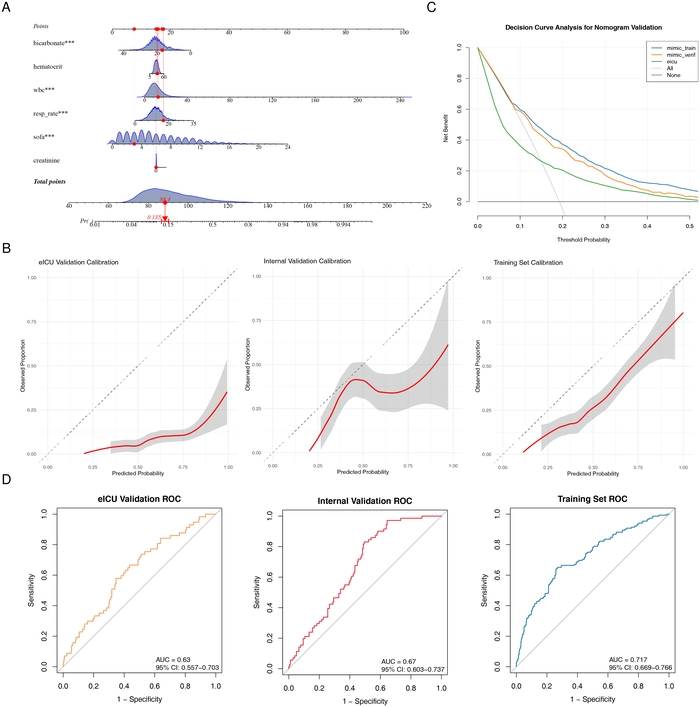
Figure 6: Development and validation of the ICU mortality prediction model. A, nomogram based on the six prognostic predictors retained from the Cox analysis; B, calibration curves comparing predicted and observed probabilities of ICU mortality in the MIMIC-IV training, MIMIC-IV internal validation, and eICU-CRD external validation cohorts, with calibration additionally summarized using Brier scores; C, decision curve analysis (DCA) evaluating net clinical benefit across threshold probabilities; D, receiver operating characteristic (ROC) curves evaluating discrimination for ICU mortality in the three cohorts. The areas under the ROC curve (AUCs) were 0.717 (95% confidence interval [CI], 0.669-0.766), 0.670 (95% CI, 0.603-0.737), and 0.630 (95% CI, 0.557-0.703) in the training, internal validation, and external validation cohorts, respectively. The corresponding Brier scores were 0.2067, 0.2286, and 0.3244. ICU, intensive care unit; DCA, decision curve analysis; ROC, receiver operating characteristic; AUC, area under the receiver operating characteristic curve; CI, confidence interval. Please click here to view a larger version of this figure.
Table 1: International Classification of Diseases codes used to identify stroke subtypes. Hemorrhagic stroke was identified using ICD-9 codes 430-432 and ICD-10 codes I60-I62. Ischemic stroke was identified using ICD-9 codes 433-434 and ICD-10 codes I63, I65, and I66. Patients meeting at least one of the predefined ischemic or hemorrhagic stroke codes were classified as having stroke. ICD-9, International Classification of Diseases, Ninth Revision; ICD-10, International Classification of Diseases, Tenth Revision. Please click here to download this Table.
Table 2: Baseline characteristics of the MIMIC-IV training cohort according to stroke status. Data are presented as mean (standard deviation [SD]) for continuous variables and n (%) for categorical variables. p values represent comparisons between the stroke and non-stroke groups using the statistical tests specified in the Primary association analyses subsection. INR, international normalized ratio; Hct, hematocrit; BMI, body mass index; AST, aspartate aminotransferase; WBC, white blood cell count; SBP, systolic blood pressure; DBP, diastolic blood pressure; MBP, mean blood pressure; SpO2, peripheral oxygen saturation; APS III, Acute Physiology Score III; SOFA, Sequential Organ Failure Assessment; ICU, intensive care unit; LOS, length of stay; SD, standard deviation. Please click here to download this Table.
Table 3: Baseline characteristics of the MIMIC-IV internal validation cohort according to stroke status. Data are presented as mean (standard deviation [SD]) for continuous variables and n (%) for categorical variables. p values represent comparisons between the stroke and non-stroke groups using the statistical tests specified in the Primary association analyses subsection. INR, international normalized ratio; Hct, hematocrit; BMI, body mass index; AST, aspartate aminotransferase; WBC, white blood cell count; SBP, systolic blood pressure; DBP, diastolic blood pressure; MBP, mean blood pressure; SpO2, peripheral oxygen saturation; APS III, Acute Physiology Score III; SOFA, Sequential Organ Failure Assessment; ICU, intensive care unit; LOS, length of stay; SD, standard deviation. Please click here to download this Table.
Table 4: Baseline characteristics of the eICU-CRD external validation cohort according to stroke status. Data are presented as mean (standard deviation [SD]) for continuous variables and n (%) for categorical variables. p values represent comparisons between the stroke and non-stroke groups using the statistical tests specified in the Primary association analyses subsection. INR, international normalized ratio; Hct, hematocrit; BMI, body mass index; AST, aspartate aminotransferase; WBC, white blood cell count; SBP, systolic blood pressure; DBP, diastolic blood pressure; MBP, mean blood pressure; SpO2, peripheral oxygen saturation; APS III, Acute Physiology Score III; SOFA, Sequential Organ Failure Assessment; ICU, intensive care unit; LOS, length of stay; SD, standard deviation. Please click here to download this Table.
Table 5: Distribution and trends of stroke status across INR and hematocrit quartiles. INR and hematocrit (Hct) were categorized separately into quartiles within each dataset. Q1 represents the lowest quartile and Q4 the highest quartile. The table reports the total number of patients, number of patients with stroke, and stroke proportion within each quartile. p values represent comparisons of stroke proportions across quartiles. No regression-derived odds ratios (ORs) are presented in this table; continuous-variable OR estimates are reported in Table 6. INR, international normalized ratio; Hct, hematocrit; Q, quartile; OR, odds ratio. Please click here to download this Table.
Table 6: Continuous associations of INR and hematocrit with stroke status in the primary complete-case analysis. Odds ratios (ORs) and 95% confidence intervals (CIs) were estimated using ordinary multivariable logistic regression without sampling weights, inverse probability weighting, or other weighting procedures. INR and hematocrit (Hct) were modeled as continuous variables. The INR OR represents the change in stroke odds associated with each 1-unit increase in INR, whereas the Hct OR represents the change in stroke odds associated with each 1-percentage-point increase in Hct. Model 1 included only INR or Hct. Model 2 additionally adjusted for age, sex, and race. Model 3 further adjusted for weight, height, body mass index (BMI), heart rate, systolic blood pressure, diastolic blood pressure, mean arterial pressure, respiratory rate, temperature, oxygen saturation, Acute Physiology Score III (APS III), Sequential Organ Failure Assessment (SOFA) score, congestive heart failure, chronic pulmonary disease, diabetes, renal disease, severe liver disease, metastatic solid tumor, white blood cell count, creatinine, glucose, chloride, bicarbonate, sodium, potassium, and anion gap. Female, White race, and absence of each comorbidity (No/0) were used as reference categories. Multiple-imputation results were evaluated separately as a missing-data sensitivity analysis and are reported in the Sensitivity analysis subsection. INR, international normalized ratio; Hct, hematocrit; OR, odds ratio; CI, confidence interval; BMI, body mass index; APS III, Acute Physiology Score III; SOFA, Sequential Organ Failure Assessment. Please click here to download this Table.
Table 7: Sensitivity analysis of continuous INR and hematocrit associations after exclusion of extreme values. The upper and lower 2.5% of the respective INR and hematocrit (Hct) distributions were excluded before repeating the logistic regression analyses. Odds ratios (ORs) are presented with 95% confidence intervals (CIs). Model 1 included only the exposure variable; Model 2 additionally adjusted for age, sex, and race; and Model 3 used the same fully adjusted covariate set as the primary analysis described in Table 6 and the Primary association analyses subsection. INR and Hct were modeled continuously. INR, international normalized ratio; Hct, hematocrit; OR, odds ratio; CI, confidence interval. Please click here to download this Table.
Supplementary Table 1: Variable-specific missing-data proportions before complete-case exclusion in the MIMIC-IV and eICU-CRD datasets. Values represent the percentage of observations missing for each variable in each database before complete-case exclusion. These estimates characterize the extent of missingness underlying the primary complete-case analysis and the multiple-imputation sensitivity analysis.Please click here to download this file.
Supplementary Table 2: Baseline characteristics by INR quartiles in the MIMIC-IV training cohort. International normalized ratio (INR) was categorized into cohort-specific quartiles (Q1-Q4, from lowest to highest). Baseline demographic, laboratory, physiological, comorbidity, disease-severity, and stroke-status variables are summarized across quartiles, and p values compare distributions among the four groups.Please click here to download this file.
Supplementary Table 3: Baseline characteristics by INR quartiles in the MIMIC-IV internal validation cohort. International normalized ratio (INR) was categorized into cohort-specific quartiles (Q1-Q4, from lowest to highest). Baseline demographic, laboratory, physiological, comorbidity, disease-severity, and stroke-status variables are summarized across quartiles, and p values compare distributions among the four groups.Please click here to download this file.
Supplementary Table 4: Baseline characteristics by INR quartiles in the eICU-CRD external validation cohort. International normalized ratio (INR) was categorized into cohort-specific quartiles (Q1-Q4, from lowest to highest). Baseline demographic, laboratory, physiological, comorbidity, disease-severity, and stroke-status variables are summarized across quartiles, and p values compare distributions among the four groups.Please click here to download this file.
Supplementary Table 5: Baseline characteristics by hematocrit quartiles in the MIMIC-IV training cohort. Hematocrit (Hct) was categorized into cohort-specific quartiles (Q1-Q4, from lowest to highest). Baseline demographic, laboratory, physiological, comorbidity, disease-severity, and stroke-status variables are summarized across quartiles, and p values compare distributions among the four groups.Please click here to download this file.
Supplementary Table 6: Baseline characteristics by hematocrit quartiles in the MIMIC-IV internal validation cohort. Hematocrit (Hct) was categorized into cohort-specific quartiles (Q1-Q4, from lowest to highest). Baseline demographic, laboratory, physiological, comorbidity, disease-severity, and stroke-status variables are summarized across quartiles, and p values compare distributions among the four groups.Please click here to download this file.
Supplementary Table 7: Baseline characteristics by hematocrit quartiles in the eICU-CRD external validation cohort. Hematocrit (Hct) was categorized into cohort-specific quartiles (Q1-Q4, from lowest to highest). Baseline demographic, laboratory, physiological, comorbidity, disease-severity, and stroke-status variables are summarized across quartiles, and p values compare distributions among the four groups.Please click here to download this file.
Supplementary Table 8: Multicollinearity diagnostics for the hematocrit model in the MIMIC-IV training cohort. Generalized variance inflation factor (GVIF), degrees of freedom (Df), and adjusted GVIF [GVIF^(1/(2×Df))] are reported for covariates in the fully adjusted Model 3. VIF or adjusted GVIF values greater than 5 were considered suggestive of potentially important multicollinearity.Please click here to download this file.
Supplementary Table 9: Multicollinearity diagnostics for the INR model in the MIMIC-IV training cohort. Generalized variance inflation factor (GVIF), degrees of freedom (Df), and adjusted GVIF [GVIF^(1/(2×Df))] are reported for covariates in the fully adjusted Model 3. VIF or adjusted GVIF values greater than 5 were considered suggestive of potentially important multicollinearity.Please click here to download this file.
Supplementary Table 10: Multicollinearity diagnostics for the hematocrit model in the MIMIC-IV internal validation cohort. Generalized variance inflation factor (GVIF), degrees of freedom (Df), and adjusted GVIF [GVIF^(1/(2×Df))] are reported for covariates in the fully adjusted Model 3. VIF or adjusted GVIF values greater than 5 were considered suggestive of potentially important multicollinearity.Please click here to download this file.
Supplementary Table 11: Multicollinearity diagnostics for the INR model in the MIMIC-IV internal validation cohort. Generalized variance inflation factor (GVIF), degrees of freedom (Df), and adjusted GVIF [GVIF^(1/(2×Df))] are reported for covariates in the fully adjusted Model 3. VIF or adjusted GVIF values greater than 5 were considered suggestive of potentially important multicollinearity.Please click here to download this file.
Supplementary Table 12: Multicollinearity diagnostics for the hematocrit model in the eICU-CRD external validation cohort. Generalized variance inflation factor (GVIF), degrees of freedom (Df), and adjusted GVIF [GVIF^(1/(2×Df))] are reported for covariates in the fully adjusted Model 3. VIF or adjusted GVIF values greater than 5 were considered suggestive of potentially important multicollinearity.Please click here to download this file.
Supplementary Table 13: Multicollinearity diagnostics for the INR model in the eICU-CRD external validation cohort. Generalized variance inflation factor (GVIF), degrees of freedom (Df), and adjusted GVIF [GVIF^(1/(2×Df))] are reported for covariates in the fully adjusted Model 3. VIF or adjusted GVIF values greater than 5 were considered suggestive of potentially important multicollinearity.Please click here to download this file.
Supplementary Figure 1: Stroke subtype-specific sensitivity analyses of INR and Hct. (A) Association of INR with ischemic stroke; (B) association of INR with hemorrhagic stroke; (C) association of Hct with ischemic stroke; and (D) association of Hct with hemorrhagic stroke. Analyses were performed after exclusion of the upper and lower 2.5% of the respective exposure distributions in the MIMIC-IV training and internal validation cohorts. Odds ratios and 95% confidence intervals were estimated using the same sequential logistic regression models as in the primary analysis.Please click here to download this file.
Supplementary Figure 2: Sensitivity analyses with additional adjustment for anticoagulant use and liver-function indicators. (A) Comparison of INR effect estimates between the original fully adjusted model and the model additionally adjusted for anticoagulant use, AST, ALT, total bilirubin, and albumin; (B) corresponding comparison for Hct. Analyses are shown for the MIMIC-IV training and internal validation cohorts. Odds ratios are presented with 95% confidence intervals.Please click here to download this file.
Supplementary Figure 3: Extended sensitivity analyses of the associations of INR and Hct with stroke status after additional adjustment for reliably extractable clinical covariates. (A-C) summarize the extended sensitivity results across the MIMIC-IV and eICU-CRD cohorts, comparing the unadjusted, age + sex + race-adjusted, fully adjusted, and fully adjusted + sensitivity-variable models. Odds ratios are presented with 95% confidence intervals. The eICU-CRD extended model showed complete or near-complete separation and should therefore be interpreted as a sensitivity analysis rather than as a stable effect-size estimate.Please click here to download this file.
Tartışma
This study uses data from MIMIC-IV and eICU-CRD to evaluate the associations of INR and Hct with stroke status in 29,831 eligible ICU patients, and it examines ICU mortality among patients with stroke as a secondary prognostic objective. The primary analyses consistently show that INR is negatively associated with stroke status and that Hct is positively associated with stroke status, although these observational findings require cautious interpretation. Compared with previous studies that mostly examine INR or Hct separately in selected stroke populations, specific stroke etiologies, or prognostic settings, this study performs an ICU-specific, cross-database evaluation of both markers within a unified analytical framework and includes stroke subtype analyses, extreme-value sensitivity analyses, and additional adjustment for measured anticoagulant use and liver function indicators. These analyses show that the association of INR differs between ischemic and hemorrhagic stroke, whereas the positive association of Hct is relatively more consistent across the two major stroke subtypes. Therefore, the main contribution of this study is to extend and further interpret previous evidence on INR and Hct in critically ill populations rather than to establish a new causal or protective role for either biomarker.
The negative association between INR and stroke status requires cautious interpretation. INR is a composite clinical marker of coagulation status and can be affected by multiple factors, including anticoagulant therapy, liver dysfunction, coagulation factor abnormalities, and underlying clinical conditions26,27. In this study, after additional adjustment for measured anticoagulant use and liver function indicators, the effect estimates are broadly similar to those from the original fully adjusted model, suggesting that the association is relatively stable after these measured factors are considered. However, this stability does not establish a protective effect of higher INR, because residual confounding related to anticoagulant dose, treatment duration, indication, adherence, atrial fibrillation, and other coagulation abnormalities cannot be excluded28,29. Therefore, the observed negative association may reflect differences in treatment exposure and baseline clinical characteristics rather than a direct biological effect of INR itself. Because ischemic and hemorrhagic stroke have different pathophysiological mechanisms and clinical risk profiles, we further examine the association by stroke subtype30,31. After excluding extreme values, the negative association between INR and ischemic stroke attenuates and is no longer statistically significant after full adjustment in the MIMIC-IV training and internal validation cohorts, whereas a significant negative association remains for hemorrhagic stroke; Hct is positively associated with both ischemic and hemorrhagic stroke. Consistent with this cautious interpretation, RCS analysis shows a statistically significant overall association between INR and stroke status, but evidence for nonlinearity weakens as covariate adjustment increases and is no longer statistically significant in the fully adjusted Model 3 in all three cohorts. In summary, INR should be regarded as a clinical marker associated with stroke status rather than a protective factor or potential therapeutic target.
Hematocrit appears to be an important hemorheological factor in cerebrovascular events and is positively associated with stroke status, which is consistent with some previous evidence14. Higher Hct reflects a larger red blood cell volume fraction and directly increases whole-blood viscosity; increased viscosity can impair circulation by raising blood flow resistance and reducing cerebral perfusion, especially in narrowed or atherosclerotic cerebral vessels, thereby promoting hypoperfusion and ischemic cerebral infarction11,32. It may also promote red blood cell aggregation and platelet activation, aggravate microcirculatory dysfunction, and impair endothelial homeostasis, thereby favoring thrombosis33,34. Patients with polycythemia vera reportedly have a significantly increased risk of stroke35. Using two large ICU datasets, this study further quantifies this association: in Model 3, each 1-percentage-point increase in Hct is associated with an approximately 7.6% to 10.3% increase in the odds of stroke status across the three cohorts. Therefore, elevated Hct may represent a laboratory marker associated with stroke status. In patients with polycythemia vera, standard approaches such as phlebotomy or cytoreductive therapy remain essential for preventing thrombotic events, including stroke36,37. More broadly, secondary elevations in Hct associated with chronic obstructive pulmonary disease, sleep apnea, dehydration, or high-altitude living warrant clinical attention. In critically ill patients with persistently elevated Hct, correcting reversible factors such as dehydration and chronic hypoxia may theoretically improve hemorheology. However, this observational design cannot determine that lowering Hct reduces stroke risk, and prospective randomized trials are needed to determine whether related interventions are effective; our findings provide epidemiological support for studying these strategies in critically ill populations.
The mortality analysis is a secondary prognostic extension of the primary analysis of INR and Hct with stroke status. After completing the primary association analysis in the overall eligible ICU population, we further assess ICU mortality in patients with confirmed stroke. We first use Cox survival analysis to identify variables associated with ICU mortality, and then fix the retained predictors as inputs for machine learning models used for binary prediction of death during the ICU stay21,38. Multivariable Cox regression identifies six variables associated with ICU mortality: creatinine, SOFA score, respiratory rate, white blood cell count, Hct, and bicarbonate. Notably, Hct is retained in this secondary prognostic analysis, whereas INR is not, suggesting that the mortality prediction analysis should be viewed as a supplementary assessment of prognosis in patients with stroke rather than as additional validation of the primary INR/Hct-stroke status association. The association of Hct with stroke status and its association with ICU mortality may reflect different clinical contexts16,38: in the primary analysis, higher Hct is positively associated with stroke status; in the secondary prognostic analysis, Hct is retained among variables associated with ICU mortality. One possible explanation is that Hct may reflect different physiological processes before and after stroke onset, including blood viscosity, oxygen-carrying capacity, hemodynamic status, and overall disease severity8,33,39. However, this study does not directly assess these mechanisms, so the observed associations should not be interpreted as evidence that Hct is consistently harmful or protective. Previous evidence also suggests that the same biomarker may require context-specific interpretation in different clinical settings40. Guided by this concept, we construct a gradient boosting machine model using the six prognostic variables, and this model performs best in predicting ICU mortality. SHAP analysis identifies SOFA score as the main contributor to the model, which is clinically plausible because SOFA is specifically designed to quantify the severity of organ failure in ICU patients. Notably, Hct and bicarbonate, two inexpensive and readily available routine laboratory parameters, are also retained as predictors of ICU mortality and may provide prognostic information beyond composite scores such as SOFA. The nomogram converts the multivariable model into a visual bedside tool that estimates the probability of ICU death for an individual patient by summing feature-specific scores. The model shows moderate discrimination in the training cohort, with decreased discrimination in the internal and external validation cohorts; calibration is relatively good in the training cohort, whereas greater deviation is observed in the external validation cohort. These findings support the potential prognostic value of the selected variables but should be considered exploratory, especially given the decreased discrimination and calibration performance in the validation cohorts, and further prospective validation is needed before clinical implementation.
Overall, the primary analysis shows that INR is negatively associated with stroke status and Hct is positively associated with stroke status in the study cohorts, but these observational findings should be interpreted in light of residual confounding and stroke subtype heterogeneity. As a secondary extension, the prognostic analysis in patients with stroke identifies six variables associated with ICU mortality, including Hct, which are then used for exploratory machine learning-based mortality prediction; INR is not retained in the final prognostic variable set. Therefore, the mortality prediction analysis provides a supplementary perspective on short-term prognosis in patients with confirmed stroke rather than serving as validation of the primary INR/Hct-stroke status association. These findings provide additional observational evidence on the associations of routine coagulation and hemorheology-related markers with stroke status and short-term prognosis in critically ill patients. However, several limitations should be acknowledged. First, because this is a retrospective observational study, selection bias and information bias cannot be completely avoided, and the observed associations should not be interpreted as causal. Although INR and Hct are defined as the first available measurements within 24 h after ICU admission, stroke status is identified based on diagnosis codes recorded during hospitalization, and the exact time of stroke onset is not consistently available; therefore, temporal ambiguity and potential reverse causation cannot be excluded, and the observed associations should not be interpreted as prospective prediction of stroke occurrence. Second, MIMIC-IV and eICU-CRD come from different healthcare settings and data collection periods and may differ in patient characteristics, diagnostic coding, laboratory measurements, clinical practice, and data completeness; this database heterogeneity may lead to differences in effect estimates and predictive performance across cohorts. Third, although the fully adjusted model includes multiple demographic, physiological, disease severity, comorbidity, and laboratory variables, and additional sensitivity analyses considered measured anticoagulant use, liver function indicators, atrial fibrillation, anemia, venous thromboembolism, other coagulation abnormalities, coagulation-related laboratory indicators, and fluid balance, residual confounding may still exist. Detailed information on anticoagulant dose, treatment duration, indication, and adherence was not comprehensively available, and the extended sensitivity analysis was limited by markedly reduced complete-case sample sizes and model separation. Future prospective multicenter cohorts involving populations with different racial and geographic backgrounds are needed to further evaluate the reproducibility and clinical relevance of these associations. In addition, alternative study designs and methods can help test the hypotheses of this study, such as repeated measurement of INR and Hct in prospective cohorts with time-dependent or joint model analyses, the use of competing risk or multistate models to handle competing events such as death and discharge, Mendelian randomization to assess potential causal direction, and randomized controlled trials to test whether interventions targeting Hct or coagulation status can alter stroke risk or short-term prognosis.
Açıklamalar
The authors declare no conflicts of interest. The authors declare that the research was conducted in the absence of any commercial or financial relationships that could be construed as a potential conflict of interest.
AUTHOR CONTRIBUTIONS:
Juan Han contributed to conceptualization, data curation, validation, visualization, and preparation of the original draft and reviewed and edited the manuscript. Linming Zhang contributed to conceptualization, data curation, validation, visualization, and supervision and reviewed and edited the manuscript. Chunyan Lei contributed to visualization and reviewed and edited the manuscript.
Teşekkürler
We thank all individuals and organizations who supported and assisted this research. This research received no specific grant from funding agencies in the public, commercial, or not-for-profit sectors.
Malzemeler
| Ad | Şirket | Katalog numarası | Yorumlar |
|---|---|---|---|
| eICU Collaborative Research Database (eICU-CRD) | PhysioNet | https://physionet.org/content/eicu-crd/ | Data from the first quarter of 2014 to the fourth quarter of 2015 were used. Multicenter de-identified ICU database used as the independent external validation cohort. |
| MIMIC-IV | PhysioNet / Massachusetts Institute of Technology / Beth Israel Deaconess Medical Center | https://physionet.org/content/mimiciv/ | Data from the first quarter of 2008 to the fourth quarter of 2019 were used. Public de-identified ICU database used for cohort construction, primary association analyses, and model development/validation. |
| R package "caret" | Comprehensive R Archive Network (CRAN) | https://CRAN.R-project.org/package=caret | Version 7.0.1. Machine-learning model training, 10-fold cross-validation, model evaluation, and hyperparameter selection. |
| R package "forestplot" | Comprehensive R Archive Network (CRAN) | https://CRAN.R-project.org/package=forestplot | Version 3.1.7. Forest plot generation. |
| R package "ggplot2" | Comprehensive R Archive Network (CRAN) | https://CRAN.R-project.org/package=ggplot2 | Version 3.5.2. Plotting and visualization. |
| R package "Hmisc" | Comprehensive R Archive Network (CRAN) | https://CRAN.R-project.org/package=Hmisc | Version 5.2.3. Correlation analysis. |
| R package "plotRCS" | Comprehensive R Archive Network (CRAN) | https://CRAN.R-project.org/package=plotRCS | Version 0.1.5. Restricted cubic spline curves. |
| R package "pROC" | Comprehensive R Archive Network (CRAN) | https://CRAN.R-project.org/package=pROC | Version 1.18.0. Receiver operating characteristic (ROC) analysis and area-under-the-curve evaluation. |
| R package "regplot" | Comprehensive R Archive Network (CRAN) | https://CRAN.R-project.org/package=regplot | Version 1.1. Nomogram generation. |
| R package "rmda" | Comprehensive R Archive Network (CRAN) | https://CRAN.R-project.org/package=rmda | Version 1.6. Decision curve analysis. |
| R package "rms" | Comprehensive R Archive Network (CRAN) | https://CRAN.R-project.org/package=rms | Version 6.8.1. Regression analysis. |
| R package "survey" | Comprehensive R Archive Network (CRAN) | https://CRAN.R-project.org/package=survey | Version 4.4.8. Regression analysis. |
| R package "survival" | Comprehensive R Archive Network (CRAN) | https://CRAN.R-project.org/package=survival | Version 3.8.3. Cox proportional hazards regression. |
| R package "tableone" | Comprehensive R Archive Network (CRAN) | https://CRAN.R-project.org/package=tableone | Version 0.13.2. Baseline characteristics analysis. |
| R package "xgboost" | Comprehensive R Archive Network (CRAN) | https://CRAN.R-project.org/package=xgboost | Version 2.0.3.1. Model interpretation. |
| R statistical software | R Foundation for Statistical Computing, Vienna, Austria | https://cran.r-project.org/ | Version 4.2.2. Statistical analysis and computational environment. |
Kaynaklar
- Feigin VL et al. World Stroke Organization: Global Stroke Fact Sheet 2025. Int J Stroke. 2025;20(2):132-44.
- Tu WJ, Wang LD. China stroke surveillance report 2021. Mil Med Res. 2023;10(1):33.
- Faber JE. Collateral blood vessels in stroke and ischemic disease: formation, physiology, rarefaction, remodeling. J Cereb Blood Flow Metab. 2025;45(6):1007-30.
- Alsbrook DL et al. Neuroinflammation in acute ischemic and hemorrhagic stroke. Curr Neurol Neurosci Rep. 2023;23(8):407-31.
- Cheng F et al. Ischemic stroke and the biological hallmarks of aging. Aging Dis. 2025;16(5):2908-36.
- Chen R et al. Effects of co-application of tiotropium bromide and traditional Chinese medicine on patients with stable chronic obstructive pulmonary disease: a muilticenter, randomized, controlled trial study. Front Med (Lausanne). 2024;11:1289928.
- Yan M et al. Apolipoprotein A-IV regulates coagulation and ischemic stroke by potentiating activated protein C. J Thromb Haemost. 2025;23(9):2837-48.
- Gyawali P et al. Whole blood viscosity and cerebral blood flow in acute ischemic stroke. Semin Thromb Hemost. 2024;50(4):580-91.
- Vivona L et al. Hematocrit: the neglected variable of extracorporeal CO2 removal. Am J Respir Crit Care Med. 2024;209(5):595-8.
- Trejo-Soto C, Hernandez-Machado A. Normalization of blood viscosity according to the hematocrit and the shear rate. Micromachines (Basel). 2022;13(3):357.
- Carson JL et al. Transfusion thresholds for guiding red blood cell transfusion. Cochrane Database Syst Rev. 2021;12(12):CD002042.
- Hylek EM et al. Effect of intensity of oral anticoagulation on stroke severity and mortality in atrial fibrillation. N Engl J Med. 2003;349(11):1019-26.
- Ay H et al. Admission international normalized ratio and acute infarct volume in ischemic stroke. Ann Neurol. 2008;64(5):499-506.
- Yang R et al. Hematocrit and the incidence of stroke: a prospective, population-based cohort study. Ther Clin Risk Manag. 2018;14:2081-8.
- Chen H et al. Mildly elevated INR is associated with worse outcomes following mechanical thrombectomy for acute ischemic stroke. J Neurointerv Surg. 2023;15(e1):e117-22.
- Cui L et al. Hematocrit predicts poor prognosis in patients with acute ischemic stroke or transient ischemic attack. Brain Sci. 2024;14(5):439.
- Guo Y et al. The mediating effect of intracranial hemorrhage status on the relationship between the INR and mortality in patients with ischemic stroke. Neurol Ther. 2025;14(3):881-94.
- Gabriele F et al. Epidemiology and outcomes of intracerebral hemorrhage associated with oral anticoagulation over 10 years in a population-based stroke registry. Int J Stroke. 2024;19(5):515-25.
- Johnson AEW et al. MIMIC-IV, a freely accessible electronic health record dataset. Sci Data. 2023;10(1):1.
- Pollard TJ et al. The eICU Collaborative Research Database, a freely available multi-center database for critical care research. Sci Data. 2018;5:180178.
- Huang J et al. Interpretable machine learning for predicting 28-day all-cause in-hospital mortality for hypertensive ischemic or hemorrhagic stroke patients in the ICU: a multi-center retrospective cohort study with internal and external cross-validation. Front Neurol. 2023;14:1185447.
- Wei H et al. Explainable machine learning for predicting neurological outcome in hemorrhagic and ischemic stroke patients in critical care. Front Neurol. 2024;15:1385013.
- Knaus WA et al. The APACHE III prognostic system. Risk prediction of hospital mortality for critically ill hospitalized adults. Chest. 1991;100(6):1619-36.
- Vincent JL et al. The SOFA (Sepsis-related Organ Failure Assessment) score to describe organ dysfunction/failure. On behalf of the Working Group on Sepsis-Related Problems of the European Society of Intensive Care Medicine. Intensive Care Med. 1996;22(7):707-10.
- Vickers AJ, Elkin EB. Decision curve analysis: a novel method for evaluating prediction models. Med Decis Making. 2006;26(6):565-74.
- Raza S et al. The historical origins of modern international normalized ratio targets. J Thromb Haemost. 2024;22(8):2184-94.
- Smith CB, Hennessey EK, Crossey CD, Crannage AJ. Impact of vitamin K administration on elevated international normalized ratio in chronic liver disease. Clin Appl Thromb Hemost. 2023;29:10760296231164642.
- Kosum P et al. Utility of TTR-INR guided warfarin adjustment protocol to improve time in therapeutic range in patients with atrial fibrillation receiving warfarin. Sci Rep. 2024;14(1):11647.
- Alshihab S et al. Evaluation of warfarin management in primary health care centers in Qatar: a retrospective cross-sectional analysis of the national dataset. Curr Probl Cardiol. 2024;49(4):102427.
- Maida CD et al. Molecular pathogenesis of ischemic and hemorrhagic strokes: background and therapeutic approaches. Int J Mol Sci. 2024;25(12):6297.
- Li XS et al. [Comparison of risk factors for hemorrhagic stroke and ischemic stroke, a prospective long-term follow-up cohort study]. Zhonghua Liu Xing Bing Xue Za Zhi. 2023;44(9):1383-9.
- Pries AR, Secomb TW. Microvascular blood viscosity in vivo and the endothelial surface layer. Am J Physiol Heart Circ Physiol. 2005;289(6):H2657-64.
- Gyawali P et al. Whole blood viscosity is associated with baseline cerebral perfusion in acute ischemic stroke. Neurol Sci. 2022;43(4):2375-81.
- Baskurt OK, Meiselman HJ. Blood rheology and hemodynamics. Semin Thromb Hemost. 2024;50(6):902-15.
- Enblom-Larsson A et al. Thromboembolic events, major bleeding and mortality in essential thrombocythaemia and polycythaemia vera-a matched nationwide population-based study. Br J Haematol. 2024;204(5):1740-51.
- Tremblay D, Kremyanskaya M, Mascarenhas J, Hoffman R. Diagnosis and treatment of polycythemia vera: a review. JAMA. 2025;333(2):153-60.
- Tefferi A, Vannucchi AM, Barbui T. Polycythemia vera: historical oversights, diagnostic details, and therapeutic views. Leukemia. 2021;35(12):3339-51.
- Fan X et al. Retrospective cohort study based on the MIMIC-IV database: analysis of factors influencing all-cause mortality at 30 days, 90 days, 1 year, and 3 years in patients with different types of stroke. Front Neurol. 2025;15:1516079.
- Sitina M, Stark H, Schuster S. Optimal hematocrit theory: a review. J Appl Physiol (1985). 2024;137(3):494-509.
- Xu W et al. Mitochondrial arginase 2 regulates hematopoietic and cardiovascular adaptation to hypoxia. Blood Vessel Thromb Hemost. 2026;3(1):100110.