This study protocol introduces the use of herbal-cake-separated moxibustion for adenine-induced chronic kidney disease in rats and finds that it can improve kidney function, reduce renal fibrosis, and enhance bone microstructure by upregulating BMP-7 and inhibiting the TGF-β1/Smad pathway.
Araştırma makalesi
Herbal-Cake-Separated Moxibustion Ameliorates Renal Fibrosis and Associated Bone Injury in Rats via the TGF-β1/Smad Signaling Pathway
* These authors contributed equally
Bu makalede
Özet
Özet
Renal fibrosis is the main pathological basis for chronic kidney disease (CKD) progression and is often accompanied by decreased bone density and impaired bone microstructure. The TGF-β1/Smad signaling pathway may be a common intervention target for kidney and bone injury. This study evaluated the effects of herbal-cake-separated moxibustion (HCSM) on renal fibrosis and bone damage in CKD rats and explored its potential mechanism. CKD was induced by adenine gavage combined with a high-protein diet. Successfully modeled rats were randomly assigned to model, HCSM, and SIS3 groups (n = 6 each), with an additional control group (n = 6). The control and model groups received no intervention. The HCSM group received treatment at Pishu (BL20) and Shenshu (BL23), whereas the SIS3 group received intraperitoneal SIS3 (2.5 mg/kg every 2 days). Treatment comprised three 12-day courses separated by 2-day intervals. Renal injury was assessed by kidney function, kidney index, and histopathology. Western blotting measured TGF-β1, Smad2/3, p-Smad2/3, and BMP-7 expression, and micro-computed tomography assessed femoral bone density and microstructure. Compared with controls, model rats showed significantly increased blood urea nitrogen (BUN), serum creatinine (Scr), and kidney index (p < 0.0001); marked renal fibrosis; increased TGF-β1, p-Smad2/3, and Smad2/3; decreased BMP-7; reduced bone mineral density (BMD) and trabecular number; and increased trabecular separation. Compared with the model group, HCSM and SIS3 improved renal function and histopathology, increased BMD and trabecular number, reduced trabecular separation, suppressed TGF-β1/Smad signaling, and increased BMP-7 expression. These findings indicate that HCSM may improve renal fibrosis and associated bone damage by enhancing BMP-7 expression and inhibiting TGF-β1/Smad signaling.
Giriş
Chronic kidney disease (CKD) is a clinical syndrome characterized by persistent deterioration of renal function caused by various factors and accompanied by irreversible structural alterations in renal tissue. Its global prevalence is approximately 10% and continues to rise, posing a serious challenge to public health1. Renal fibrosis (RF) is the principal pathological basis of CKD and the final common pathway through which various kidney diseases progress to end-stage renal disease2. Without effective intervention, CKD may continue to progress to end-stage renal disease (ESRD), at which point patients can survive only through renal replacement therapy3. Therefore, early intervention and the attenuation of renal fibrosis are critical for CKD treatment. At present, clinical management mainly relies on symptomatic treatment with drugs and surgery to control the primary disease and delay the decline in renal function. However, these approaches are often accompanied by numerous adverse effects. In contrast, herbal-cake-separated moxibustion (HCSM), as an external treatment modality in traditional Chinese medicine, has demonstrated clear efficacy, few adverse reactions, and advantages in terms of cost-effectiveness and safety in the prevention and treatment of CKD, and thus may represent a novel therapeutic strategy for CKD4.
A large body of evidence has demonstrated that renal fibrosis results from the interaction of multiple signaling pathways, among which the TGF-β1/Smad signaling pathway plays a central role in its development5,6,7. Our previous studies found that HCSM can alleviate renal fibrosis and delay CKD progression by regulating the TGF-β1/Smad pathway4. Notably, the TGF-β1/Smad pathway not only regulates renal fibrosis but is also a key pathway involved in maintaining bone homeostasis and modulating bone metabolism, with the capacity to improve bone microarchitecture and bone mineral density8,9. In the context of CKD, renal fibrosis frequently coexists with abnormalities in bone metabolism, and animal studies have confirmed that renal fibrosis is often accompanied by decreased BMD and deterioration of bone microarchitecture10. Therefore, by targeting the TGF-β1/Smad pathway, HCSM may exert beneficial effects on both the kidney and bone in CKD. Based on this background, we proposed that HCSM exerts anti-renal fibrotic effects by regulating the TGF-β1/Smad signaling pathway and may also ameliorate associated bone destruction. Accordingly, in an adenine-induced rat model of renal fibrosis, the present study investigated the effects of HCSM on renal function, renal pathology, and the expression of key proteins in the TGF-β1/Smad pathway in renal tissue, while also analyzing bone microstructural parameters and bone mineral density, in order to explore the ameliorative effects of HCSM on CKD-related renal fibrosis and associated bone damage, as well as its potential molecular mechanisms.
Protokol
All experimental procedures were approved by the Experimental Animal Management Committee of Yunnan University of Chinese Medicine (Ethics Approval No. R-062021G098). All animal procedures were conducted in accordance with the Guiding Opinions on the Humane Treatment of Laboratory Animals issued by the Ministry of Science and Technology of the People’s Republic of China (2006).
Animals and experimental design
Thirty healthy male specific pathogen-free (SPF) Sprague-Dawley (SD) rats, aged 3–4 weeks and weighing 180–220 g, were purchased from SPF (Beijing) Biotechnology Co., Ltd. (Production License No. SCXK (Beijing) 2019-0010). Following a 7-day acclimation period at the Experimental Animal Center of Yunnan University of Chinese Medicine (Use License No. SYXK (Yunnan) K2022-0004), rats were housed 6–7 per cage under controlled environmental conditions (temperature 21–26 °C, relative humidity 45%–70%, and a 12 h light/12 h dark cycle) with free access to standard chow and water.
After acclimation, 30 rats were randomly allocated to a control group (n = 9) and a model induction group (n = 21). On day 8, rats in the model induction group received a freshly prepared 1.5% (w/v; 15 mg/mL) adenine suspension via oral gavage once daily, at a dose of 10 mL/kg (150 mg/kg/day), together with a high-protein diet (50% casein), for 21 consecutive days to induce chronic kidney disease (CKD). Rats in the control group received an equal volume of distilled water (10 mL/(kg·day), gavage) and were fed a standard diet over the same period. After 21 days of model induction, blood samples were collected from the orbital venous plexus for measurement of Scr and BUN. In addition, three rats from each group were randomly selected for euthanasia by excessive inhalation of 2%–3% isoflurane anesthesia, and renal tissues were subjected to histopathological examination using hematoxylin and eosin (H&E) staining and Masson's trichrome staining. Compared with the control group, rats in the model induction group exhibited increased Scr and BUN levels, gross renal pallor, glomerular injury, tubular atrophy or hypertrophy, marked inflammatory cell infiltration in the renal interstitium, and collagen fiber deposition, confirming the successful establishment of the CKD model11. Successfully modeled rats were then randomly assigned to the model group, herbal-cake-separated moxibustion group, and SIS3 group (n = 6 per group).
Preparation of medicinal cakes, moxa cones, and acupoint localization
Medicinal cakes were prepared from Radix Astragali, Radix Codonopsis, Radix Rehmanniae Praeparata, roasted Epimedium, and Cornus officinalis, mixed in a ratio of 3:3:2:1:1 by weight (w/w) and ground into a fine powder. The powder was combined with warm water at a 1:1 ratio to form a uniform paste. The paste was shaped using the barrel of a 5 mL syringe with the base removed as a mold, producing round medicinal cakes measuring 8 mm in diameter and 3 mm in thickness. Each medicinal cake contained approximately 0.1 g of total dry herbal powder. Moxa cones were prepared using a custom-made conical mold. Briefly, 0.2 g of refined moxa wool was accurately weighed and compressed into the mold to form cones with a base diameter and height of 5 mm.
Acupoints were localized according to standard rat acupoint anatomical references. Pishu (BL20) was located 5 mm lateral to the lower border of the spinous process of the 11th thoracic vertebra, and Shenshu (BL23) was located 5 mm lateral to the lower border of the spinous process of the 2nd lumbar vertebra (Figure 1). Bilateral BL20 and BL23 were selected for treatment12.
Intervention
No pharmacological treatment or moxibustion was administered to rats in the control or model groups. Rats in the herbal-cake-separated moxibustion group received treatment at the bilateral BL20 and BL23 sites. During the procedure, each rat was gently restrained, and a freshly prepared medicinal cake was placed over each acupoint. A moxa cone was then positioned on top of the medicinal cake and ignited. After the cone had burned out completely and residual heat had dissipated (approximately 3 min), a new medicinal cake and moxa cone were applied for the next round of stimulation. Bilateral BL20 and BL23 were treated simultaneously. Five moxa cones were applied per acupoint once daily, for an approximate treatment time of 15 min per rat per session. During the treatment process, a temperature probe was used to monitor in real time the temperature at the contact surface between the herb cake and the acupoint skin, and the temperature was maintained at 40–42°C by adjusting the position of the moxa pillar, in order to ensure the consistency of the treatment and prevent thermal injury. Rats in the SIS3 group were injected intraperitoneally with SIS3 every 2 days at a dose of 2.5 mg/kg and an injection volume of 1 mL/kg. SIS3 was prepared at a concentration of 2.5 mg/mL in a solvent comprising 10% DMSO, 40% PEG300, 5% Tween-80, and 45% sterile 0.9% saline (v/v/v/v). SIS3 was first dissolved in DMSO, then PEG300 and Tween-80 mixture were added sequentially, followed by saline, and finally vortexed until homogeneous before use. Each intervention cycle lasted 12 days, and treatments were administered for three consecutive cycles, with a 2-day interval between cycles, giving a total intervention period of 40 days. During the experimental period, all rats were maintained under the same environmental and feeding conditions.
Collection and processing of blood and tissue samples
After completion of the intervention period, rats were fasted for 12 h, weighed, and anesthetized with 2%–3% isoflurane. Adequate anesthesia was confirmed by the absence of reflex responses to tail pinch while maintaining a stable heartbeat, after which anesthesia was maintained with 1%–1.5% isoflurane. Approximately 5 mL of blood was collected from the abdominal aorta, allowed to stand for 2 h, and centrifuged at 2,490 x g for 10 min at 4 °C. The serum supernatant was collected and stored at −80 °C until analysis. Rats were then euthanized by overdose anesthesia. Bilateral kidneys were dissected, freed of surrounding fascia and fat, rinsed with 0.9% saline, weighed, and photographed for gross morphological observation. The kidney index was calculated as kidney wet weight (g)/body weight (g). The left kidney was divided into six pieces and fixed in 4% paraformaldehyde for histopathological analysis. The right kidney was divided similarly, placed into cryovials, snap-frozen in liquid nitrogen, and stored for subsequent western blot analysis. The left femur was harvested, cleared of adherent soft tissue, and fixed in 4% paraformaldehyde for micro-CT analysis.
Measurement of serum biochemical parameters
Serum biochemical indices were measured using a fully automated biochemical analyzer according to the manufacturer’s instructions. Briefly, 100 µL of serum from each sample was loaded onto the renal function assay plate and analyzed to determine Scr and BUN concentrations.
Western blotting
Protein expression levels of TGF-β1, Smad2/3, p-Smad2/3, and BMP-7 in renal tissue were determined by western blotting. Briefly, approximately 50 mg of kidney tissue from each rat was homogenized in 500 µL of RIPA lysis buffer on ice. After centrifugation, the supernatant containing total protein was collected. Protein concentration was determined using a bicinchoninic acid (BCA) protein assay. Equal amounts of protein were mixed with loading buffer, denatured, separated by sodium dodecyl sulfate–polyacrylamide gel electrophoresis (SDS-PAGE), and transferred onto polyvinylidene difluoride (PVDF) membranes. Membranes were blocked to reduce non-specific binding and then incubated overnight at 4 °C with the following primary antibodies: TGF-β1 (1:1000), Smad2/3 (1:1000), p-Smad2/3 (1:1000), BMP-7 (1:5000), and GAPDH (1:10000). After washing with TBST, membranes were incubated with goat anti-rabbit IgG secondary antibody (1:10000) at room temperature for 1 h. Following further washing, an enhanced chemiluminescence reagent was added, and protein bands were visualized using a fully automated chemiluminescence imaging system. Band intensities were quantified using ImageJ software. Relative expression of target proteins was normalized to GAPDH.
Histopathological analysis
Renal histopathological examination was performed using H&E staining and Masson trichrome staining. For H&E staining, paraffin-embedded kidney sections were routinely deparaffinized, rehydrated, stained with hematoxylin for 5–6 min, rinsed under running water, and counterstained with eosin for 2–3 min. Differentiation with 1% hydrochloric acid ethanol was performed when required, and sections were mounted with neutral resin. H&E-stained sections were used to evaluate general renal morphology, including glomerular injury, tubular dilatation or atrophy, and inflammatory cell infiltration. Histological changes were examined under a light microscope at 200× magnification. For Masson trichrome staining, paraffin sections were stained with hematoxylin for 5 min, briefly differentiated with 1% hydrochloric acid ethanol, and then stained sequentially with Ponceau S, phosphomolybdic acid, and aniline blue according to the manufacturer’s instructions. After dehydration through graded ethanol and mounting with neutral resin, sections were observed under a light microscope at 200× magnification. Masson staining was used to assess collagen fiber deposition and renal interstitial fibrosis. Representative histological images were captured for analysis. All histopathological assessments were performed by experienced pathologists blinded to group allocation.
Micro-CT analysis
Micro-CT was performed to evaluate BMD and trabecular bone microarchitecture in the distal femur. Before scanning, femurs fixed in 4% paraformaldehyde were removed from the fixative and prepared for image acquisition. The left femur from each rat was scanned using a Hiscan Micro-CT system (Suzhou Hiscan Information Technology Co., Ltd.) with the following parameters: 60 kV, 134 µA, exposure time 111 ms, and spatial resolution 35 µm. Following scanning, 210 consecutive slices were selected as the region of interest (ROI) from 3.75 mm away from the growth plate, with a corresponding longitudinal length of about 7.35 mm, comprising predominantly trabecular bone (Figure 2). Quantitative analysis of bone microarchitectural parameters was performed using Hiscan Analyzer softwareb(Bone density analysis parameters: CT minimum value 898 Hu, maximum value 3582 Hu; density minimum value 1.16 g/cm3, maximum value 1.90 g/cm3). Three-dimensional reconstructions of the distal femur were generated to visualize trabecular structure and assess morphological differences among groups.
Statistical analysis
Statistical analyses were performed using SPSS version 27.0, and graphs were generated using GraphPad Prism version 9.0. Data were first tested for normality and homogeneity of variance. Differences among groups were analyzed using one-way analysis of variance (ANOVA). When a significant overall difference was detected, Tukey’s honestly significant difference test was used for post hoc multiple comparisons. A two-sided p-value <0.05 was considered statistically significant. Pearson correlation analysis was performed using paired animal-level data for renal indices (BUN, Scr, and kidney index) and bone parameters (BMD, Tb.N, and Tb.Sp). Data from all four groups were pooled (6 rats per group; n = 24 paired observations for each correlation). Two-tailed Pearson product–moment correlation coefficients and corresponding P values were calculated in SPSS 27.0; p values <0.05 were considered statistically significant.
Sonuçlar
Comparison of macroscopic appearance and histomorphology of kidneys among groups
As shown in Figure 3A, the renal parenchyma of rats in the control group presented a normal reddish-brown appearance, with a smooth surface and an intact capsule. In the model group, the kidneys were markedly enlarged, pale, and dull in color, with a granular surface, which is consistent with the typical macroscopic features of the renal fibrosis model. Following intervention with either HCSM or SIS3, macroscopic improvements in both renal enlargement and pallor were observed, suggesting that these interventions may alleviate the pathological burden on the kidneys.
The results of hematoxylin and eosin (H&E) and Masson’s trichrome staining of the renal tissues in each group are presented in Figure 3B. H&E staining revealed normal renal histomorphology architecture in the control group. In contrast, the model group exhibited typical pathological changes associated with renal fibrosis. These alterations included glomerular mesangial expansion and sclerosis with varying glomerular sizes, hydropic degeneration in a small number of tubular epithelial cells, extensive proliferation of interstitial fibrous connective tissue, and occasional tubular dilation. These changes were accompanied by marked infiltration of lymphocytes and a few granulocytes, alongside occasional multinucleated giant cells and minor pericellular fibrous proliferation. In both the HCSM and SIS3 groups, pathological alterations such as interstitial fibroplasia and the infiltration of lymphocytes and granulocytes were attenuated compared with those in the model group. Masson’s trichrome staining further confirmed tubular dilation and massive proliferation of collagen fibers in the model group, whereas collagen deposition was reduced in the HCSM and SIS3 groups compared with the model group.
Comparison of serum BUN, Scr, and kidney index among groups
Compared with the control group, the levels of blood urea nitrogen (BUN) and serum creatinine (Scr), as well as the kidney index, were significantly elevated in the model group (p < 0.0001). Following intervention, BUN levels were significantly reduced in the HCSM and SIS3 groups compared with the model group (p < 0.001), and both Scr and the kidney index were also significantly decreased (p < 0.05). There was no statistically significant difference between the HCSM and SIS3 groups (p > 0.05) (Figure 3C). These findings indicate that severe renal impairment was successfully induced by adenine and that both HCSM and SIS3 significantly improved these renal measures compared with the model group.
Protein expression of TGF-β1, Smad2/3, p-Smad2/3, and BMP-7 in renal tissues among groups
As shown in Figure 4, compared with the control group, the protein expression of TGF-β1, a key factor in the profibrotic pathway, and its downstream phosphorylated target p-Smad2/3 were markedly upregulated in the renal tissues of the model group (p < 0.0001). Additionally, the relative expression of Smad2/3 was significantly increased (p < 0.01), whereas the expression of the anti-fibrotic protein BMP-7 was profoundly suppressed (p < 0.0001). Following the intervention, both HCSM and SIS3 exerted significant regulatory effects. Both treatments effectively inhibited the expression of TGF-β1 and p-Smad2/3 (p < 0.001), significantly reduced the relative protein expression of Smad2/3 (p < 0.05), and were accompanied by upregulation of BMP-7 expression (HCSM group, p < 0.05; SIS3 group, p < 0.01). Notably, there were no statistically significant differences between HCSM and the specific Smad3 inhibitor SIS3 in modulating the expression of these key proteins (p > 0.05).
Micro-CT imaging and Pearson correlation analysis among groups
Micro-CT imaging is presented in Figure 5A. Compared with the control group, rats in the model group exhibited a noticeable reduction in trabecular number and a sparse, thinned bone microarchitecture. Conversely, compared with the model group, the trabecular number was visibly increased, and the trabecular network appeared denser in both the HCSM and SIS3 groups. As illustrated in Figure 5B, bone mineral density (BMD) and trabecular number (Tb.N) were significantly lower (p < 0.01), while trabecular separation (Tb.Sp) was significantly higher (p < 0.01) in the model group than in the control group. Following intervention with HCSM or SIS3, BMD and Tb.N were significantly increased (p < 0.05). Tb.Sp was significantly decreased (p < 0.05) compared with the model group. No statistically significant differences were observed between the HCSM and SIS3 groups (p > 0.05). These results indicate that rats with renal fibrosis experience severe concurrent bone loss and microstructural deterioration, and that both HCSM and SIS3 can reverse this associated bone damage while improving renal function, with no statistically significant difference detected between the HCSM and SIS3 groups.
Furthermore, the heatmap in Figure 5C illustrates the Pearson linear correlations between renal function indices (BUN, Scr, and kidney index) and bone microstructural parameters (BMD, Tb.N, and Tb.Sp). The correlation coefficient r ranges from -1 to 1, with an absolute value closer to 1 indicating a stronger correlation. BMD and Tb.N demonstrated strong negative correlations with BUN, Scr, and the kidney index (r = -0.589 to -0.479). Meanwhile, Tb.Sp showed strong positive correlations with BUN, Scr, and the kidney index (r = 0.462 to 0.628), with the strongest correlation observed between Tb.Sp and BUN (r = 0.628). These findings suggest that elevated renal function indices (indicating renal function decline) are closely associated with significant decreases in BMD and Tb.N, and a significant increase in Tb.Sp, and an overall deterioration of bone microarchitecture.
Data Availability:
Appropriately de-identified data supporting the findings of this study can be obtained from the corresponding author upon reasonable request, subject to approvals from relevant institutions and compliance with Chinese experimental ethics or legal requirements.
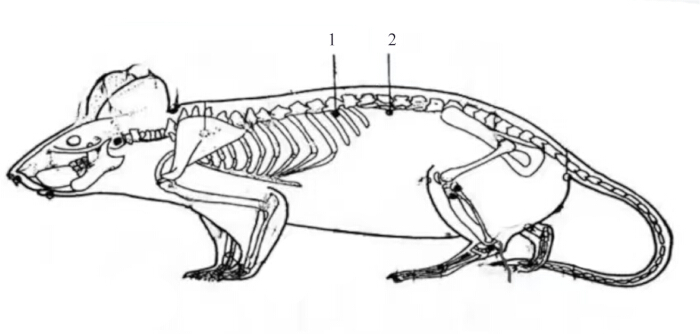
Figure 1: Rat acupoint map. 1 represents the Pishu (BL20), and 2 represents the Shenshu (BL23). Please click here to view a larger version of this figure.
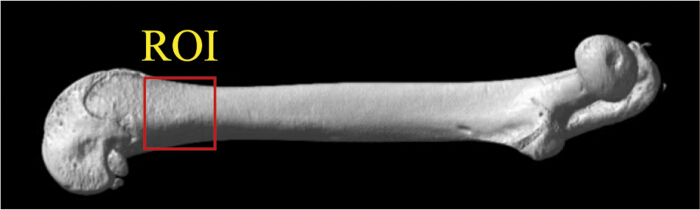
Figure 2: Map of regions of interest for femoral bone mineral density in rats. The region of interest (ROI) is mainly composed of cancellous bone. Please click here to view a larger version of this figure.
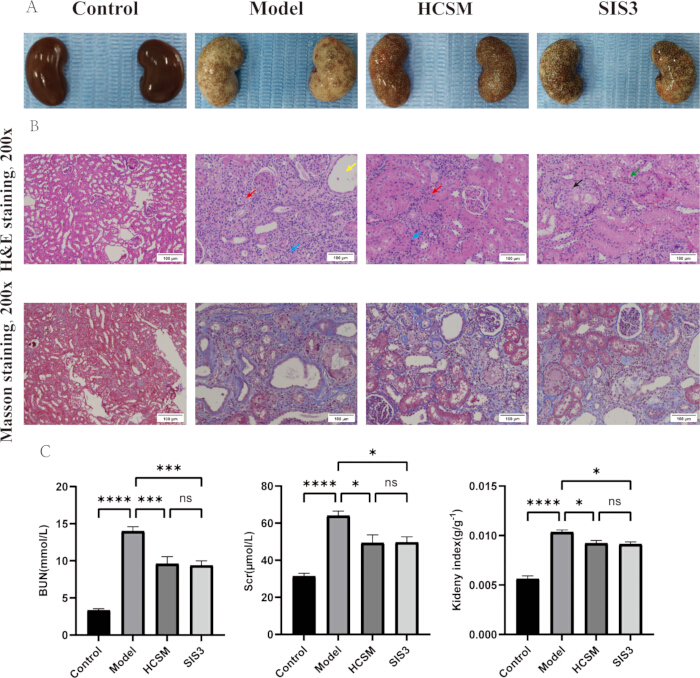
Figure 3: HCSM reverses renal fibrosis and improves kidney function in CKD rats. (A) Appearance of rat kidney. (B) Morphological changes in rat kidneys. (C) Comparison of renal function indicators in rats (n = 6), data are presented as the mean ± SD, and the error bars represent SD. * = p < 0.05, *** = p < 0.001, **** = p < 0.0001. The red arrow in panel B indicates fibrous connective tissue hyperplasia; the yellow arrow indicates renal tubular dilation; the blue arrow indicates granulocyte infiltration; the black arrow indicates multinucleated giant cell infiltration; the green arrow indicates hydropic degeneration of renal tubular epithelial cells. Abbreviations: HCSM = herbal-cake-separated moxibustion; CKD = chronic kidney disease; H&E = hematoxylin and eosin; BUN = blood urea nitrogen; Scr = serum creatinine; SD = standard deviation. SIS3 is a selective Smad3 inhibitor. Please click here to view a larger version of this figure.
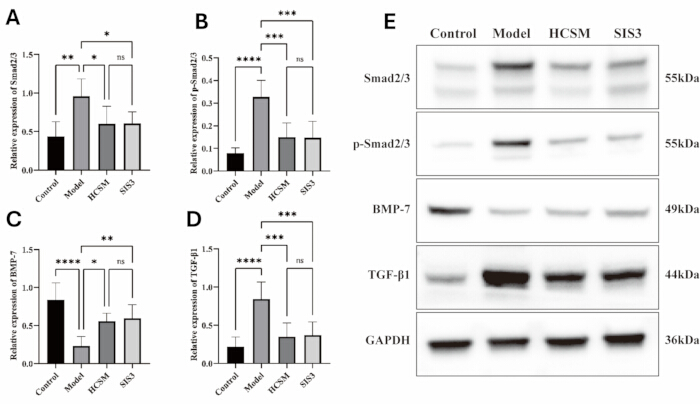
Figure 4: HCSM regulates proteins associated with the TGF-β1/Smad signaling pathway in the kidneys of CKD rats. (A) Relative expression of Smad2/3. (B) Relative expression of p-Smad2/3. (C) Relative expression of BMP-7. (D) Relative expression of TGF-β1. (E) Representative western blot images of Smad2/3, p-Smad2/3, BMP-7, TGF-β1, and GAPDH in the control, model, HCSM, and SIS3 groups. Data are presented as the mean ± SD (n = 3), and error bars represent SD. * = p < 0.05, ** = p < 0.01, *** = p < 0.001, **** = p < 0.0001; ns = not significant. Abbreviations: HCSM = herbal-cake-separated moxibustion; CKD = chronic kidney disease; TGF-β1 = transforming growth factor beta 1; p-Smad2/3 = phosphorylated Smad2/3; BMP-7 = bone morphogenetic protein 7; GAPDH = glyceraldehyde-3-phosphate dehydrogenase; SD = standard deviation. SIS3 is a selective Smad3 inhibitor. Please click here to view a larger version of this figure.
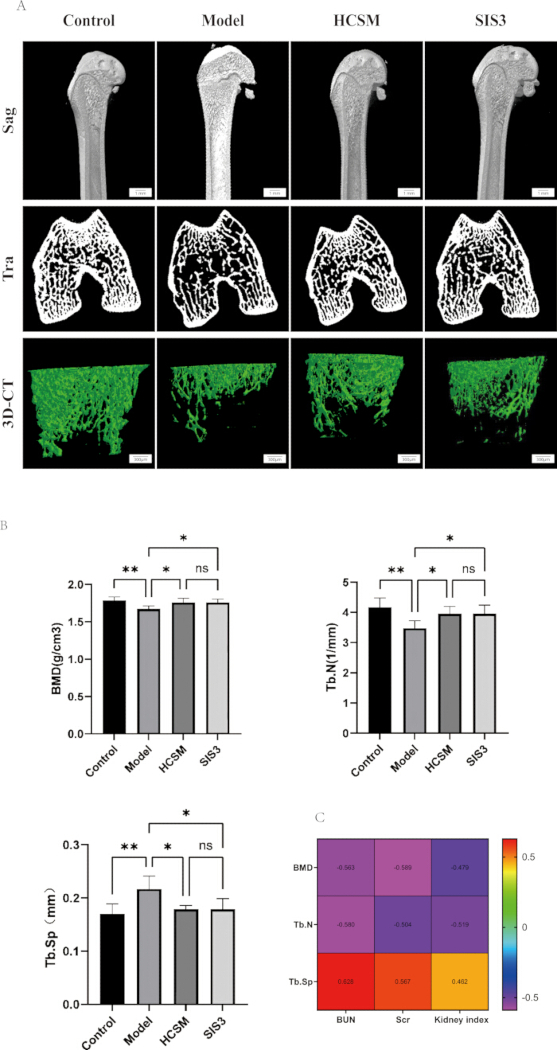
Figure 5: HCSM can reverse bone damage in CKD rats. (A) 3D Micro-CT imaging of the left femur of rats in each group. (B) Comparison of bone microstructure parameters in rats of each group (n = 6), data are presented as the mean ± SD, and the error bars represent SD. (C) Correlation analysis between renal function indicators and bone microstructure parameters in rats [correlation coefficient r (-1~1), the closer the absolute value of r is to 1, the stronger the correlation]. * = p < 0.05, ** = p < 0.01. Abbreviations: HCSM = herbal-cake-separated moxibustion; CKD = chronic kidney disease; Micro-CT = micro-computed tomography; Sag = sagittal; Tra = transverse; 3D-CT = three-dimensional computed tomography; BMD = bone mineral density; Tb.N = trabecular number; Tb.Sp = trabecular separation; BUN = blood urea nitrogen; Scr = serum creatinine; SD = standard deviation. SIS3 is a selective Smad3 inhibitor. Please click here to view a larger version of this figure.
Tartışma
In the present study, using an adenine-induced CKD rat model, we found that HCSM not only effectively improved renal function and alleviated the pathological damage of renal fibrosis but also concomitantly reversed the concurrent decline in BMD and deterioration of bone microarchitecture, demonstrating a synergistic therapeutic effect on CKD and its associated “kidney-bone” comorbidities. Across the assessed parameters, no statistically significant difference was detected between the HCSM and SIS3 groups. These findings validate our hypothesis that HCSM may exert a coordinated therapeutic effect on CKD-associated “kidney-bone” comorbidities by modulating the TGF-β1/Smad signaling pathway.
The potential mechanisms underlying these comprehensive effects likely involve HCSM-mediated regulation of key local signaling pathways in the kidney. The overactivation of the TGF-β1/Smad signaling pathway is the primary driver of renal fibrosis13,14,15,16,17. We demonstrated that HCSM significantly inhibited TGF-β1 expression and the phosphorylation-induced activation of its downstream key signaling molecules, Smad2/3 (p-Smad2/3), in renal tissue, while concurrently upregulating the expression of its endogenous antagonist, BMP-7. BMP-7 not only antagonizes the profibrotic effects of TGF-β118,19,20,21 but is also a pivotal factor in maintaining bone health22,23,24,25. Interestingly, while both HCSM and SIS3 inhibited p-Smad2/3, they also downregulated total Smad2/3 protein levels. Under chronic pathological stimulation, the abnormally high expression of Smad proteins may represent a “pathological adaptation” by cells to sustain excessive signal transduction. The ability of these interventions to reverse this abnormality in tandem suggests that their mechanisms extend beyond mere inhibition of phosphorylation; they may fundamentally restore pathway homeostasis by modulating upstream signals or influencing Smad protein stability. Importantly, the modulatory effects of HCSM on this crucial pathway (TGF-β1, p-Smad2/3, Smad2/3, and BMP-7) were highly similar to those of the targeted Smad3 inhibitor SIS3. This finding has dual significance: first, it strongly supports the premise that the TGF-β1/Smad pathway is a core therapeutic target of HCSM; second, it indicates that this multimodal therapy can achieve intervention effects on key molecular indicators comparable to those of chemical inhibitors. However, this does not imply that their underlying mechanisms are entirely identical. Whereas SIS3 acts as a precise, single-target inhibitor, HCSM likely provides broader, holistic regulation of concurrent pathological processes, such as inflammation and oxidative stress associated with renal fibrosis and bone destruction, through a multi-component, multi-target synergistic approach26,27.
Furthermore, it is noteworthy that the improvements in bone parameters observed in this study are unlikely to be an isolated phenomenon; rather, they likely stem directly from the successful intervention of local renal lesions, mediated via the “kidney-bone axis.” The kidney is a crucial organ for the secretion and regulation of key factors in bone metabolism, including BMP-7. Renal fibrosis leads to insufficient BMP-7 synthesis, which consequently disrupts bone homeostasis28,29,30. By upregulating intrarenal BMP-7 and suppressing excessive TGF-β1 signaling, HCSM may simultaneously restore renal endocrine function and bone metabolic balance. This also provides a modern biological interpretation of the traditional Chinese medicine (TCM) theory that "the Kidney governs the bones and engenders marrow." In this study, Pishu (BL20) and Shenshu (BL23) were selected as acupoints for moxibustion, and herbs that enter the Spleen and Kidney meridians—such as Huangqi (Radix Astragali), Dangshen (Radix Codonopsis), and Shudi (Radix Rehmanniae Praeparata)—were chosen to prepare the herbal cakes. This protocol is specifically designed to address “Spleen and Kidney deficiency,” the core pathogenesis of CKD31. By integrating acupoint stimulation, transdermal drug absorption, and the thermal stimulation of moxibustion, HCSM comprehensively acts to tonify the Spleen and Kidney, replenish the marrow, and strengthen the bones, thereby holistically correcting the internal environmental imbalances underlying CKD and its associated bone disorders.
Admittedly, the present study has certain limitations. Firstly, we established an association among HCSM treatment, pathway inhibition, and phenotypic improvement. Although the positive outcomes underscore the critical role of the TGF-β1/Smad/BMP-7 axis, they do not definitively prove that HCSM's effects are mediated exclusively through this pathway. We did not explore whether alternative pathways closely related to fibrosis and bone metabolism, such as inflammation, oxidative stress, or autophagy, were simultaneously regulated. Secondly, the study lacked direct measurement of bone turnover markers (e.g., PINP and CTX-1) in the blood or bone tissue; thus, direct biochemical evidence for bone formation requires further strengthening. Additionally, the absence of an "HCSM + inhibitor" group precluded the reverse validation of our mechanistic hypothesis. Finally, this study did not include control groups receiving sham moxibustion, heat alone, or medication alone, and the model group did not undergo procedures or restrictions that matched those of the HCSM procedure. Therefore, the study design cannot distinguish the specific effects of the comprehensive HCSM intervention from the non-specific effects of the procedure or restrictions, heat stimulation, or local drug exposure. Future studies should focus on the following directions: (1) utilizing in vivo and in vitro models with gene knockout or specific agonists to directly verify the necessity of this pathway in mediating the effects of HCSM; (2) dynamically monitoring serum BMP-7 levels and bone turnover markers to more precisely delineate the "kidney-bone" signaling cascade; and (3) optimizing the experimental design to include long-term efficacy observations, thereby evaluating whether HCSM can effectively delay the progression of CKD to end-stage renal disease.
Açıklamalar
The authors declared no potential conflicts of interest with respect to the research, authorship, and/or publication of this article.
Author Contributions:
Manli Cui and Ting Yang conceived and designed the experiments. Chaofei Yin and Qinzuo Dong performed the experiments and drafted the manuscript. Menghan Ai, Yuanting Jiang, and Jingyi Ning analyzed the data. Simin Wang and Xiaoyin Yang contributed to data collection. Peidong Huang drafted the study scheme. Dongdong Qin took responsibility for the integrity of the data analysis. Peidong Huang supervised the work. All authors approved the final manuscript. All authors contributed to the article
Teşekkürler
We are grateful to Professor Huang, Miss Cui, and Miss Yang for their strict guidance and support of this paper. This research was supported by : (1) National Natural Science Foundation of China (No. 82160938); (2) Basic Research Program Project of Yunnan Provincial Department of Science and Technology (No.: 202301AZ070001-030); (3) Yunnan Science and Technology Talent and Platform Program (No.: 202405AC350019); (4) Kunming Health Science and Technology Personnel Training Program (No.: 2025-SW-24); (5) Key Project of the Basic Research Program of the Yunnan Provincial Department of Science and Technology(No.202601AZ070001- 018).
Malzemeler
| Ad | Şirket | Katalog numarası | Yorumlar |
|---|---|---|---|
| Adenine | Beijing Boaotuo Technology Co., LTD | A0607 | Molding drug |
| BCA developer | Biyuntian Biological Engineering Co., LTD | P0010 | Determination of protein concentration |
| BMP-7 | Abcam Shanghai Trading Co., LTD | Ab129156 | Western blotting |
| Chinese medicine | Yunnan Yanshoutang Traditional Chinese Medicine Technology Co., LTD | NA | Cure |
| Decolorizing shaker | Haimen City Qilin Medical Instrument Factory | TS-8S | Decolorization |
| ECL luminescent substrate kit | Beijing Lanjieke Biotechnology Co., LTD | BL520B | Convert latent images in exposed film into visible images |
| Electrophoresis apparatus | Bio-Rad | 552BR233193 | Electrophoresis |
| Eosin | Macklin | E809023 | Histopathological analysis |
| Full-wavelength microplate reader | TECAN | Spark | The absorbance and concentration of tissue protein were detected |
| Fully automatic biochemical analyser | Tianjin Micro nano core Technology Co., LTD | PV2112001Z02410305 | Renal function test |
| GAPDH | Abcam Shanghai Trading Co., LTD | Ab181602 | Western blotting |
| Gas anesthesia system | Zhongshi Technology Co., LTD | ZS-MV-1 | Anesthesia |
| Goat anti-rabbit IgG | Abcam Shanghai Trading Co., LTD | Ab6721 | Western blotting |
| Haematoxylin | Servicebio | G1004 | Histopathological analysis |
| High-protein feed | Jiangsu Synergetics Biological Engineering Co., LTD | XT19008 | Feeding |
| Isoflurane | Jiangsu Zhongmu Beikang Pharmaceutical Co., LTD | 20220701 | Anesthesia |
| Liquid nitrogen | Kunming Botai dry ice sales Co., LTD | / | Renal tissue freezing |
| Masson trichrome staining kit | Solarbio | G1340 | Histopathological analysis |
| Micro-CT imaging system | Suzhou Hiscan Information Technology Co., LTD | Hiscan XM | Bone imaging and related parameter analysis |
| Paraformaldehyde | Beijing Lanjieke Biotechnology Co., LTD | BL539A | Fixed tissue |
| Phosphorylated Smad2/3 | Abcam Shanghai Trading Co., LTD | Ab254407 | Western blotting |
| Pulverizer | Hefei Rongzhida small household appliances Co., LTD | RS-FS1401 | Crushed Chinese medicine |
| PVDF membrane | MerckMillipore Corporation | IPVH00010 | Transfer protein |
| Refrigerated centrifuge | Hettich Precision Technology (Zhuhai) Co., LTD | MIKRO 220R | Centrifuge |
| Renal function assay reagent plate | Tianjin Micro nano core Technology Co., LTD | 240450 | Renal function test |
| RIPA lysis buffer | Beijing Solaibao Technology Co., LTD | R0010 | Lytic tissue |
| SIS3 | MedChemExpress | HY-13013 | Inhibitor |
| Smad2/3 | Abcam Shanghai Trading Co., LTD | Ab202445 | Western blotting |
| TGF-β1 | Abcam Shanghai Trading Co., LTD | Ab215715 | Western blotting |
| Upright microscope | Carl Zeiss Suzhou Co.,LTD | 5446000456 | Capture picture |
Kaynaklar
- Kalantar-Zadeh K et al. Chronic kidney disease. Lancet. 2021;398:786-802.
- Humphreys BD. Mechanisms of renal fibrosis. Annu Rev Physiol. 2018;80:309-26.
- Ruiz-Ortega M et al. Targeting the progression of chronic kidney disease. Nat Rev Nephrol. 2020;16:269-88.
- Zhou Y et al. Using herbal-cake-separated moxibustion for the treatment of rats with chronic renal failure. J Vis Exp. 2023;(202):e65783.
- Yang S et al. SIRT2 alleviated renal fibrosis by deacetylating SMAD2 and SMAD3 in renal tubular epithelial cells. Cell Death Dis. 2023;14:646.
- Yu XY et al. TGF-β/Smad signaling pathway in tubulointerstitial fibrosis. Front Pharmacol. 2022;13:860588.
- Bhadange R, Dagar N, Gaikwad AB. Levosimendan mitigates renal fibrosis via TGF-β1/Smad axis modulation in UUO rats. Biomed Pharmacother. 2025;187:118124.
- Xu X et al. Transforming growth factor-β in stem cells and tissue homeostasis. Bone Res. 2018;6:2.
- Song IW et al. Targeting TGF-β for treatment of osteogenesis imperfecta. J Clin Invest. 2022;132(7):e152571.
- Saito H et al. Analysis of bone in adenine-induced chronic kidney disease model rats. Osteoporos Sarcopenia. 2021;7:121-6.
- Diwan V, Brown L, Gobe GC. Adenine-induced chronic kidney disease in rats. Nephrology (Carlton). 2018;23:5-11.
- Xu DS et al. A new attempt of re-mapping acupoint atlas in the rat. Zhen Ci Yan Jiu. 2019;44(1):62-5.
- Lim JH et al. Paricalcitol improves hypoxia-induced and TGF-β1-induced injury in kidney pericytes. Int J Mol Sci. 2021;22(18):9751.
- Zhang Y et al. Signaling pathways involved in diabetic renal fibrosis. Front Cell Dev Biol. 2021;9:696542.
- Meng XM, Nikolic-Paterson DJ, Lan HY. TGF-β: the master regulator of fibrosis. Nat Rev Nephrol. 2016;12:325-38.
- Sun Z et al. miR-133b and miR-199b knockdown attenuate TGF-β1-induced epithelial to mesenchymal transition and renal fibrosis by targeting SIRT1 in diabetic nephropathy. Eur J Pharmacol. 2018;837:96-104.
- Gu YY et al. TGF-β in renal fibrosis: triumphs and challenges. Future Med Chem. 2020;12:853-66.
- Song Y et al. Overexpression of BMP-7 reverses TGF-β1-induced epithelial-mesenchymal transition by attenuating the Wnt3/β-catenin and TGF-β1/Smad2/3 signaling pathways in HK-2 cells. Mol Med Rep. 2020;21:833-41.
- Higgins DF et al. BMP7-induced-Pten inhibits Akt and prevents renal fibrosis. Biochim Biophys Acta Mol Basis Dis. 2017;1863:3095-104.
- Alyaseer AAA, De Lima MHS, Braga TT. The role of NLRP3 inflammasome activation in the epithelial to mesenchymal transition process during the fibrosis. Front Immunol. 2020;11:883.
- Meng XM, Chung AC, Lan HY. Role of the TGF-β/BMP-7/Smad pathways in renal diseases. Clin Sci (Lond). 2013;124:243-54.
- Shen B et al. The role of BMP-7 in chondrogenic and osteogenic differentiation of human bone marrow multipotent mesenchymal stromal cells in vitro. J Cell Biochem. 2010;109:406-16.
- Kim HK et al. Bone-forming peptide-2 derived from BMP-7 enhances osteoblast differentiation from multipotent bone marrow stromal cells and bone formation. Exp Mol Med. 2017;49(5):e328.
- van der Heide D et al. Implementing BMP-7 chemically modified RNA for bone regeneration with 3D printable hyaluronic acid-collagen granular gels. Adv Healthc Mater. 2025;14(19):e2405047.
- Chen F et al. Bone morphogenetic protein 7 enhances the osteogenic differentiation of human dermal-derived CD105+ fibroblast cells through the Smad and MAPK pathways. Int J Mol Med. 2019;43:37-46.
- Zhao Q et al. Natural products in traditional Chinese medicine for renal fibrosis: a comprehensive review. Front Pharmacol. 2025;16:1560567.
- Wang SY et al. Herbal cake-partitioned moxibustion inhibits colonic autophagy in Crohn’s disease via signaling involving distinct classes of phosphatidylinositol 3-kinases. World J Gastroenterol. 2020;26(39):5997-6014.
- Boon MR et al. Bone morphogenetic protein 7: a broad-spectrum growth factor with multiple target therapeutic potency. Cytokine Growth Factor Rev. 2011;22(4):221-9.
- Papanagiotou M, Malizos KN, Vlychou M, Dailiana ZH. Autologous (non-vascularised) fibular grafting with recombinant bone morphogenetic protein-7 for the treatment of femoral head osteonecrosis: preliminary report. Bone Joint J. 2014;96-B(1):31-5.
- Wei K, Yin Z, Xie Y. Roles of the kidney in the formation, remodeling and repair of bone. J Nephrol. 2016;29(3):349-57.
- Wang Y et al. Traditional Chinese medicine in the treatment of chronic kidney diseases: theories, applications, and mechanisms. Front Pharmacol. 2022;13:917975.