This retrospective study evaluates pelvic ultrasonography as an adjunct to clinical and hormonal assessment in girls with suspected idiopathic central precocious puberty. Uterine and ovarian measurements differed between groups, and a four-variable model retained discrimination in a later same-center cohort; neither ultrasound thresholds nor the model should replace endocrine evaluation.
Araştırma makalesi
Pelvic Ultrasonography for Idiopathic Central Precocious Puberty in Girls: A Retrospective Diagnostic and Temporal Validation Study
Bu makalede
Özet
Özet
Idiopathic central precocious puberty (ICPP) and premature thelarche (PT) may initially present with similar breast development. We evaluated pelvic ultrasonography as an adjunctive discriminator and reassessed a multivariable prediction model. This retrospective, single-center study included a development cohort of 175 girls evaluated from August 2022 to December 2024 (90 ICPP and 85 PT) and a temporal validation cohort of 90 girls evaluated from January to December 2025 (48 ICPP and 42 PT). Diagnostic classification was based on clinical assessment and the gonadotropin-releasing hormone stimulation test. Distribution-appropriate group tests were used, with Holm adjustment within prespecified families. In the development cohort, all uterine and ovarian measurements differed between groups after adjustment (all adjusted P<0.001). Uterine transverse diameter (UTD) and uterine volume (UV) had areas under the receiver operating characteristic curve (AUCs) of 0.830 and 0.829, respectively. At the Youden-derived UTD cutoff of 18.5–19.0 mm, sensitivity was 73.3%, and specificity was 78.8%. A model combining UTD and UV had an apparent AUC of 0.913 and a 10-fold cross-validated AUC of 0.910. The final logistic model included height, bone age, UV, and ovarian volume; its apparent development-cohort AUC was 0.951, and its bootstrap optimism-corrected AUC was 0.944. Applied without coefficient updating to the temporal cohort, the model yielded an AUC of 0.914, a Brier score of 0.121, a calibration intercept of 0.699, and a calibration slope of 0.754. Pelvic ultrasonography can complement, but not replace, auxologic, hormonal, and stimulation-test assessment. The thresholds and model require prospective multicenter external validation before clinical deployment.
Giriş
Precocious puberty is characterized by the early onset of secondary sexual characteristics and may be classified as central, peripheral, or incomplete based on the activation of the hypothalamic-pituitary-gonadal axis1,2,3. In girls, idiopathic central precocious puberty (ICPP) is a common form of central precocious puberty, whereas isolated premature thelarche (PT) is an incomplete variant. The two conditions can initially appear similar, but progressive ICPP may be accompanied by accelerated linear growth, advanced bone age, and loss of adult-height potential4,5,6,7,8,9.
Diagnosis should integrate the tempo of pubertal progression, growth velocity, bone age, basal ultrasensitive luteinizing hormone (LH), and, when needed, a gonadotropin-releasing hormone (GnRH) stimulation test10,11,12. Pelvic ultrasonography is noninvasive and can document estrogen-responsive uterine and ovarian maturation, but published cutoffs vary widely and overlap between diagnostic groups13,14. The literature therefore supports pelvic ultrasonography as an auxiliary test rather than a stand-alone replacement for endocrine evaluation. Song et al.15 developed a model for progressive versus nonprogressive central precocious puberty, a clinically related but not identical contrast to ICPP versus PT; direct comparison with the present study should therefore be approached with caution.
We hypothesized that uterine and ovarian measurements would differ between girls classified as ICPP and PT and that combining clinical and ultrasonographic features would improve adjunctive discrimination. We aimed to quantify parameter-specific diagnostic performance, provide scenario-specific thresholds for screening and confirmation, develop a parsimonious logistic model, and assess that model in a later same-center cohort. We did not prespecify pelvic ultrasonography as a replacement for standard diagnostic assessment.
Protokol
The study was approved by the Ethics Committee of the First Affiliated Hospital of Army Medical University, PLA (approval no. (B) KY2026129; approval date, April 23, 2025). The committee approved a waiver of informed consent. The study complied with institutional requirements and the Declaration of Helsinki. Records of girls evaluated for early breast development at the First Hospital Affiliated to Army Medical University from August 2022 to December 2024 were assigned to the development cohort (175 girls: 90 ICPP and 85 PT). Records of girls evaluated with the same clinical pathway from January to December 2025 were assigned to the temporal validation cohort (90 girls: 48 ICPP and 42 PT); they were not used during model development or coefficient estimation.
Study design, ethics, and participant flow
Consecutive records of girls evaluated for early breast development were identified and assigned to the development cohort. Girls evaluated later with the same clinical pathway were assigned to the temporal validation cohort and were not used during model development or coefficient estimation.
Eligibility, diagnostic classification, and recorded variables
Girls aged 5–10 years with initial-onset breast development, complete clinical records, and a final diagnosis of ICPP or PT were included. The final diagnosis of ICPP or PT was made according to contemporary Chinese consensus criteria and the institutional endocrine pathway11. Girls with peripheral reproductive-organ disease, diabetes or thyroid dysfunction, recent medication affecting the hypothalamic-pituitary-gonadal axis, pelvic disease, gonadal tumor, luteoma, follicular cyst, central nervous system infection, or a known intracranial lesion that explained pubertal activation were excluded.
Chronological age, standing height, body weight, body mass index (BMI), Tanner breast stage, and bone age were recorded. BMI was calculated as weight (kg)/height (m)2. Bone age was assessed using a posteroanterior radiograph of the left hand and wrist according to the Greulich–Pyle atlas. Two experienced physicians, each with more than 5 years of experience in pediatric bone-age assessment, independently evaluated the radiographs while blinded to the pelvic ultrasonography and hormone-test results. Disagreements were resolved by consensus.
ICPP versus PT was classified using the integrated clinical assessment and GnRH stimulation test. A stimulated LH peak ≥ 5.0 IU/L together with a peak LH/FSH ratio ≥ 0.6 supported central activation. Results were interpreted in conjunction with pubertal progression, growth, bone age, and basal hormones rather than as an isolated ultrasound-defined diagnosis10,11,12.
GnRH stimulation test and hormone assays
The GnRH stimulation test was performed between 08:00 and 09:00 after an overnight fast. Venous blood was collected in serum collection tubes. A baseline sample was obtained, gonadorelin acetate was administered intravenously at 2.5 µg/kg (maximum 100 µg), and additional samples were obtained at 30, 60, and 90 min. Venous blood samples were allowed to clot for 30 min at room temperature and were centrifuged at 1,500 × g for 10 min at 4 °C. Serum was separated immediately and analyzed within 2 h; samples requiring delayed analysis were stored at −80 °C until testing.
Serum LH, follicle-stimulating hormone (FSH), and estradiol (E2) were measured by electrochemiluminescence. Analytical sensitivity, measuring ranges, and intra- and inter-assay coefficients of variation were determined in accordance with the manufacturer's specifications and routine laboratory quality-control records. LH/FSH was calculated at each poststimulation time point, and peak stimulated values were retained for classification.
Pelvic ultrasonography
Pelvic ultrasonography was performed using a diagnostic ultrasound system with a curved-array transducer (nominal frequency range, 2.5–7.0 MHz). Each child was asked to achieve a comfortably full bladder and was positioned supine. Imaging depth, overall gain, time-gain compensation, focus, and dynamic range were optimized for each child so that the uterus and adnexa filled the field without clipping. System-calibrated electronic calipers were used for all physical measurements.
In a mid-sagittal uterine view, uterine longitudinal diameter (ULD) was measured along the longest fundus-to-cervix axis, and uterine anteroposterior diameter (UAD) was measured perpendicular to it. In a transverse view, the uterine transverse diameter (UTD) was measured at the widest point. Uterine volume (UV) was calculated as UTD × ULD × UAD × 0.523.
For each ovary, orthogonal planes were obtained, and the maximum longitudinal diameter (OLD), transverse diameter (OTD), and anteroposterior diameter (OAD) were measured. Each ovarian volume was calculated as OTD × OLD × OAD × 0.523, and the mean of the left and right ovarian measurements was used for OTD, OLD, OAD, and ovarian volume (OV). Maximum follicular diameter (MFD) was recorded as the largest follicle in either ovary; 0 mm was recorded when no follicle was visualized (see Figure 1).
All examinations were performed by two experienced sonographers, each with more than 5 years of experience in pediatric and pelvic ultrasonography, while blinded to the final clinical diagnosis and GnRH stimulation-test results. Each measurement was performed twice, and the mean value was used for analysis. Images with incomplete visualization of the uterus or ovaries, substantial motion artifacts, unclear anatomical boundaries, or inadequate orthogonal planes were excluded. Examinations were included only if they met the predefined image-quality criteria.
Statistical analysis and model development
Two-sided tests were used, with a significance threshold of P < 0.05. Continuous-variable distributions in each diagnostic group were assessed using the Shapiro-Wilk test. Approximately normal variables were presented as mean ± SD and compared using Welch's t test; nonnormal variables were presented as median (Q1, Q3) and compared using the Mann-Whitney U test. Categorical variables were presented as n (%) and compared using the chi-square test.
Multiplicity was controlled with the Holm procedure within three prespecified families: general/auxologic variables, pelvic ultrasound variables, and hormones. Both the analysis method and Holm-adjusted P values were reported.
Receiver operating characteristic (ROC) curves and AUCs were estimated for individual ultrasound parameters. The Youden-derived threshold and two clinically oriented alternatives were reported: a screening threshold chosen to achieve at least 90% sensitivity where possible, and a confirmation-oriented threshold chosen to achieve at least 90% specificity. All thresholds were treated as exploratory and cohort-specific.
A combined UTD + UV logistic model was fitted, the apparent AUC was reported, and stratified 10-fold cross-validation (random seed 20260902) was used for an internal discrimination estimate. Univariate logistic regressions were fitted for all candidate clinical, ultrasound, and hormone variables, including Tanner stage. The multivariable logistic model was developed using forward likelihood-ratio selection from significant univariate candidates while avoiding redundant dimensions and derived volumes in the same candidate block. Coefficients, standard errors, odds ratios, 95% confidence intervals, and variance inflation factors (VIFs) were reported.
Optimism in model discrimination was quantified with 1,000 bootstrap resamples (random seed 20260902). As a sensitivity analysis, an L1-penalized logistic model with standardized predictors and 10-fold cross-validation was fitted. This analysis was interpreted as a stability check rather than as a new confirmatory model because predictor selection and assessment were performed within the same development data. The primary analyses were conducted using SPSS 25.0 and R 4.3.2, and the sensitivity analyses were performed in Python 3 using SciPy, statsmodels, and scikit-learn. The variables included in the analyses had no missing values; therefore, no imputation was performed.
Temporal validation
The unchanged development-cohort regression equation was applied to the January–December 2025 cohort. Coefficients were not refitted, and variables were not reselected. Validation AUC, Brier score, calibration intercept and slope, and a five-bin calibration plot were reported. This constituted temporal validation at the same institution, not independent external validation.
Sonuçlar
The development cohort included 175 consecutive girls: 90 with ICPP and 85 with PT. The later temporal cohort included 90 girls: 48 with ICPP and 42 with PT. The development groups did not differ significantly in chronological age, BMI, or Tanner breast stage. Height, weight, and bone age were higher in the ICPP group after Holm adjustment (adjusted P = 0.013, <0.001, and <0.001, respectively; Table 1).
GnRH stimulation test and hormone assays
LH, FSH, LH/FSH, and E2 were non-normally distributed. All four were higher in the ICPP group after Holm adjustment, including E2 (adjusted P = 0.007; Table 2). These variables were analyzed as continuous correlates and were not interpreted as independent substitutes for the prespecified diagnostic classification.
Pelvic ultrasonography
All uterine measurements were higher in the ICPP group (Figure 2). Median UTD was 22.50 mm (Q1, Q3: 18.00, 32.75) versus 16.00 mm (13.00, 18.00), while mean ULD, UAD, and UV were 26.64 ± 3.52 mm, 10.78 ± 2.46 mm, and 2.13 ± 0.51 cm3 versus 23.40 ± 3.18 mm, 9.06 ± 2.24 mm, and 1.53 ± 0.38 cm3, respectively. All Holm-adjusted P values were <0.001.
All ovarian measurements were also higher in the ICPP group (Figure 3). Mean OAD and OV were 12.94 ± 3.20 mm and 1.74 ± 0.49 cm3 versus 9.94 ±2.25 mm and 1.34 ± 0.42 cm3, respectively. Median OTD, OLD, and MFD were 13.25 mm (11.13, 15.88), 23.50 mm (20.00, 27.38), and 6.90 mm (6.00, 8.68) versus 11.53 mm (10.16, 12.74), 19.78 mm (17.67, 21.65), and 5.00 mm (4.00, 7.00). All Holm-adjusted P values were <0.001.
Statistical analysis and model development
Individual ultrasound AUCs ranged from 0.701 to 0.830 (Table 3 and Figure 4). UTD had the highest uterine AUC (0.830; 95% CI, 0.770–0.889). Because UTD was recorded in integer millimeters, the Youden threshold of 19.0 mm is equivalent to a boundary of 18.5 mm. At 18.5–19.0 mm, sensitivity was 73.3%, and specificity was 78.8%. UV had an AUC of 0.829 (95% CI, 0.769–0.889), with 65.6% sensitivity and 89.4% specificity at 1.95 cm3. OAD had the highest ovarian AUC (0.769; 95% CI, 0.700–0.838). Screening- and confirmation-oriented alternatives in Table 3 demonstrate the expected sensitivity-specificity tradeoff and should not be treated as universal clinical cutoffs.
The combined UTD+UV model had an apparent AUC of 0.913 and a stratified 10-fold cross-validated AUC of 0.910. At predicted-probability thresholds of 0.295, 0.604, and 0.572, the screening, Youden, and confirmation-oriented operating points yielded sensitivity/specificity pairs of 90.0%/69.4%, 77.8%/91.8%, and 78.9%/90.6%, respectively. The order of the probability thresholds reflects discrete empirical ROC points and should be interpreted in terms of their achieved operating characteristics, not as ordered clinical rules.
Univariate associations are reported for all candidate variables in Table 4. Tanner stage II-III versus I was not associated with ICPP (OR = 0.786; 95% CI, 0.428–1.443; P = 0.436). In the final model, height, bone age, UV, and OV remained independently associated with ICPP (Table 5). A 1-year increase in bone age corresponded to an OR of 3.762 (95% CI, 2.245–6.306).
The fitted logit was -33.1968 + 0.09598 × height (cm) + 1.32505 × bone age (years) + 3.25448 × UV (cm3) + 1.96808 × OV (cm3). VIFs ranged from 1.018 to 1.196, providing no evidence of problematic collinearity among the four retained predictors. The apparent development-cohort AUC was 0.951; bootstrap-estimated optimism was 0.0069, giving an optimism-corrected AUC of 0.944 (Figure 5). The L1-penalized sensitivity analysis selected age, bone age, UTD, ULD, UAD, UV, OAD, and OV (Table 6).
Temporal validation
The temporal cohort was comparable to the development cohort for height, bone age, UV, OV, and diagnostic distribution (all P > 0.16; Table 7). The diagnostic distribution was 48/90 (53.33%) ICPP and 42/90 (46.67%) PT. When the unchanged equation was applied to the temporal cohort, the AUC was 0.914. The Brier score was 0.121, the calibration intercept was 0.699, and the calibration slope was 0.754 (Figure 6). These estimates suggest useful same-center temporal discrimination but some overfitting/miscalibration, consistent with a need for independent multicenter testing.
In summary, pelvic ultrasound parameters differed between ICPP and PT; UTD and UV provided the strongest individual uterine discrimination, and the four-variable model retained discrimination over time at the same center. The findings support adjunctive use and hypothesis generation, not stand-alone diagnosis or immediate clinical deployment.
DATA AVAILABILITY:
The deidentified dataset and figure-source files used for this study are publicly available in Zenodo at https://doi.org/10.5281/zenodo.21386878.
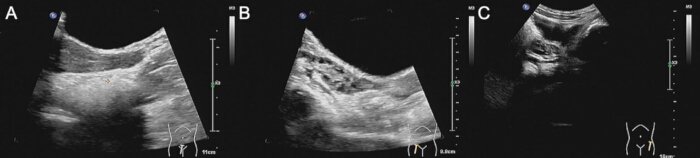
Figure 1: Representative pelvic ultrasound images from one 9-year-old girl classified as ICPP. (A) Mid-sagittal uterine view. (B) Longitudinal right-ovarian view. (C) Bilateral transverse ovarian views. Measurements were obtained with system-calibrated electronic calipers. No generative or structure-altering image processing was applied. Please click here to view a larger version of this figure.
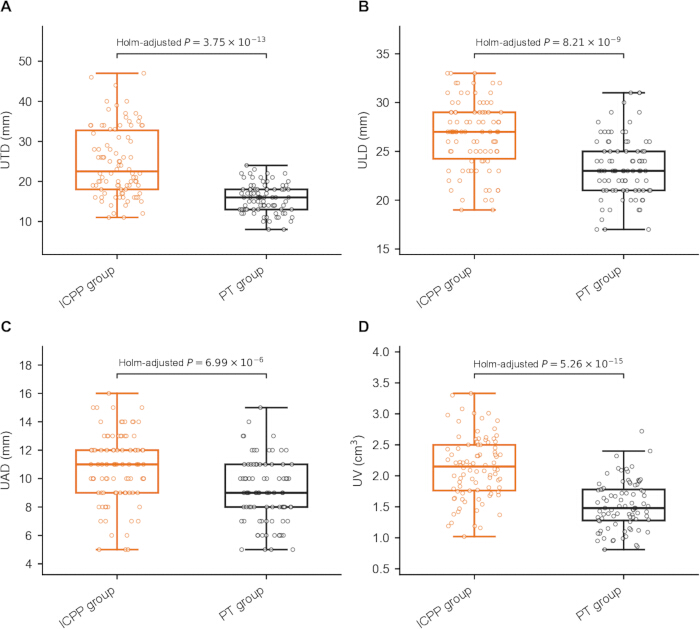
Figure 2: Uterine measurements in the development cohort (ICPP, n = 90; PT, n = 85). (A) UTD. (B) ULD. (C) UAD. (D) UV. Boxes show the median and interquartile range; whiskers extend to 1.5 times the interquartile range; points are individual observations. Group comparisons used the Mann-Whitney U test for UTD and Welch's t test for ULD, UAD, and UV. Exact Holm-adjusted P values are shown in the panels. Abbreviations: ICPP = idiopathic central precocious puberty; PT = premature thelarche; UTD = uterine transverse diameter; ULD = uterine longitudinal diameter; UAD = uterine anteroposterior diameter; UV = uterine volume. Please click here to view a larger version of this figure.
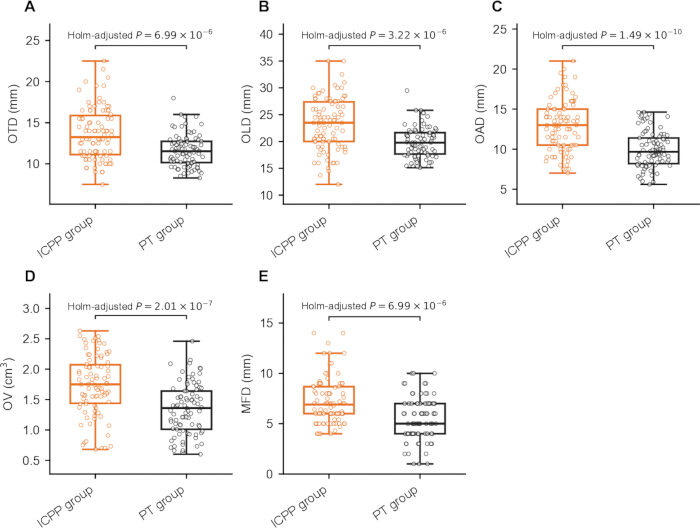
Figure 3: Ovarian measurements in the development cohort (ICPP, n = 90; PT, n = 85). (A) OTD. (B) OLD. (C) OAD. (D) OV. (E) MFD. Boxes show the median and interquartile range; whiskers extend to 1.5 times the interquartile range; points are individual observations. Group comparisons used the Mann-Whitney U test for OTD, OLD, and MFD, and Welch's t test for OAD and OV. Exact Holm-adjusted P values are shown in the panels. Abbreviations: OTD = ovarian transverse diameter; OLD = ovarian longitudinal diameter; OAD = ovarian anteroposterior diameter; OV = ovarian volume; MFD = maximum follicular diameter. Please click here to view a larger version of this figure.
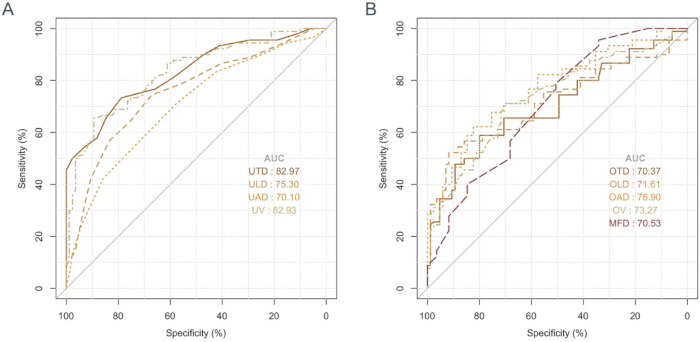
Figure 4: Receiver operating characteristic curves for individual uterine and ovarian ultrasound parameters in the development cohort. (A) Uterine and (B) ovarian ultrasound parameters. Abbreviations: AUC = area under the curve; ICPP = idiopathic central precocious puberty; PT = premature thelarche; UTD = uterine transverse diameter; ULD = uterine longitudinal diameter; UAD = uterine anteroposterior diameter; UV = uterine volume; OTD = ovarian transverse diameter; OLD = ovarian longitudinal diameter; OAD = ovarian anteroposterior diameter; OV = ovarian volume; MFD = maximum follicular diameter. Please click here to view a larger version of this figure.
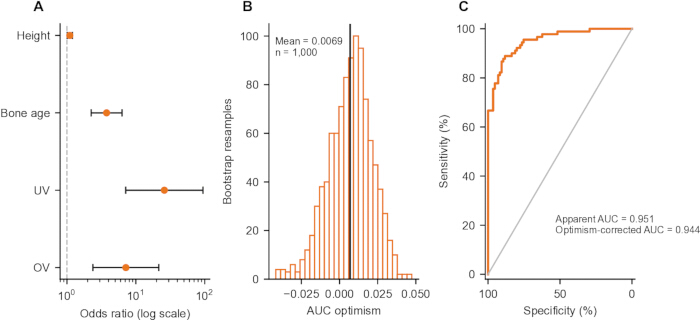
Figure 5: Development-cohort model and internal validation (n = 175). (A) Odds ratios and 95% confidence intervals for height, bone age, UV, and OV. (B) Distribution of AUC optimism across 1,000 bootstrap resamples; the vertical line shows mean optimism (0.0069). (C) Development-cohort ROC curve. The apparent AUC was 0.951, and the optimism-corrected AUC was 0.944. Abbreviations: AUC = area under the curve; UAD = uterine anteroposterior diameter; UV = uterine volume; OV = ovarian volume. Please click here to view a larger version of this figure.
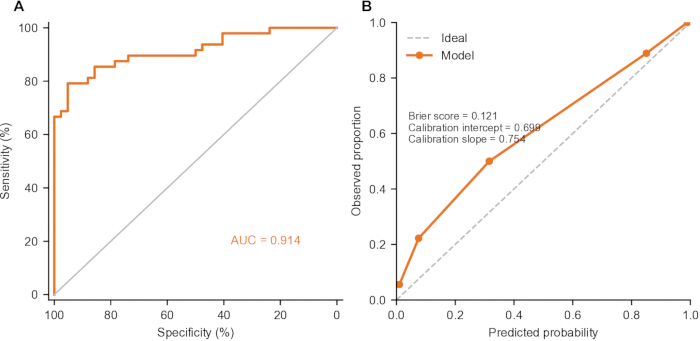
Figure 6: Temporal validation of the unchanged development-cohort equation. (A) ROC curve (AUC = 0.914). (B) Five-bin calibration plot; Brier score = 0.121, calibration intercept = 0.699, and calibration slope = 0.754. The diagonal line denotes ideal calibration. n = 90. Please click here to view a larger version of this figure.
| Variable | ICPP (n=90) | PT (n=85) | Test | Holm-adjusted P |
| Age (years) | 8.00 (7.00, 9.00) | 8.00 (7.00, 9.00) | Mann-Whitney U | 0.328 |
| Height (cm) | 126.10 ±- 5.85 | 123.52 ± 6.00 | Welch t | 0.013 |
| Weight (kg) | 24.00 (22.00, 26.00) | 22.00 (20.00, 24.00) | Mann-Whitney U | 4.64 x 10⁻⁴ |
| BMI (kg/m2) | 15.40 (13.82, 16.68) | 14.30 (13.10, 16.30) | Mann-Whitney U | 0.328 |
| Tanner stage I | 38 (42.22) | 31 (36.47) | Chi-square | 0.436 |
| Tanner stage II-III | 52 (57.78) | 54 (63.53) | ||
| Bone age (years) | 10.42 (9.42, 11.40) | 8.50 (7.40, 9.30) | Mann-Whitney U | 5.98 x 10⁻¹⁵ |
Table 1: Development-cohort demographic and auxologic characteristics. Values are mean ± SD, median (Q1, Q3), or n (%). Holm-adjusted P values are reported within the general/auxologic family.
| Variable | ICPP (n=90) | PT (n=85) | Test | Holm-adjusted P |
| LH (IU/L) | 2.93 (0.66, 5.83) | 0.88 (0.59, 1.11) | Mann-Whitney U | 5.41 x 10⁻⁷ |
| FSH (IU/L) | 5.40 (3.74, 6.87) | 3.43 (2.69, 4.09) | Mann-Whitney U | 9.27 x 10⁻⁹ |
| LH/FSH | 0.50 (0.25, 0.93) | 0.25 (0.18, 0.35) | Mann-Whitney U | 3.48 x 10⁻⁶ |
| E2 (pg/mL) | 32.40 (13.31, 52.20) | 22.91 (17.86, 27.66) | Mann-Whitney U | 0.00674 |
Table 2: Development-cohort basal sex-hormone concentrations. Values are median (Q1, Q3). Mann-Whitney U tests and Holm-adjusted P values are reported within the hormone family.
| Variable | AUC (95% CI) | Scenario | Cutoff | Sensitivity | Specificity | Accuracy |
| UTD (mm) | 0.830 (0.770-0.889) | Youden | 18.5-19.0 | 73.30% | 78.80% | 76.00% |
| Screening | 16 | 90.00% | 47.10% | 69.10% | ||
| Confirmation | 22 | 54.40% | 92.90% | 73.10% | ||
| ULD (mm) | 0.753 (0.681-0.825) | Youden | 25 | 74.40% | 67.10% | 70.90% |
| Screening | 21 | 94.40% | 16.50% | 56.60% | ||
| Confirmation | 28 | 42.20% | 90.60% | 65.70% | ||
| UAD (mm) | 0.701 (0.624-0.778) | Youden | 10 | 71.10% | 57.60% | 64.60% |
| Screening | 8 | 90.00% | 24.70% | 58.30% | ||
| Confirmation | 13 | 24.40% | 94.10% | 58.30% | ||
| UV (cm3) | 0.829 (0.769-0.889) | Youden | 1.95 | 65.60% | 89.40% | 77.10% |
| Screening | 1.47 | 90.00% | 48.20% | 69.70% | ||
| Confirmation | 2.07 | 56.70% | 90.60% | 73.10% | ||
| OTD (mm) | 0.704 (0.627-0.781) | Youden | 13 | 58.90% | 80.00% | 69.10% |
| Screening | 10 | 92.20% | 22.40% | 58.30% | ||
| Confirmation | 14.5 | 37.80% | 90.60% | 63.40% | ||
| OLD (mm) | 0.716 (0.639-0.793) | Youden | 23.5 | 52.20% | 91.80% | 71.40% |
| Screening | 16.5 | 90.00% | 11.80% | 52.00% | ||
| Confirmation | 23.5 | 52.20% | 91.80% | 71.40% | ||
| OAD (mm) | 0.769 (0.700-0.838) | Youden | 12 | 62.20% | 82.40% | 72.00% |
| Screening | 9 | 91.10% | 35.30% | 64.00% | ||
| Confirmation | 13.5 | 46.70% | 90.60% | 68.00% | ||
| OV (cm3) | 0.733 (0.659-0.807) | Youden | 1.55 | 71.10% | 69.40% | 70.30% |
| Screening | 1.08 | 90.00% | 28.20% | 60.00% | ||
| Confirmation | 1.97 | 34.40% | 92.90% | 62.90% | ||
| MFD (mm) | 0.705 (0.629-0.781) | Youden | 4.3 | 95.60% | 34.10% | 65.70% |
| Screening | 5 | 93.30% | 34.10% | 64.60% | ||
| Confirmation | 8.2 | 27.80% | 91.80% | 58.90% |
Table 3: Parameter-specific ROC performance and exploratory scenario-specific operating points. Youden cutoffs maximize Youden's J in this cohort; screening and confirmation cutoffs were chosen to target sensitivity or specificity of at least 90% where possible. They are not validated clinical decision thresholds.
| Variable | B | SE | Wald | P | OR | 95% CI |
| Age (year) | 0.154 | 0.117 | 1.735 | 0.188 | 1.167 | 0.928-1.467 |
| Height (cm) | 0.074 | 0.027 | 7.699 | 0.006 | 1.077 | 1.022-1.135 |
| Weight (kg) | 0.228 | 0.06 | 14.492 | <0.001 | 1.256 | 1.117-1.413 |
| BMI (kg/m2) | 0.083 | 0.068 | 1.514 | 0.219 | 1.087 | 0.952-1.241 |
| Tanner II-III vs I | -0.241 | 0.31 | 0.605 | 0.436 | 0.786 | 0.428-1.443 |
| Bone age (year) | 1.179 | 0.185 | 40.76 | <0.001 | 3.251 | 2.264-4.669 |
| UTD (mm) | 0.269 | 0.046 | 33.707 | <0.001 | 1.308 | 1.195-1.432 |
| ULD (mm) | 0.279 | 0.052 | 28.333 | <0.001 | 1.322 | 1.193-1.466 |
| UAD (mm) | 0.307 | 0.071 | 18.751 | <0.001 | 1.36 | 1.183-1.563 |
| UV (cm3) | 2.994 | 0.474 | 39.926 | <0.001 | 19.962 | 7.887-50.524 |
| OTD (mm) | 0.319 | 0.07 | 20.897 | <0.001 | 1.376 | 1.200-1.578 |
| OLD (mm) | 0.214 | 0.045 | 22.886 | <0.001 | 1.239 | 1.135-1.353 |
| OAD (mm) | 0.394 | 0.069 | 32.157 | <0.001 | 1.482 | 1.294-1.698 |
| OV (cm3) | 1.838 | 0.373 | 24.29 | <0.001 | 6.281 | 3.025-13.045 |
| MFD (mm) | 0.395 | 0.087 | 20.731 | <0.001 | 1.485 | 1.253-1.760 |
| LH (IU/L) | 1.02 | 0.209 | 23.866 | <0.001 | 2.772 | 1.842-4.174 |
| FSH (IU/L) | 0.642 | 0.119 | 29.043 | <0.001 | 1.9 | 1.504-2.399 |
| LH/FSH | 3.459 | 0.732 | 22.326 | <0.001 | 31.769 | 7.568-133.367 |
| E2 (pg/mL) | 0.045 | 0.011 | 16.387 | <0.001 | 1.046 | 1.024-1.070 |
Table 4: Univariate logistic regression for ICPP. Tanner II-III is compared with Tanner I. Abbreviations: OR = odds ratio; CI = confidence interval.
| Variable | B | SE | Wald | P | OR | 95% CI | VIF |
| Height (cm) | 0.09598 | 0.04398 | 4.763 | 0.029 | 1.101 | 1.010-1.200 | 1.018 |
| Bone age (year) | 1.32505 | 0.26351 | 25.286 | <0.001 | 3.762 | 2.245-6.306 | 1.171 |
| UV (cm3) | 3.25448 | 0.65918 | 24.375 | <0.001 | 25.906 | 7.117-94.300 | 1.196 |
| OV (cm3) | 1.96808 | 0.56166 | 12.278 | <0.001 | 7.157 | 2.380-21.519 | 1.09 |
Table 5: Final multivariable logistic regression for ICPP. Abbreviation: VIF = variance inflation factor.
| Analysis | Metric | Result | Interpretation |
| UTD+UV model | Apparent AUC | 0.913 | Development cohort |
| UTD+UV model | 10-fold cross-validated AUC | 0.91 | Stratified folds; seed 20260902 |
| Final 4-variable model | Apparent AUC | 0.951 | Development cohort |
| Final 4-variable model | Bootstrap optimism | 0.0069 | 1,000 resamples |
| Final 4-variable model | Optimism-corrected AUC | 0.944 | Apparent AUC minus mean optimism |
| Final 4-variable model | Temporal-validation AUC | 0.914 | Unchanged equation |
| Final 4-variable model | Temporal-validation Brier score | 0.121 | Lower is better |
| Final 4-variable model | Calibration intercept / slope | 0.699 / 0.754 | Temporal cohort |
| L1-penalized sensitivity model | Selected variables | Age, bone age, UTD, ULD, UAD, UV, OAD, OV | Selection stability check; not confirmatory |
Table 6: Sensitivity analyses for model performance and variable selection.
| Variable | Development (n=175) | Temporal validation (n=90) | Test | P |
| Height (cm) | 124.85 ± 6.05 | 123.82 ± 5.50 | Welch t | 0.167 |
| Bone age (years) | 9.40 (8.37, 10.50) | 9.04 (7.96, 10.52) | Mann-Whitney U | 0.352 |
| UV (cm3) | 1.78 (1.42, 2.21) | 1.72 (1.30, 2.10) | Mann-Whitney U | 0.177 |
| OV (cm3) | 1.55 (1.19, 1.88) | 1.64 (1.25, 1.85) | Mann-Whitney U | 0.468 |
| ICPP | 90 (51.43) | 48 (53.33) | Chi-square | 0.769 |
| PT | 85 (48.57) | 42 (46.67) |
Table 7: Development- versus temporal-validation cohort comparison. Percentages for the validation diagnostic distribution use n = 90.
Tartışma
The principal finding is that uterine and ovarian measurements differed between girls classified as ICPP and PT, but the amount of overlap and the dependence of operating characteristics on the chosen threshold limit stand-alone use. UTD and UV had the highest individual uterine AUCs, whereas the best ovarian AUC was lower. This pattern is biologically plausible because the uterus is estrogen responsive16, but it does not establish that one organ or metric is universally superior. A recent systematic review emphasized wide methodological variation, inconsistent cutoff definitions, and limited reproducibility data across studies of pelvic imaging in girls with suspected precocious puberty13.
The present UV cutoff was lower than values reported in some cohorts, including the Korean study by Lee et al.14. Differences in age distribution, case spectrum, diagnostic reference standards, bladder status, plane selection, caliper placement, and bilateral averaging can all shift thresholds. Song et al.15 studied progressive versus nonprogressive central precocious puberty rather than the ICPP-versus-PT contrast used here, while Lee and Yu reported substantial overlap and modest discrimination for uterine volume in girls aged 7–8 years17. These differences argue against transferring a single threshold across settings. The scenario-specific operating points reported here make the tradeoff explicit: screening thresholds sacrifice specificity, whereas confirmation-oriented thresholds sacrifice sensitivity.
Pelvic ultrasonography should therefore complement clinical and endocrine assessment. Serial pubertal staging, growth velocity, bone-age advancement, basal ultrasensitive LH levels, and a GnRH stimulation test, when indicated, remain central to distinguishing progressive central puberty from benign variants10,11,12. Brain magnetic resonance imaging should be guided by age, symptoms, and endocrine evaluation rather than by pelvic ultrasound alone12. The UTD+UV model may help prioritize follow-up or stimulation testing, but its probability thresholds remain exploratory and do not justify treatment without standard diagnostic confirmation.
The four-variable model showed high apparent and temporal AUCs, yet calibration was imperfect, with a calibration slope below 1, suggesting overfitting. Low VIFs reduce concern about linear collinearity among retained predictors, but they do not address selection instability. The penalized sensitivity analysis selected a broader feature set, indicating variation in predictor selection across modeling approaches. The 2025 cohort is temporally separate but comes from the same institution and measurement workflow, so it is not an independent external validation cohort.
Several protocol points are critical for reproducibility: adequate bladder filling, orthogonal imaging planes, standardized caliper placement, bilateral averaging of ovarian measurements, and explicit documentation of machine presets and operator blinding. Two experienced sonographers performed duplicate measurements under diagnostic blinding, and only examinations meeting the predefined image-quality criteria were included. Additional limitations include the retrospective single-center design, a Chinese referral population, possible incorporation and spectrum biases, and data-driven cutoff selection. Prospective multicenter studies should formally assess reproducibility and validate both discrimination and calibration before implementation.
In conclusion, pelvic ultrasonography provides useful adjunctive information for differentiating ICPP from PT, particularly through uterine measurements, but it cannot replace longitudinal clinical assessment and hormonal testing. The height-bone age-UV-OV model showed promising same-center temporal performance; prospective independent validation and calibration updating are required before clinical use.
Açıklamalar
The authors have no conflicts of interest to declare.
Teşekkürler
The authors thank the clinical staff and technicians of the Department of Ultrasound at The First Hospital Affiliated to Army Medical University, as well as the participating children and their legal guardians. This research received no specific grant from any funding agency in the public, commercial, or not-for-profit sectors.
Malzemeler
| Ad | Şirket | Katalog numarası | Yorumlar |
|---|---|---|---|
| C1-5-D curved-array transducer | GE HealthCare | C1-5-D | Used with LOGIQ E9; 2.5-7.0 MHz |
| Centrifuge 5810 R | Eppendorf | 5810 R | Serum separation |
| cobas e 801 analyzer | Roche Diagnostics | cobas e 801 | Electrochemiluminescence analyzer |
| Elecsys Estradiol III | Roche Diagnostics | 6656021190 | E2 assay |
| Elecsys FSH | Roche Diagnostics | 11775863122 | FSH assay |
| Elecsys LH | Roche Diagnostics | 11732234122 | LH assay |
| Gonadorelin acetate | Ma'anshan Fengyuan Pharmaceutical | 100 microg/vial | 2.5 microg/kg; maximum 100 microg |
| LOGIQ E9 ultrasound system | GE HealthCare | LOGIQ E9 | Pelvic ultrasonography |
| Python | Python Software Foundation | Python 3 | Sensitivity analyses |
| R | R Foundation for Statistical Computing | 4.3.2 | Statistical analysis |
| scikit-learn | scikit-learn developers | Cross-validation and L1-penalized sensitivity analysis | |
| SciPy | SciPy community | Sensitivity analyses | |
| SPSS Statistics | IBM | 25 | Statistical analysis |
| statsmodels | statsmodels development team | Logistic/regression analyses | |
| Vacutainer serum collection tubes | BD, Franklin Lakes, NJ, USA | Used for venous blood collection |
Kaynaklar
- Alghamdi A. Precocious puberty: types, pathogenesis and updated management. Cureus. 2023;15(10):e47485.
- Soliman AT, et al. Long-term health consequences of central precocious/early puberty and treatment with GnRH analogue: a short update. Acta Biomed. 2023;94(6):e2023222.
- Kan L, He D, Yue W. The combined diagnostic and therapeutic value of ultrasound and X-ray bone age index in girls with idiopathic central precocious puberty. Endocr Connect. 2025;14(10):e250354.
- Li R, Shang X, Zhang T, Yan S. Childhood obesity and central precocious puberty. Zhong Nan Da Xue Xue Bao Yi Xue Ban. 2024;49(7):1034-41.
- Corripio R, et al. Adult height in girls with idiopathic central precocious puberty treated with triptorelin. Front Endocrinol (Lausanne). 2024;15:1498726.
- Chen T, Zhang D. Basal gonadotropin levels combine with pelvic ultrasound and pituitary volume: a machine learning diagnostic model of idiopathic central precocious puberty. BMC Pediatr. 2023;23(1):603.
- Dinkelbach L, et al. Central precocious puberty and psychiatric disorders. JAMA Netw Open. 2025;8(6):e2516679.
- Cui HJ, Liu P, Liu XG, Du WZ, et al. The clinical value of serum-related indexes in differentiating simple premature thelarche from idiopathic central precocious puberty. Pak J Med Sci. 2024;40(3):467-72.
- Cleemann Wang A, et al. Differentiation of idiopathic central precocious puberty from premature thelarche using principal component analysis. J Clin Endocrinol Metab. 2024;109(2):370-9.
- Zevin EL, Eugster EA. Central precocious puberty: a review of diagnosis, treatment, and outcomes. Lancet Child Adolesc Health. 2023;7(12):886-96.
- Endocrinology, Genetics and Metabolism Group, Chinese Pediatric Society, Chinese Medical Association; Editorial Board, Chinese Journal of Pediatrics. Expert consensus on the diagnosis and treatment of central precocious puberty (2022). Zhonghua Er Ke Za Zhi. 2023;61(1):16-22.
- Latronico AC, et al. Central precocious puberty: an Endocrine Society clinical practice guideline. J Clin Endocrinol Metab. 2026;111(8):2101-44.
- Smets AM, et al. Abdominal imaging in precocious puberty in girls: can imaging determine onset of puberty? Pediatr Radiol. 2025;55(4):660-73.
- Lee SH, et al. The diagnostic value of pelvic ultrasound in girls with central precocious puberty. Chonnam Med J. 2016;52(1):70-4.
- Song K, et al. Development of a simplified prediction model for diagnosing progressive central precocious puberty using clinical and pelvic ultrasound parameters. PLoS One. 2025;20(5):e0323549.
- Furuminato K, et al. The role of mesenchymal estrogen receptor 1 in mouse uterus in response to estrogen. Sci Rep. 2023;13(1):12293.
- Lee HS, Yu J. Usefulness of pelvic ultrasonography for the diagnosis of central precocious puberty in girls. Korean J Pediatr. 2015;58(8):294-300.