


Overview
Source: Roberto Leon, Department of Civil and Environmental Engineering, Virginia Tech, Blacksburg, VA
Polymeric materials are widely used in civil structures, with uses ranging from very soft sealants to more rigid pipes in water and wastewater systems. The most basic definition of a polymer is a molecular structure with repeating subunits. The term polymer comes from Greek, where "poly" means many, and "-mer" means basic unit. Monomers, or single mers, are the specific repeating units. With polymers, the structure, including the length of the carbon backbone and the varying flexibility, will dictate the properties of the polymer. Polymers are classified into 3 subcategories: plastics, elastomers, and rigid rod polymers. Plastics are further subdivided into thermosets, which do not soften on heating, and thermoplastics, which do soften when heated and harden on cooling. Additionally, thermoplastics are mostly linear or branched polymers with little to no cross-linking, whereas thermosets exhibit 3D structure and have extensive cross-linking. Elastomers, or rubbers, are long, coiled chains and can be stretched to twice the original length, but will contract back to the original size when released, whereas rigid rod polymers do not stretch and are strong, crystalline structures.
In this laboratory, we will look at several different polymeric materials, including high density polyethylene (HDPE), polyvinyl chlorides (PVC), nylon, and methyl methacrylate (acrylic) in order to understand the breadth and diversity of the stress-strain curves for these materials and how their mechanical properties affect their performance.
Principles
Polymers are made up of a carbon backbone with distinctive side chains. Carbon exhibits tetrahedral bonding, thus the bonds are capable of rotation, resulting in chains that can be straight, kinked, twisted, or bent. The flexibility of the bonds is determined by the number of double bonds and cross-linking bonds, as well as the character of the side chain groups. More double and cross-linking bonds will restrict rotation. While small side chain groups allow more free rotation, bulky side groups restrict rotation.
Knowing the differences between the structures of the various types of polymers helps guide application use. Thermoplastics have chains that are not connected, but are instead held together by weak van der Waals forces, enabling the chains to slide past one another. This property allows thermoplastics to easily deform, and it also makes them easy to recycle. On the other hand, thermosetting plastics have strong covalent bonds and are cross-linked, or connected with one another. This characteristic makes thermosetting plastics difficult to recycle. Usually, the materials are shredded and reused as filler material.
Along with the bonding types, another characteristic that one should consider when selecting a polymer for a particular application is the degree of crystallization. Polymers can be amorphous (non-ordered) or crystalline (well-ordered), but are generally somewhere in between and termed semi-crystalline. The degree of crystallization depends upon rate of cooling, chain configuration, and the molecular chemistry. A higher degree of crystallization tends to result in a higher strength, Young's modulus (E), and temperature resistance. On the other hand, to determine the degree of polymerization, one must determine an average molecular weight for the chains, as in real life applications chains will be of varying lengths. The degree of polymerization, n, is simply the molecular weight of a chain divided by the molecular weight of a monomer. The stress-strain behavior of polymers is highly variable. Thermoplastics display both ductile and brittle behavior, while thermosets tend to only exhibit brittle behavior. On the other hand, elastomers often have a low Young's modulus and display non-linear behavior. The properties of polymers lie somewhere between a Hookean and a Newtonian material, as they depend on strain, time, and temperature. Hookean material properties depend on strain, while Newtonian material properties depend on the rate of strain. Under tensile testing, some polymers will undergo necking, where the material can strain and elongate the specimen when tensile forces are applied. Various polymer types will undergo different forms of failure when stretched in a tensile test. The resultant failure can be chain uncoiling, cracking, or the separation of crystalline block.
Temperature also plays a key role in how polymers will behave. TM is the melting temperature of the material, and TG is the glass transition temperature. Principally, if T > TM, the material is liquid-like, or viscous. However, if T < TG, the material is glassy and will be brittle. If T ~ TG, the material is rubbery, while if T > TG, the material is flowing and more ductile. Figure Y illustrates this behavior.
Subscription Required. Please recommend JoVE to your librarian.
Procedure
- Obtain typical tensile specimens of acrylic, nylon, HPDE, and PVC polymeric materials.
- Using a micrometer, measure the width and thickness at several locations along the shaft of each specimen to determine the average cross-sectional dimensions. Record the average measured width and thickness of each specimen on the data sheet.
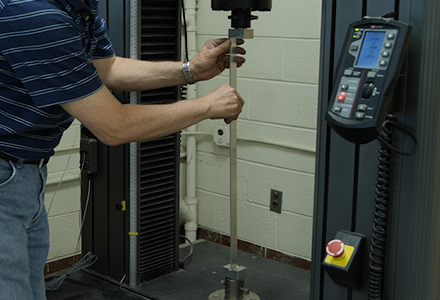
- Place the specimen in the grips. Make sure that at least 80% of each end is firmly attached to the grips, which will help ensure against slippage during the loading operation. Sandpaper may also be used (grit side toward the sample) to improve gripping of the sample.
- Measure the length of the specimen between the grips. This value is the gage length and will be used to calculate strain.
- Attach the electronic extensometer securely to the specimen as per manufacturer's specification. Note: The extensometer blades do not need to be positioned exactly on the gage marks on the specimen, but should be approximately centered on the specimen.
- Begin applying the tensile load to the specimen and observe the live reading of applied load on the computer display. If the measured load does not increase, the specimen is slipping through the grips and needs to be reattached. In this instance, the instructor will stop the test and repeat the procedure from Step 2.
- Continue applying tensile load slowly, observing the shape of the computer-generated load vs. displacement graph throughout the loading.
- Sometime prior to sample failure, the test will be automatically paused without unloading the specimen. At this point, remove the extensometer. If the specimen breaks with the extensometer in place, you will destroy the extensometer, a very expensive piece of equipment.
- Load the specimen until failure. Record the maximum load and the load at failure.
- Remove the broken specimen from the machine. Observe and document the location and character of the fracture.
- Measure the width and thickness of each specimen in the region of failure and record the final measurements.
Polymers represent some of the most widely used materials in the world, being found in everything from soft sealants to rigid water pipes. The most basic definition of a polymer is a molecular structure with a long chain of repeating subunits, or monomers. Polymers can be classified into many subcategories. Two of the most basic are the form-holding plastics and the flexible elastomers.
Plastics are further subdivided into thermoplastics and thermosets. Thermoplastics are mostly linear and exhibit very little cross-linking. Thermosets usually have more complicated three-dimensional structures, typically with extensive cross-linking.
Elastomers, also known as rubbers, are comprised of long, coiled polymer chains and can be stretched to beyond their original resting length but will contract back to the original size when released.
In this video, we will determine stress strain curves for different polymeric materials, in order to understand how their mechanical properties affect their performances.
One of the most basic ways polymers are characterized is with a stress-strain curve analysis. This involves applying a known load to a specimen and observing the resulting deformation.
The stress-strain behavior of polymers depends largely on the type of material being analyzed. The stress axis represents the amount of force applied to the material, while the strain curve represents the relative deformation because of this stress. The final point of the curve represents the point where the material ultimately failed, due to the force applied.
In the linear regions of a stress-strain curve, the slope represents the Young's modulus of that material. This is an intrinsic property of a given material. Deformation within this linear region is known as elastic deformation and is reversible. Deformation past this region is known as plastic deformation and is permanent.
Now that you understand polymers and their properties, lets test different polymeric materials using a tensile test machine.
Obtain typical tensile specimens of acrylic, nylon, HPDE and PVC polymeric materials. Using a micrometer, measure the width and thickness at several locations along the shaft of each specimen to determine the average cross-sectional dimensions. Record the average measured width and thickness of each specimen on the data sheet.
Set up the universal testing machine as shown in the JoVE video regarding stress-strain characteristics of steels. Next, place the specimen in the grips of the tensile test machine. Make sure that at least 80 percent of each end is firmly attached to the grips, which will help prevent slippage during the loading operation. Sandpaper may also be used to improve gripping of the sample.
Attach the electronic extensometer securely to the specimen according to the manufacturer's instructions. Next, measure the length of the specimen between the grips. This value is the gauge length and will be used to calculate strain. Now, begin applying the tensile load to the specimen and observe the live reading of applied load on the computer display. If the measured load does not increase, the specimen is slipping through the grips and needs to be re-attached. In this instance, stop the test and re-attach the specimen to the grips.
Continue applying tensile load slowly, observing the shape of the computer-generated load versus displacement graph throughout the loading. Sometime before sample failure, the software will automatically pause the test. Leave the sample in the test machine and remove the extensometer. Resume applying tensile load until failure. Record the maximum load and the load at failure. Remove the broken specimen from the machine. Observe and document the location and character of the fracture. Measure the width and thickness of the specimen in the region of failure, and record the final measurements.
Repeat this protocol for the remaining specimens, making sure to document and characterize the location of their fractures.
With the testing complete, let's now look at the results of the tensile test. Here, we see the progression of failure in a high-density polyethylene sample. During the tensile test there is a significant amount of necking up and down the specimen as the polymeric chains uncoil, showcasing the ductility of HDPE. This phenomenon is even more noticeable if the material is loaded slowly, allowing the HDPE sample to stretch to several times its initial length.
PVC shows a similar failure progression to HDPE, but with a much higher Young's modulus and lower ductility.
The nylon sample had almost as high a Young's modulus as PVC, but was a far more ductile material, elongating more similarly to the HDPE specimen.
In contrast, the acrylic specimen basically fails without any non-linear deformation. The resulting break occurs with no visible elongation of the sample.
Next, let's calculate the Young's modulus for the linear regions of specimens. We will sample three pairs of points across the elastic deformation region, and calculate the slope of each pair. The averages of these three slopes will be the approximate Young's modulus of that material.
As it can be seen, the two highest Young's moduli correspond to the materials which required more force to break. In this example, this represents the PVC and acrylic samples. These materials also underwent little to no plastic deformation, in comparison to HDPE or nylon, making them comparatively brittle materials. The HDPE and nylon samples had lower Young's moduli, meaning the required less force to deform. These samples experienced significant necking, making them the most ductile of the sampled materials.
Let us now look at a couple of common applications of different polymers. Nearly any professional field will find plastics being used, from medical equipment to high-strength building materials.
In civil engineering applications, polymers are widely used for sealants, piping or hoses, siding, coating, and adhesives. The diverse properties of polymers make them a potential candidate for nearly any job.
Elastomers are a specific type of polymer, widely sought out for their unique properties. As they have a large stretch ratio, are electrically non-conductive, and extremely waterproof, they are useful in applications from electrical insulative wires to nitro gloves used in laboratories.
You've just watched JoVE's introduction to tension tests of polymers. You should now understand the basics of polymer science and know the standard laboratory test for determining the stress-strain relationship for different polymeric materials.
Thanks for watching!
Subscription Required. Please recommend JoVE to your librarian.
Results
Typical failures for these materials are shown in Fig. 1 to Fig. 4. Fig. 1 shows the progression of failure in a polyethylene, with an initial necking and subsequent progression of necking up and down the specimen as the polymeric chains uncoil. High-density polyethylene material, if loaded slowly, can stretch to several times its initial length (Fig. 2). PVC, on the other hand, shows a similar failure progression, but with much lower ductility (Fig. 3). This figure also demonstrates the typical influence of strain rate on deformation capacity; the faster the rate, the lower the ductility and the slightly higher the strength. In contrast, the acrylic specimen basically fails without any non-linear deformation (Fig. 4).

Figure 1: A. Progression of necking in a short HDPE specimen. B. Close up of necking near grip, showing comparison to original specimen.

Figure 2: Large deformations possible in a HDPE loaded slowly. The photo shows the entire specimen whose end is shown in Fig. 1B.

Figure 3: Failure in a PVC specimen showing strain rate effects.

Figure 4: Failure in an acrylic specimen.
The results for the stress-strain curves for the four materials are shown in Fig. 5 through Fig. 8.

Figure 5: Stress-strain curve for HDPE.

Figure 6: Stress-strain curve for PVC.

Figure 7: Stress-strain curve for nylon.

Figure 8: Stress-strain curve for an acrylic.
It is important to note that Fig. 5 through Fig. 8 all have very different horizontal and vertical scales. The test results for those experiments are summarized in Tables 1 and 2, while Fig. 9 shows a comparison of the stress-strain curves up to 50% strain. The difference in elongation percentages (Table 2) are striking and show the great variation between the mechanical behavior of polymeric materials. The strength variation is somewhat smaller, with only the HDPE showing a significantly lower value. The behavior ranges from elastic brittle for acrylic to very ductile and softening for HDPE.
Table 1: Raw data summary.


Figure 9: Comparisons of stress-strain curves, up to 50% strain, for all polymers tested.
| MATERIAL | PVC | HDPE | Acrylic | Nylon | |
| Initial Area | 0.0624 | 0.0633 | 0.0624 | 0.0628 | in.2 |
| Final Area | 0.0185 | 0.0076 | 0.0605 | 0.0528 | in.2 |
| % Change in Area | 70.37 | 87.92 | 3.00 | 15.84 | % |
| Original Gage Length | 1.987 | 2.021 | 2.123 | 2.245 | in. |
| Final Gage Length | 2.157 | 6.985 | 2.098 | 3.650 | in. |
| % Elongation | 8.56 | 245.62 | -1.18 | 62.58 | % |
| Strain for Initial Stiffness | 0.012 | 0.019 | 0.020 | 0.020 | in./in. |
| Stress for Initial Stiffness | 8.0 | 2.5 | 7.0 | 8.0 | ksi |
| Initial Modulus | 667 | 132 | 350 | 400 | ksi |
| Strain for 0.2% strength | 0.0090 | 0.0160 | 0.0165 | 0.0090 | in. |
| Yield Strength (02% offset) | 4.6 | 1.8 | 4.9 | 2.0 | in. |
Table 2: Summary of results.
Subscription Required. Please recommend JoVE to your librarian.
Applications and Summary
Fig. 9 shows the large variation in load-deformation characteristics for several polymers. The behavior ranges from purely strong, elastic and brittle for the acrylic specimen to soft, highly visco-elastic and very ductile for the HDPE. These reflect the extreme properties of thermosets (acrylic) to thermoplastic (HDPE, nylon and PVC). It is interesting to note that the PVC, which is frequently used in finished and pies in our buildings and homes, shows a good balance of strength, viscoelasticity and ductility.
In civil engineering applications, polymers are commonly used for coatings, sealants, adhesives, siding, pipes, pipeliners, geotextiles, geogrids, geomembranes, interior finishing, repair, restoration, as well as exterior structural elements. The plastics industry in the United States is very large, and it accounts for almost 1 million jobs and $308 billion in industry shipments during 2014. There are also many natural polymers used in the commercial field, such as wood, rubber, cotton, and leather, as well as in the field of biology, such as proteins, enzymes, and starches. Even the Tupperware and take-out food containers one uses when eating out are made up of polymers.
Subscription Required. Please recommend JoVE to your librarian.