The goal of this protocol is to prepare, purify and characterize gas-filled microbubbles (targeted contrast agents for ultrasound molecular imaging). Two targeting systems are described: biotinylated bubbles adherent to streptavidin, and cyclic RGD peptide microbubbles that bind to αvβ3, a known tumor neovasculature biomarker.
Method Article
Preparation and Characterization of Targeted Microbubbles
In This Article
Summary
Abstract
Targeting of microbubbles (ultrasound contrast agents for molecular imaging) has been researched for more than two decades. However, methods of microbubble preparation and targeting ligand attachment are cumbersome, complicated, and lengthy. Therefore, there is a need to simplify the targeted microbubble preparation procedure to bring it closer to clinical translation. The purpose of this publication is to provide a detailed description and explanation of the steps necessary for targeted microbubble preparation, functional characterization and testing. A sequence of the optimized and simplified procedures is presented for two systems: a biotin-streptavidin targeting pair model, and a cyclic RGD peptide targeting the recombinant αvβ3 protein, which is overexpressed on the endothelial lining of the tumor neovasculature.
Here, we show the following: covalent coupling of the targeting ligand to a lipid anchor, assessment of the reagent quality, and tests that confirm the successful completion of the reaction; preparation of the aqueous precursor medium containing microbubble shell components, followed by microbubble preparation via amalgamation; assessment of the efficacy of lipid transfer onto the microbubble stabilizer shell; adjustment of microbubble size distribution by flotation at normal gravity to remove larger microbubbles that might be detrimental for in vivo use; assessment of microbubble size distribution by electrozone sensing; evaluation of targeted binding of the microbubbles to receptor-coated surface in a static binding assay test (in an inverted dish); and evaluation of targeted binding of the microbubbles to receptor-coated surface in a parallel plate flow chamber test.
Introduction
Molecular imaging with targeted microbubbles has been in research and testing for more than two decades. The general concept is straightforward: gas-filled microbubbles that possess selective affinity to the molecular biomarker specific to vascular endothelium in the area of disease are injected intravenously. These particles circulate and accumulate in the target (e.g., tumor neovasculature or the area of ischemic inflammatory injury). Adherent microbubbles are then detected by contrast ultrasound imaging. Early concept research efforts from last century1,2 are now gradually progressing towards clinical adoption: they have reached medium-scale clinical trial stage just several years ago3,4. The purpose of this manuscript is to provide the detailed explanation on the preparation and characterization of such targeted microbubbles, based on two published examples1,5.
The procedure for the preparation of peptide-PEG-phospholipid, a crucial component for the formulation of these targeted microbubbles, is supplemented with the description of reagent quality control, as required for the successful completion of the reaction. Unfortunately, some active ester lipid reagent suppliers provide material that is hydrolyzed on arrival and therefore is unable to participate in the formation of amide bond. The information on how much of the lipid material is transferred onto the microbubble shell from the aqueous medium during microbubble preparation is provided, as well as the technique to obtain this information.
It is important to prepare microbubbles with a relatively narrow particle size distribution: the co-presence of large microbubbles in the injectable media for intravascular in vivo testing may lead to clogging of microvasculature; nonspecific accumulation of microbubbles that bypass lung shunts might cause nonspecific false-positive tissue enhancement6, which is avoided by removing microbubbles of larger sizes. Therefore, a simple procedure to achieve particle size selection is presented, supplemented by the description of a method to assess particle concentration and size distribution with a particle counter.
The first test protocol for microbubble targeting assessment, as presented below, describes a purely model system, with biotinylated microbubbles targeted to streptavidin-coated surface1. The second protocol is based on a manuscript describing simplified preparation of peptide-targeted microbubbles, decorated with a cyclic RGD peptide that possesses specific affinity towards αvβ3, a molecular biomarker of tumor neovasculature5. Microbubbles decorated with this cyclo[Arg-Gly-Asp-D-Phe-Lys], i.e., c(RGDfK) peptide by the presented technique have been shown to target tumor neovasculature and achieve ultrasound molecular imaging in a murine tumor model.
Protocol
1. Covalent coupling of the peptide to NHS-PEG-DSPE
- Dissolve the c(RGDfK) peptide with the primary ε-aminogroup of lysine unprotected and available for coupling, in dimethyl sulfoxide (DMSO, 10 mg/mL). Prepare a methanol or chloroform solution of N-hydroxysuccinimide ester of poly(ethyleneglycol)-3400-distearoyl phosphatidylethanolamine (NHS-PEG-DSPE, 200 mg/mL), and add to 1 mg of peptide in DMSO. Add 3 μL of N,N-diisopropyl ethylamine (DIPEA).
- Maintain a peptide-to-NHS-PEG-DSPE molar ratio at least 1:1.2, so that all the primary amino groups will be able to react. Maintain a DIPEA:peptide molar ratio at least 2:1 to assure basic media conditions.
CAUTION: Chloroform, methanol and DIPEA are hazardous materials. Use proper protection, such as gloves, labcoat, goggles and fume hood.
NOTE: Any other peptide or mimetic with a primary amino group can be used instead of c(RGDfK), with unprotected N-terminus or a lysine located outside of the binding site. For the reaction to proceed, all the components (i.e., targeting ligand and lipid) must be soluble in DMSO-chloroform mixture. Alternative solvents, such as dimethylformamide, or its mixtures, may also be tested. Reaction in aqueous media is also possible, but coupling yield will be much lower due to rapid hydrolysis of active ester.
- Maintain a peptide-to-NHS-PEG-DSPE molar ratio at least 1:1.2, so that all the primary amino groups will be able to react. Maintain a DIPEA:peptide molar ratio at least 2:1 to assure basic media conditions.
- Following overnight incubation at room temperature, remove the volatile organic material by evaporation (use stream of nitrogen gas or a rotary evaporator, followed by overnight evaporation under a high vacuum pump, to remove DMSO). Redissolve the nonvolatile residue in chloroform at 1 mg/mL for controlled sampling.
- Confirm reaction completion by thin layer chromatography (develop TLC plates in chloroform:methanol solvent media, 2:1 v/v). Confirm presence or absence of the primary amino group with ninhydrin spray upon heating the plate on a 150 °C heating block.
CAUTION: Ninhydrin is hazardous material. Use proper protection, as described above. Heating block treatment of TLC plates must be performed in a fume hood. The heating block is a potential fire hazard. - Prior to the microbubble preparation, aliquot a sample of peptide-PEG-DSPE from chloroform (e.g., 1 mL of 1 mg/mL solution), evaporate chloroform to dryness in a stream of nitrogen gas, with subsequent high vacuum pump incubation, and add saline to 1 mg/mL, to achieve transparent micellar solution.
- If further purification of the reaction mixture is desirable, redissolve in normal saline. Then subject the resulting micellar mixture to dialysis (6-8 kDa molecular weight cut-off, or similar), first against normal saline, and then against several changes of deionized water.
- Confirm completion of dialysis by a conductivity check of dialysate. Remove dialyzed material from the dialysis bag, place in a vial with known mass, and lyophilize until complete dryness.
NOTE: An alternative covalent reaction to attach the ligand to the terminus of PEG-lipid is available (e.g., a reaction of maleimide-PEG-DSPE with thiol-ligand). The main advantage of this approach is oriented coupling, if a single thiol is available on the ligand molecule 7. The main concern is long-term stability: the resulting link between maleimide and thiol may be prone to degradation by a retro-Michael reaction, depending on storage conditions 8.
NOTE: Quality of active ester reagents greatly varies between the manufacturers: it may depend on the transfer and storage conditions (if the material is not stored or transported properly, the active ester will hydrolyze and will not be able to couple with the peptide). Consequently, there is a feeling of obligation to describe a procedure (see below) for the determination of the degree of degradation of NHS-PEG-DSPE, a reagent for covalent attachment of targeting ligands to microbubbles. NHS-PEG-DSPE, supplied as dry powder under argon, is stored in deep freeze. A vial is brought to room temperature (to avoid moisture condensation), a sample weighed, using analytical balance, and dissolved in methanol or DMSO. A vial with bulk dry reagent should be closed under argon and returned to deep freeze, in a sealed container with desiccant, until further use. - Prepare an aqueous micellar solution of peptide-PEG-DSPE (Step 1.4), as well as biotin-PEG-DSPE, by simple addition of dry reagent to aqueous saline, and incubation. Small spherical micelles are formed. To accelerate the transfer of the reagent from bulk state to the micellar form, sonication and hot water bath can be applied.
- Assess the reagent quality of NHS-PEG-DSPE active ester.
- Confirm that NHS present in the reagent is in the form of active ester, to be able to perform the coupling reaction with amide bond formation.
- Place 0.99 mL of 0.1 M sodium tetraborate buffer, pH 9.2, in a quartz or ultraviolet-transparent plastic cuvette (not glass) in a spectrophotometer, and zero at 260 nm wavelength.
- Add 10 μL of the freshly prepared 200 mg/mL solution of NHS-PEG-DSPE in methanol to the cuvette. At the same time, start the stopwatch. Rapidly and vigorously mix the cuvette content to achieve uniformity. Place the cuvette in the photometer, close the lid, and start the measurement.
- At the start of the spectrophotometer measurement, mark the time of the beginning of the recording, and continuously perform photometric absorbance measurements at 260 nm every 10 s for ~10 min, or until the stabilization of absorbance value.
- Plot the kinetic curve, check initial A260 time points, and extrapolate the curve to the reaction start time (i.e., find out A260 at the point where reagent was added to aqueous buffer and hydrolysis reaction has started). Assume that prior to the addition of NHS-PEG-DSPE to the buffer in the cuvette no hydrolysis had taken place in organic solvent due to lack of water.
- Compute the ratio between A260 at the start of the reaction and at the completion of the hydrolysis; it represents the fraction of the degraded active ester. Use this information to select the proper amount of NHS-PEG-DSPE for the complete modification of the primary amino group of the peptide.
2. Preparation of microbubbles by amalgamation
- Preparation of biotinylated microbubbles
- Co-dissolve distearoyl phosphatidylcholine (DSPC) and PEG stearate in propylene glycol (PG, 10 mg/mL concentration for each in neat solvent). Use a hot water bath to solubilize the materials.
- Add 0.1 mL of this hot PG solution to a vial containing 0.85 mL of hot normal saline, rapidly mix, and add micellar biotin-PEG-DSPE (50 μL, 1 mg/mL in saline) at a 1:20 mass ratio to DSPC.
NOTE: Solubility of lipid components in PG is temperature-dependent, so a hot water bath is necessary. It is helpful to heat the glass vial containing saline in a hot water bath prior to lipid addition, to create a uniform medium without visible particles. - Bring the vial to room temperature, place a rubber stopper on the vial, inserted halfway, and insert PTFE capillary tubing in the vial. Use the flow of decafluorobutane gas to fill the vial, and then close the stopper, while removing the capillary.
NOTE: The temperature of the vial during amalgamation may have a significant effect on the size distribution of the resulting microbubbles 9. - Crimp the stoppered vial, at room temperature, and place in an amalgamator apparatus. Start the amalgamator. The clinical unit used is preset to operate at 4300 rpm for 45 seconds.
- When amalgamation is completed, remove the vial with the resulting microbubbles from the amalgamator. Preferably, characterize the microbubble size distribution and composition and use them within several hours of preparation.
- Preparation of peptide-decorated microbubbles
- Co-dissolve DSPC and PEG stearate in neat PG (10 mg/mL concentration for each material). Use a hot water bath to solubilize. Add 0.1 mL of this hot solution in PG to a vial containing 0.85 mL of hot normal saline, rapidly mix, and add micellar peptide-PEG-DSPE (50 µL, 1 mg/mL in saline) added at a 1:20 mass ratio to DSPC.
- Bring the vial to room temperature, place a rubber stopper on top of the vial, inserted halfway, and insert polytetrafluoroethylene (PTFE) capillary tubing in the vial. Use the flow of decafluorobutane gas to fill the vial, and then close the stopper, while removing the capillary.
- Crimp the stoppered vial and place in an amalgamator for mixing. The vial with microbubble dispersion is ready in 45 s.
- Preparation of dye lipid microbubbles for assessment of lipid transfer to microbubble shell
- Co-dissolve DSPC and PEG stearate in neat PG, as described above (use a hot water bath) (10 mg/mL concentration for each material).
- Add 0.1 mL of this hot PG solution to a vial with 0.89 mL of hot normal saline, rapidly mix, add 10 μL of DiI dye solution (1 mg/mL in neat PG) and mix. Bring the vial to room temperature.
- Fill the vial headspace with decafluorobutane gas as above, stopper the vial, crimp and amalgamate as described above.
3. Test DiI lipid transfer from the micellar aqueous medium to the bubble shell
- For the microscopy confirmation that fluorescent lipid material has transferred from the aqueous medium to the microbubble shell, sample an aliquot of microbubbles from the vial through the septum with an insulin syringe.
- Then add a drop to a glass slide and cover it with a standard coverslip. First dilute it with a droplet of degassed saline.
- Perform microscopy with a video microscope, equipped with a fluorescence epi-illumination, 100x oil objective and high sensitivity video camera.
- To determine the efficacy of transfer of lipid material from the aqueous saline/PG media to the bubble shell during amalgamation, take a sealed vial of microbubbles, invert it and place it in a conical 50 mL tube.
- Perform centrifugation in a bucket rotor (10 min, 200 x g). Remove the vial from the centrifuge and keep it inverted.
- Insert a needle of an insulin syringe into the septum of the inverted vial. Aspirate a small volume (~50 μL) of clear infranatant slowly.
NOTE: The bevel tip of the needle for infranatant aspiration from the inverted vial after centrifugation must be located as close to the septum as possible, to minimize chances of microbubble intake.
- Place the samples of infranatant (2 μL), as well as the samples of the original lipid-PG-saline medium that was used to generate microbubbles (2 μL) in a 96-well plate with 0.1 mL of phosphate-buffered saline (PBS):ethanol 1:1 medium with 1% Triton X-100.
- Measure red fluorescence of DiI dye (555 nm excitation, 620 nm emission) with a fluorescence microplate reader.
- Use black plates with non-transparent bottom for fluorescence spectroscopy due to lower background and lack of inter-well signal transfer that may become an issue for clear plates.
- Ensure that the fluorescence signal is within the linear calibration range: excessive dye concentration in the wells may lead to light attenuation and under-reported signal.
NOTE: It may sometimes be desirable to remove the residual shell material that remains in the aqueous medium following amalgamation. To do this, after microbubble flotation centrifugation, take all of the infranatant volume out by slow aspiration from the inverted vial, and replace it by degassed normal saline. To avoid excessive change of ambient pressure in the vial due to removal or addition of liquid, insert an additional long needle in the septum to reach the gas phase inside the vial. To maintain the gas phase inside the vial, first, connect the needle to a syringe filled with fluorocarbon gas, to prevent air contact with the microbubble preparation.
4. Microbubble size distribution adjustment
- Use normal gravity flotation in a static inverted vial to adjust the size distribution of microbubbles, i.e., to remove largest microbubbles quickly and efficiently 5,10.
- Take a vial of microbubbles immediately following preparation as described in Section 2. Invert and place upside down on a stable non-vibrating surface for 15-20 min.
- Following this incubation, insert an insulin syringe needle in the septum of the vial, while it is still inverted, and gently collect 300-500 μL of microbubbles from the lower layer.
NOTE: The needle of the syringe must stay close to septum inner surface to avoid collection of larger bubbles present closer to the top of the liquid in the vial.- Pull back the syringe plunger slowly, to avoid turbulence and hydrostatic expansion of the bubbles in the syringe body. When the collected sample is taken out of the syringe, avoid overpressure to prevent bubble collapse.
- Transfer microbubble dispersion from the syringe to a small volume vial. Then fill with perfluorinated gas, stopper and crimp, for short-term storage, particle counting (see below) and further use.
- If sampling is performed directly from the syringe, hold horizontally and rotate to avoid bubble flotation and achieve sample uniformity.
5. Microbubble size distribution assessment
- Use a particle counter (based on electrozone sensing or light obscuration principle) to assess particle size distribution and concentration. Alternatively, use a hemocytometer and a microscope.
- Briefly, add a microbubble sample aliquot into normal saline or isotone in a counter chamber (typically, 60-100 mL volume) and count. Compare the microbubble size distributions before and after flotation purification.
NOTE: Subject the vial to gentle mixing (not vortexing) immediately prior to sampling, to achieve representative and reproducible measurements. Sample from the center of the tested volume. - Fill a 100 mL beaker with at least 60 mL of 0.9% saline solution diluent, and place it on the stage of the electrozone sending instrument. Lift the stage so that the tube, outer electrode plate, and stirrer, are all completely immersed in the diluent, and the stirrer can rotate.
NOTE: Diluent volume in the beaker can be precisely determined using its mass, with a scale (saline density is close to 1). Alternatively, a metering pump can be used. The electrodes during electrozone sensing study should be fully immersed. - Record the diluent electrolyte volume in the unit control software. Electrozone sensing counter is equipped with 50 µm orifice, which allows measurement of particles between 1 and 30 µm in diameter. Perform a background run first; it is expected to have less than 5000 counts in 0.5 mL of diluent as blank. The best background levels can be under 100 counts.
- Set the sample volume in the unit control software, to account for the dilution factor. Add 10-20 µL of the microbubble mixture to the beaker, and perform the second run.
- Use the background size distribution data to account for by the use of the "subtract background run" function within the software. Obtain the concentration of the particles in the original microbubble sample as particle number/mL; it includes the dilution factor.
- The outer surface of the pipet tip might be also covered with bubbles during sampling; make sure to wipe it off prior to inserting the tip into counting medium. Do not touch the pipet tip orifice with a wipe.
- Avoid insufficient dilutions of sample particles during counting, to minimize the issues with coincidence correction, where more than one particle at a time is within the sensor orifice: the system may then underestimate particle concentration.
NOTE: Orifice diameter for particle counting may vary. Selection of the 50 μm orifice allows detection of microbubbles with the diameter down to 1 μm, yet it is not as prone to clogging as smaller diameter options. - Calibrate the electrozone sensing counter for the same diluent test media (e.g., sterile-filtered normal saline irrigation solution) as is used in actual tests. A laser obscuration alternative to electrozone sensing has the advantage of not needing filtered saline with controlled salt concentration and electrical conductivity.
- Briefly, add a microbubble sample aliquot into normal saline or isotone in a counter chamber (typically, 60-100 mL volume) and count. Compare the microbubble size distributions before and after flotation purification.
6. Test microbubble targeting in vitro in an adhesion/retention assay
- Prepare the biomarker receptor surface for microbubble targeting to Petri dishes.
- Take polystyrene 35 mm diameter dishes to be used as the target surface. Take advantage of the nonspecific adhesion of proteins to the polystyrene dish surface from normal saline. Use a model protein, streptavidin, for testing of the targeting of biotinylated bubbles that contain biotin-PEG-DSPE as the part of the shell.
- Place a droplet of streptavidin solution (0.2 mL, 10 μg/mL in PBS) in the center of each Petri dish and cover it with a 22 mm x 22 mm plastic coverslip to allow for even coating of the dish surface. After overnight incubation at 4 °C in an enclosed moist environment to prevent the dish from drying out, remove the coverslips.
- Immediately and exhaustively wash the plates with water, PBS, and block them by incubation with 1.5% bovine serum albumin (BSA) in PBS for at least 4 h to minimize nonspecific adhesion of microbubbles to uncoated surface. Use the clean culture dishes blocked with 1.5% BSA as controls.
- Alternatively, use recombinant αVβ3 receptor solution (e.g., at 4 µg/mL in PBS)5 instead of streptavidin. Target microbubbles to this biomarker via cyclic RGD peptide ligand attached to the microbubble shell.
- Keep the dish with deposited target receptor wet: receptor protein may be inactivated if it dries out.
NOTE: It is important to use carrier-free receptor proteins that do not contain any carrier proteins or surfactants in the medium - their presence will inactivate adhesion.
- Adhesion of microbubbles in a small droplet: quickly check targeted adhesion in static conditions.
- Deposit a droplet of microbubbles (5-20 μL) from underneath onto the target (or control BSA-only) surface in a Petri dish that is inverted upside down. This will bring the bubbles to the receptor-coated surface by flotation.
- After 5-10 min incubation of the inverted dish in a moist environment, invert the dish back to a normal position, fill it with PBS and gently rinse to remove free microbubbles. Perform brightfield microscopy to assess targeted adhesion.
- Adhesion of microbubbles on Petri dish surface: perform targeting in a full dish1.
- Take the dish, which has receptor surface coating, and fill it completely with degassed PBS-BSA buffer (over 10 mL for the 35 mm dish), so that the meniscus of buffer extends over the top of the dish and is held by capillary force. Inject the bubbles (50 μL) into the bulk of the buffer and rapidly mix to achieve homogeneity. Avoid formation of air bubbles during mixing.
- Place a segment of transparent packaging tape or a culture plate sealer tape, backed with a flat piece of plastic over the dish quickly. Pressure-seal the film to the dish, invert the "assembly" and place it upside down for 30 min to allow the microbubbles float upwards, touch the target surface and adhere.
- Invert the sealed dish "assembly" back to "down-side-down" configuration, remove the seal, and wash away the non-adherent microbubbles by rinsing with degassed buffer solution. Observe targeted microbubbles by microscopy or by ultrasound imaging.
NOTE: When the inverted sealed dish completely filled with the microbubble dispersion is incubated, it can be placed at a slight angle, so if any large bubbles are present, they will float to the edge of the dish, outside of the center region of interest. Forced rinsing with fast flow coming from a micropipette tip during microscopy can be used to assess how firmly bubbles are adherent to the target (bubbles completely detach from control surface even in slow flow) 11. Degassed buffer is preferable for bubble dilution, because excess of dissolved air will lead to uncontrolled growth of microbubbles.
7. Test microbubble targeting in vitro: assess dynamic adhesion/retention assays in a parallel plate flow chamber
NOTE: We test the adhesion of biotinylated bubbles to streptavidin layer with ultrasound imaging.
- Use a commercially available parallel plate flow chamber with a custom-built inverter holder to observe targeted adhesion to a 35 mm Petri dish from flowing medium. After adsorption of target protein to the dish (see 6.1.1), insert the chamber body with preinstalled gasket in the dish and seal it in the holder. Use gaskets with channel height (i.e., gasket thickness) 0.127 mm and channel width 2.5 mm.
NOTE: During the assembly of parallel plate flow chamber, the amount of silicon grease used on the gasket should be minimal. Do not allow grease to get in the channel area: avoid covering the biomarker protein-coated surface with grease. To achieve a proper seal, select 35 mm dishes carefully (see Table of Materials for the chamber and dish information). - For the flow chamber assembly, do not screw the cap and frame that holds the dish-flow chamber combination too tightly, to avoid leakage.
- Connect the flow tubing to a syringe pump operated in a withdrawal mode, and on the feeder side, connect a thin polyethylene tubing (PE50) to the vial with a dilute microbubble dispersion, subjected to constant mixing with a stir bar via a magnetic stirrer12. Control the wall shear rate (WSR) parameter of the chamber by adjusting the pump volumetric flow rate based on the formula 6Q/bh2, where Q is the flow rate, 'b' is width of the channel, and 'h' is height of the channel.
NOTE: Remove the air bubbles from the entire system prior to perfusion of the microbubble-containing medium or PBS, as any air bubble passing through the channel will dislodge adherent microbubbles from the target surface, and invalidate the experiment. Connection between the flow chamber tubing and the syringe must be properly sealed. - Prepare a microbubble dispersion by adding a calculated volume of concentrated bubbles to the microbubble reservoir (a 20 mL scintillation vial) to achieve concentration of 106 microbubbles/mL, in PBS buffer with 0.1% BSA. Place the feeder reservoir on a magnetic plate stirrer. Insert a 1 cm x 2 cm magnetic stir bar and stir at ~400 RPM to maintain homogeneity during the course of the study.
- Perform ultrasound imaging of the flow chamber in a water tank13.
- Submerge the flow chamber assembly in degassed water and hold it in place by a weight to prevent movement during experiments.
- Place the imaging probe clamped directly above the channel, and tilt it at a 15° angle backwards, as well as a 5° angle clockwise to minimize specular reflection from the dish surface. Position the flow chamber channel within the imaging plane.
- Use the following imaging conditions: 15L8 transducer, contrast-specific imaging mode, dynamic range 50 dB, 7 MHz, Mechanical Index (MI) = 0.18, CPS Gain = 0. Keep the time gain compensation uniform across the entire image.
- Place the transducer face so it is touching the water surface, not deeply immersed. Alternatively, use a rubber protective sleeve filled with ultrasound gel.
NOTE: To warrant reproducible positioning of the flow chamber system for imaging, the markers should be placed on the water basin, or on the ultrasound system screen.
- Draw the microbubble dispersion from the reservoir through the chamber and into the pump for 2 min.
- Switch the flow to PBS, to remove non-adherent bubbles from the channel and assess acoustic backscatter of the remaining adherent (targeted) bubbles. To obtain a background image, increase the MI to 1.9 to destroy the adherent bubbles in the ultrasound imaging field of view.
NOTE: Microbubble dispersion should be replaced for repeated runs: at high dilution, microbubbles gradually degrade with time.
- Switch the flow to PBS, to remove non-adherent bubbles from the channel and assess acoustic backscatter of the remaining adherent (targeted) bubbles. To obtain a background image, increase the MI to 1.9 to destroy the adherent bubbles in the ultrasound imaging field of view.
- Export individual images from the screen recording video stream: before PBS flushing, after flushing, and after destruction, to be imported into ImageJ for offline analysis. Select the region-of-interest (ROI) to exclude the inlet and outlet portions of the chamber. After subtraction of the background ROI signal, quantify the echo intensity as the mean pixel intensity within ROI.
NOTE: As an alternative to ultrasound imaging, the adhesion of microbubbles to the target surface can be observed by video microscopy, when the parallel plate flow chamber assembly in the inverted holder is placed on a stage of a compound microscope, with video recording 5,11,12,14. This is especially useful for imaging targeted adhesion of microbubbles to cell surface biomarker receptors in cell culture, when receptor-expressing cells are grown on the tissue culture dish, and the number of microbubbles bound to each target cell can be counted directly.
Results
Covalent coupling of peptide and lipid
Reaction completion and desired product formation was confirmed by TLC. A separate unreacted peptide control did not move up during TLC: it was retained at the start, and its spot was positive for the primary amino group, as observed after ninhydrin spray, upon heating. This ninhydrin-positive free peptide spot was no longer observed in the mixture following reaction completion, following TLC of the reaction mixture sample, after the removal of DIPEA, DMSO, and re-dissolution in chloroform. As for the crucial issue of NHS ester reagent quality, Figure 1 presents spectrophotometric track of hydrolysis kinetics, with the zero time point at the beginning of the reaction being when the NHS ester in an organic solvent was added to the cuvette. This confirms the functionality of NHS active ester of carboxy-PEG-DSPE (see Methods Section 1). At the zero time point, the extrapolated A260=0.33 represents the material that was already hydrolyzed prior to testing. At the completion of the hydrolysis reaction, in excess of 10-15 min, A260=1.54 (when absorbance does not increase considerably anymore). This confirms the presence of active ester. It also provides quantitative data, that over 78% of the material is not pre-hydrolyzed NHS, and can be thus successfully used for peptide coupling, with the proper adjustment of the reagent amount.
Preparation and transfer of lipid material from the aqueous media onto the bubble shell: fluorescence lipid
The microbubbles for this study were prepared to contain a trace amount (under 1%) of the fluorescent dye DiI, with characteristic red fluorescence, that was added as a solution in PG to the saline-PG solution of DSPC and PEG stearate. Resulting microbubbles clearly demonstrate shell fluorescence when green light excitation and red emission filters are used in the microscope (see Figure 2, left). Brightfield microscopy of microbubble gas phase (Figure 2, right) can be compared with microbubble shell fluorescence. For the quantitative assessment of lipid material transfer from the aqueous phase to the bubble shell, microbubbles were floated using centrifugation, and the fluorescence signal of the clear infranatant phase was compared with the fluorescence of the initial solution, prior to microbubble amalgamation. Almost an order of magnitude signal reduction was observed (Figure 3), i.e., over 85% of the lipid material has transferred to the microbubble shell by amalgamation.
Preparation and size distribution correction of microbubbles
Microbubbles generated by amalgamation demonstrated a typical size distribution, with high concentration (e.g., ~4.8 x 10⁹ particles per mL for biotinylated bubbles). The size distribution was wide, with particles present within the measured range (between 1 and 30 µm); ~6.3% microbubbles exceed 5 µm in diameter (Figure 4, green curve). Intravascular administration of large microbubbles may lead to their nonspecific accumulation in the blood capillaries and should be avoided. A short (15-17 min) flotation of the inverted vial in normal gravity, with the subsequent collection of 0.3 mL close to the septum surface, allows removal of larger microbubbles completely, with minor loss in the total particle number concentration, down to ~4.6 x 10⁹: following flotation, only 0.01% of the particles in the purified sample have diameters over 5 μm (Figure 4, red curve).
Adhesion of microbubbles to receptor-coated surface: static assay
This procedure has been first described in the previous century1, and is being used as a quick test that confirms functionality of targeted microbubbles. Microbubbles are allowed to contact the receptor-carrying dish surface. If the ligand-receptor interaction takes place, bubbles may be retained on the surface despite the vigorous wash. An example of such a quick test of the functional adhesion of c(RGDfK)-microbubbles onto the surface coated with recombinant αvβ3 is presented. Figure 5 is a representative brightfield microscopy image of adherent microbubbles on the receptor surface in a Petri dish, following a wash with PBS, to remove unbound bubbles. Bubbles in this type of microscopy present as dark circular patterns. In similar condition, if the surface is only coated with albumin (to block nonspecific adhesion), microbubbles will not adhere and will be easily washed away even by the gentle rinse.
Binding of microbubbles from the flowing medium: parallel plate flow chamber
This procedure has been initially proposed as a tool for study of cell adhesion in a controlled flow setting15 and adapted for study of microbubble targeting decades later11. Testing in a flow-through system, unlike a static assay, is much more realistic for a clinical imaging scenario, where circulating bubbles in a flow of blood briefly touch the vessel wall and may adhere to it if the target receptor is present. Two examples of such studies are presented. The first example is a more traditional approach, where the adhesion of peptide-decorated microbubbles to the receptor-coated surface is monitored by video microscopy. Microscopy allows distinguishing adherent microbubbles from the flowing ones. It also allows to quantify those adherent microbubbles in the microscope imaging frame: many more c(RGDfK) microbubbles (left column) adhere to the surface, when compared with control, where scrambled c(RADfK) peptide is used, or if the surface is only coated with BSA (Figure 6).
The second example is contrast ultrasound imaging of the Petri dish coated with streptavidin (Figure 7, right side) to which biotinylated microbubbles adsorb successfully from the flowing medium, and can be detected by contrast ultrasound imaging following a flush with PBS. The control dish surface does not retain any adherent microbubbles from the flow, so essentially all ultrasound contrast signal is removed with PBS flow. Ultrasound contrast signal quantification shows strong statistical significance of the difference observed; the ratio of target and control signals exceeded an order of magnitude.
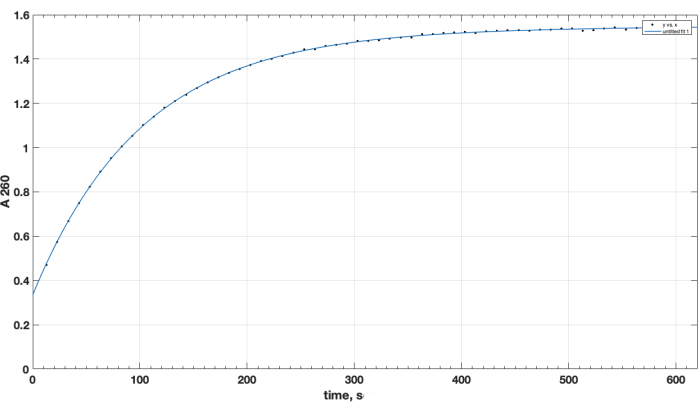
Figure 1. Kinetics of hydrolysis of NHS-PEG-DSPE active ester, observed by NHS release in alkaline medium by spectrophotometric testing at 260 nm wavelength. Zero time point is the time of addition of NHS-PEG-DSPE in organic solvent to the 0.1 M borate buffer, pH 9.2. Please click here to view a larger version of this figure.

Figure 2. Microscopy of gas-filled microbubbles following amalgamation. Left, fluorescence microscopy (green excitation, red emission, DiI lipid shell dye). Right, brightfield microscopy (gas phase observation), same magnification. Frame width, 85 um (10 μm stage micrometer embedded on bottom right of each image). Please click here to view a larger version of this figure.
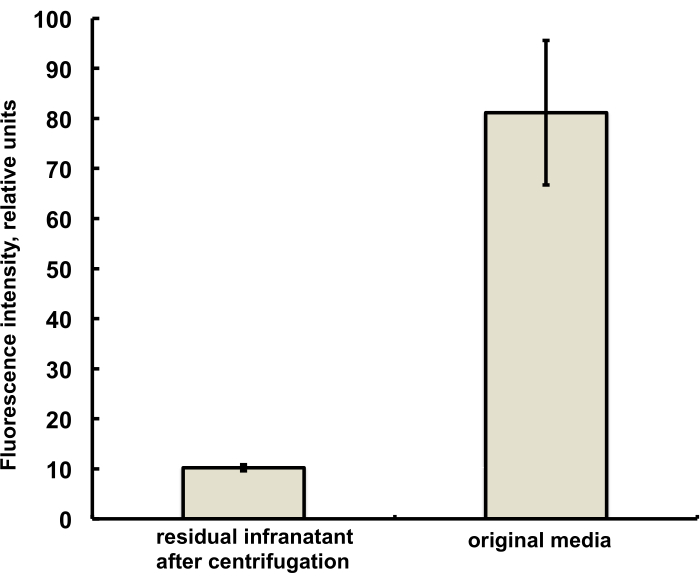
Figure 3. Fluorescence spectroscopy of DiI lipid dye sample from the microbubble preparation medium before amalgamation (right) and following amalgamation and removal of microbubbles by centrifugal flotation (left). Fluorescence excitation - 555 nm, emission - 620 nm. Data presented as Mean ± Standard Deviation. Please click here to view a larger version of this figure.

Figure 4. Particle size distribution of the number concentration of microbubbles following amalgamation preparation (green), with subsequent normal gravity flotation for the removal of large microbubbles (red) and diluent-only background count (blue). Electrozone sensing particle counting in normal saline, 50 µm orifice. Please click here to view a larger version of this figure.
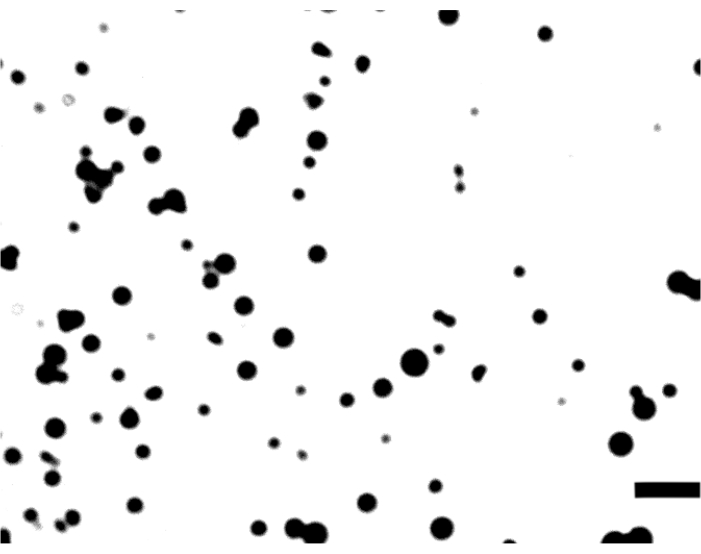
Figure 5. Brightfield microscopy of c(RGDfK)-microbubbles on a dish coated with αvβ3. Image frame width is 106 μm; bar is 10 μm. Please click here to view a larger version of this figure.
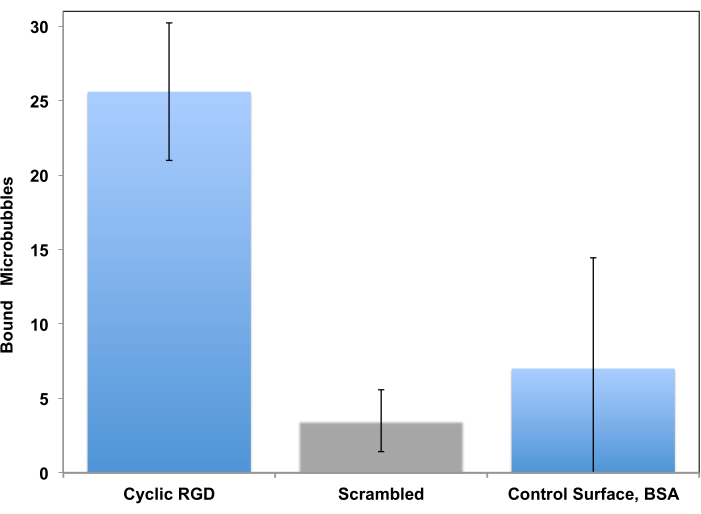
Figure 6. In vitro parallel plate flow chamber targeting of peptide-decorated microbubbles to the surface coated with recombinant αvβ3. cRGDfK-decorated microbubbles efficiently adhered to the dish (left), attachment of control non-targeted cRADfK (scrambled, center) microbubbles was minimal (p<0.00005), as was microbubble retention at the albumin-only control surface (right, p<0.0025). Chamber flow wall shear stress at 1 dyn/cm2. Microbubble adhesion monitored by video microscopy; the number of particles in the field of view is presented. Accumulation time is 4 min. Data presented as Mean ± Standard Deviation. Reprinted with permission from5. Copyright, 2018, American Chemical Society. Please click here to view a larger version of this figure.

Figure 7. Contrast ultrasound imaging of a parallel plate flow chamber following targeted adhesion and buffer flush of biotinylated microbubbles on the dish coated with streptavidin (middle, adherent targeted microbubbles, right, same dish, following high-MI ultrasound burst), and control dish coated only with albumin (left). Two minutes of perfusion of microbubble dispersion (PBS/BSA, 106 particles/mL) at 450 s-1 shear rate, followed by buffer flush. Quantification of ultrasound signal is performed from the regions of interest in the video frames after background subtraction. Please click here to view a larger version of this figure.
Discussion
The importance of a simple technique for the preparation of ligand-decorated microbubbles is evident. The use of amalgamation technique for microbubble preparation, as pioneered by Unger et al.,16 may serve this purpose for a number of reasons. Manufacturing of microbubbles by amalgamator is easy to perform. A small-footprint desktop single-phase 120 V unit is available and inexpensive. The procedure is quick (45 seconds) and efficient: 1 mL of microbubble dispersion in an aqueous medium is prepared at once. It contains billions of particles per mL, more than sufficient for research studies. Manufacturing occurs in a sealed vial with perfluorinated gas headspace. If necessary, vial contents will remain sterile from the time of aseptic filling, during manufacturing (amalgamation), and until use. This makes the approach relevant for clinical use, as it does not require elaborate preparations in a dedicated sterile environment in clinic.
The procedure is based on self-assembly: during mixing, as high shear is applied to gas-water interface within the moving vial, small gas fragments are formed, which assume spherical shape due to action of surface tension. PG, as a cosurfactant, present in the medium at high concentration, reduces surface tension and energy required to generate gas-water interface during shear. Next, more "classical" surfactants, such as PEG-lipids and phospholipids, which are present at much lower concentrations, get to the interface, most likely displacing PG and establishing a monomolecular layer at the bubble surface. This shell is reasonably stable; it is likely due to a combination of a "solid" lipid (DSPC phase transition temperature is 56 °C, so it is not prone to inter-membrane fusion) and an extended PEG brush coat that surrounds the microbubbles and inhibits direct monolayer contact of neighboring bubbles. One can speculate that the presence of a high concentration of PG in the media may lower the microbubble shell stability. In its absence, microbubbles are stable in the sealed vials under fluorocarbon atmosphere for many months, with only moderate fusion between the bubbles. For clinical use, with a small amalgamator device at the bedside, the interval between microbubble preparation and use can be short, minutes or hours. With PG present in the media, microbubble concentration does not show a significant drop, at least for several hours of refrigerated storage.
An added advantage of the described procedure (assisted by the use of PG cosurfactant in the bubble preparation medium) is high efficacy (>85%) of the lipid transfer to the shell, whereas the traditional sonication provides ~20% efficacy5 and modern microfluidic methods even lower17. High level of transfer efficiency is important not just because the waste of lipid material and expensive ligand is reduced, but because the amount of bubble-free ligand co-present in the media is minimized as well. Then the free ligand may not have an opportunity to block the biomarker target receptor to which the microbubbles are expected to bind via ligand on their surface. The general amount of the biomarker receptor on the target vasculature is often quite high, so this might not be of utmost importance. From the available patent literature18 one might suggest that at least 50% of lipid shell material and targeting ligand in the microbubble formulations in clinical testing may be associated with the bubble shell. This can be generally compared with radiolabeled antibodies or peptides that are widely used in nuclear medicine receptor imaging studies: most of those targeting ligand molecules actually do not carry "hot" radioisotope even for the highest specific activity reported19, whereas for targeted microbubbles, the shell material in this study (including ligand-lipid) is mostly attached to microbubbles.
Selective adhesion of targeted microbubbles prepared by this technique in vitro was demonstrated, in two sets of targeting models: static adhesion, and a flow chamber targeting experiment. In a static assay, targeted microbubbles adhered to the target receptor layer tightly and were not dislodged with buffer rinse, unlike in a control setting, where microbubbles were removed from the surface even with a gentle rinse. Likewise, in a flow-through test, performed in a parallel plate flow chamber, biotinylated bubbles demonstrated statistically significant and superb adhesion to streptavidin layer on a polystyrene dish, when compared with the control albumin-only surface. Peptide c(RGDfK)-decorated microbubbles selectively adhered to αvβ3-coated surface, both in the static adhesion assay, and in a parallel plate flow chamber.
The following issues can be considered as the limitations of the described protocol. First, the procedure does not account for the submicron particles. The instrument that was used in the study was not set up to detect nanobubbles (i.e., particles under 1 μm in diameter). These particles might have been present in the formulation. Although their acoustic backscatter signal is generally known to be low, and they were not observed in this study by microscopy, the presence of nanobubbles should still be considered. The second significant issue is the size heterogeneity of the microbubbles. Despite the removal of larger particles, the size of the resulting bubbles is far from uniform. This should be a consideration and justification for further research in the area of microbubble formulation.
In conclusion, the narrative given in this manuscript should provide sufficient level of technical detail to manufacture targeted microbubbles quickly and easily. The steps to perform additional purification (if desirable), adjusting the size and/or assessing the small amount of the shell material that remains in the aqueous medium are provided. The detailed analytical tools for the assessment of the microbubble parameters, such as size distribution and concentration, and in vitro ability of ligand-decorated microbubbles to adhere to target receptors are described.
Disclosures
A. Klibanov is a co-founder and minority shareholder of Targeson Inc, a startup in the area of preclinical targeted microbubbles, now dissolved. His UVA laboratory has a subcontract via NIH R44 HL139241 from SoundPipe Therapeutics.
Acknowledgements
A.L. Klibanov acknowledges support in part via NIH R01EB023055, awarded by the National Institute of Biomedical Imaging and Bioengineering of the National Institutes of Health, a subcontract to University of Virginia via NIH R01NS076726, awarded to UCSF by National Institute of Neurological Disorders and Stroke of the National Institutes of Health, and a subcontract to University of Virginia via NIH grant R44HL139241, awarded to SoundPipe Therapeutics by National Heart, Lung, and Blood Institute. The content of this publication is solely the responsibility of the author and does not necessarily represent the official views of the National Institutes of Health.
Materials
| Name | Company | Catalog Number | Comments |
|---|---|---|---|
| Amalgamator | Lantheus, Billerica, MA. | Vialmix | ESPE Capmix, Wig-L-Bug or another amalgamator capable of 4300 rpm can be used. |
| biotin-PEG3400-DSPE | Laysan Bio, Arab, AL. | Biotin-PEG-DSPE-3400 | |
| Bovine Serum Albumin (BSA) | Fisher Scientific, Waltham, MA | BP1600-100 or similar | |
| Ca-Mg-free PBS | Fisher Scientific, Waltham, MA | 14190-144 | |
| Centrifuge with a bucket rotor | IEC/Thermo, Fisher Scientific, Waltham, MA. | NH-SII | Any centrifuge with a bucket rotor |
| chloroform | Fisher Scientific, Waltham, MA | C297-4 | |
| cyclic (RGDfK) peptide | AnaSpec, Fremont, CA | AS-61111 | |
| Decafluorobutane | F2 Chemicals, Preston UK | CAS 355-25-9 | |
| DiI | Sigma-Aldrich, St. Louis, MO. | 468495-100MG | |
| DIPEA | Sigma-Aldrich, St. Louis, MO. | 387649 | |
| Disposable UV cuvette, 1.5 ml | BrandTech, Essex, CT. | 759150 | |
| DMSO | Sigma-Aldrich, St. Louis, MO. | 276855 | |
| Dry block heater, high temperature | Techne Cole Palmer, Staffordshire UK | DB-3A | |
| DSPC | Lipoid, Ludwigshafen, Germany | LIPOID PC 18:0/18:0 | |
| Fluorescence microplate reader | Molecular Devices, San Jose, CA. | Spectramax Gemini XS | No longer available, superceded by Gemini XPS; any fluorescence plate reader with red dye detection capability will work |
| Microscope with fluorescence epi-illumination. | Leica | Laborlux 11 | No longer available; any fluorescence microscope is sufficient; high-sensitivity video camera is required for image stream collection |
| NHS-PEG3400-DSPE | NOF-America, White Plains, NY. | SUNBRIGHT DSPE-034GS | Some of the alternative manufacturers provide material that is mostly, or completely, hydrolyzed on arrival |
| Ninhydrin spray for TLC plates | BVDA, Haarlem, The Netherlands | AS-72177 | |
| Normal saline irrigation solution (0.9% NaCl) | Baxter, Deerfield IL. | 2F7124 | |
| Parallel plate flow chamber, for 35mm Corning Petri Dish | Glycotech, Gaithersburg, MD. | 31-001 | May only work with Corning Petri dishes, but not necessarily with other makers, due to different dimensions |
| Particle sizing system | Beckman Coulter, Hialeah, FL | Multisizer 3 | No longer available, superceded by Multisizer 4, with similar electrozone sensing principle. Alternatively, optical methods, e.g., Accusizer, can be used. |
| PEG 6000 monostearate | Kessco Stepan, Joliet, IL. | CAS 9004-99-3 | |
| Petri Dishes, 35 mm diameter, 10 mm tall | Corning, Corning, NY. | 430165 | |
| Plastic coverslips, 22x22mm | Cardinal Health, McGaw Park, IL. | M6100 | |
| Propylene glycol | Sigma-Aldrich, St. Louis, MO. | P4347 | |
| Recombinant murine alphavbeta3, carrier-free | R&D Systems, Minneaposis, MN. | 7889-AV-050 | |
| Rubber stoppers, 13mm | Kimble-Chase, Vineland, NJ | W017900 | |
| Serum vials, 2 ml, 13mm | Kimble-Chase, Vineland, NJ | 223683 | |
| Silica TLC Plates, F254 | Analtech, Newark, DE | P02521 | |
| Sodium tetraborate | Sigma-Aldrich, St. Louis, MO. | S9640 | |
| Streptavidin | AnaSpec, Fremont, CA | AS-72177 | |
| Syringe pump, infuse/withdraw option | Harvard Apparatus, Holliston, MA | PHD2000, 70-2001 | |
| Ultrasound imaging system with contrast-specific mode. | Siemens/Acuson, Mountain View CA | Sequoia c512, 15L8 probe | Old generation Sequoia is out of production for more than a decade. Available as used equipment. CPS mode has to be unlocked for the 15L8 transducer. |
| UV Spectrophotometer | Beckman, Brea, CA. | DU640 | No longer available, may be replaced with any 260 nm ultraviolet-capable unit |
References
- Klibanov, A. L., et al. Targeting of ultrasound contrast material - An in vitro feasibility study. Acta Radiologica. 38, 113-120 (1997).
- Wright, W. H., et al. Evaluation of new thrombus-specific ultrasound contrast agent. Academic Radiology. 5, Suppl 1 240-242 (1998).
- Willmann, J. K., et al. Ultrasound Molecular Imaging With BR55 in Patients With Breast and Ovarian Lesions: First-in-Human Results. Journal of Clinical Oncology. 35, 2133-2140 (2017).
- Smeenge, M., et al. First-in-Human Ultrasound Molecular Imaging With a VEGFR2-Specific Ultrasound Molecular Contrast Agent (BR55) in Prostate Cancer: A Safety and Feasibility Pilot Study. Investigative Radiology. 52, 419-427 (2017).
- Unnikrishnan, S., Du, Z., Diakova, G. B., Klibanov, A. L. Formation of Microbubbles for Targeted Ultrasound Contrast Imaging: Practical Translation Considerations. Langmuir. 35, 10034-10041 (2019).
- Kaufmann, B. A., et al. High-resolution myocardial perfusion imaging in mice with high-frequency echocardiographic detection of a depot contrast agent. Journal Info. American Society of Echocardiography. 20, 136-143 (2007).
- Yeh, J. S. M., et al. A Targeting Microbubble for Ultrasound Molecular Imaging. Plos One. 10, (2015).
- Alley, S. C., et al. Contribution of linker stability to the activities of anticancer immunoconjugates. Bioconjugate Chemistry. 19, 759-765 (2008).
- Helfield, B. L., Huo, X., Williams, R., Goertz, D. E. The effect of preactivation vial temperature on the acoustic properties of Definity. Ultrasound in Medicine and Biology. 38, 1298-1305 (2012).
- Morgan, K. E., et al. Experimental and theoretical evaluation of microbubble behavior: effect of transmitted phase and bubble size. IEEE Transactions on Ultrasonics, Ferroelectrics, and Frequency Control. 47, 1494-1509 (2000).
- Klibanov, A. L., et al. Targeting and ultrasound imaging of microbubble-based contrast agents. Magnetic Resonance Materials in Physics, Biology and Medicine. 8, 177-184 (1999).
- Takalkar, A. M., Klibanov, A. L., Rychak, J. J., Lindner, J. R., Ley, K. Binding and detachment dynamics of microbubbles targeted to P-selectin under controlled shear flow. Journal of Controlled Release. 96, 473-482 (2004).
- Hernot, S., et al. Nanobody-coupled microbubbles as novel molecular tracer. Journal of Controlled Release. 158, 346-353 (2012).
- Ferrante, E. A., Pickard, J. E., Rychak, J., Klibanov, A., Ley, K. Dual targeting improves microbubble contrast agent adhesion to VCAM-1 and P-selectin under flow. Journal of Controlled Release. 140, 100-107 (2009).
- Hochmuth, R. M., et al. Surface Adhesion, Deformation and Detachment at Low Shear of Red-Cells and White Cells. Transactions American Society for Artificial Internal Organs. 18, 325-334 (1972).
- Unger, E. C., et al. Method of preparing gas and gaseous precursor-filled microspheres. US patent. , US Patent 5,585,112 (1996).
- Segers, T., de Rond, L., de Jong, N., Borden, M., Versluis, M. Stability of Monodisperse Phospholipid-Coated Microbubbles Formed by Flow-Focusing at High Production Rates. Langmuir. 32, 3937-3944 (2016).
- Schneider, M., Brochot, J., Puginier, J., Yan, F. Stable microbubble suspensions comprising saturated phospholipids for ultrasound echography. US Patent. , US Patent 5,686,060A (1997).
- Breeman, W. A. P., et al. Radiolabelling DOTA-peptides with Ga-68. European Journal of Nuclear Medicine and Molecular Imaging. 32, 478-485 (2005).
Reprints and Permissions
This article has been published
Video Coming Soon