Compared to conventional transforaminal endoscopic surgery, full-endoscopic foraminoplasty and lumbar discectomy (FEFLD) is a unique technique that allows full visualization of foraminoplasty and reduces the need for intraoperative fluoroscopies. This article describes the surgical steps involved in the FEFLD technique, shedding light on surgical tips and potential pitfalls to ensure outstanding performance.
Method Article
Full-Endoscopic Foraminoplasty and Lumbar Discectomy for Single-Level Lumbar Disc Herniation
Hengrui Chang*1 , Zhaohui Li*2 , Yiwen Zhang3 , Wenyuan Ding1
drdingwy@163.com
691858531@qq.com
Corresponding Authors: Wenyuan Ding <drdingwy@163.com>, Jiaxin Xu <691858531@qq.com>
* These authors contributed equally
Opens in a new tab
In This Article
Summary
Loading...
$$\rightleftharpoonup{xx}$$
$$\longleftharp{xx}$$,
$$\longrightharp{xx}$$,
Abstract
Loading...
$$\rightleftharpoonup{xx}$$
$$\longleftharp{xx}$$,
$$\longrightharp{xx}$$,
The Transforaminal Endoscopic Surgical System (TESSYS) technique has gained popularity for the treatment of lumbar disc herniations. Foraminoplasty is the key procedure in TESSYS. However, it requires advanced skills and long-term learning, which hinder its widespread adoption among surgeons. Recently, the introduction of full-endoscopic solutions has made the process more manageable. The main difference from traditional single-portal endoscopic surgery is that full-endoscopic surgery is equipped with a larger working channel, allowing full visualization of foraminoplasty and decreasing reliance on intraoperative fluoroscopy. Recently, published studies have shown that full-endoscopic foraminoplasty and lumbar discectomy (FEFLD) could achieve comparable results to conventional microdiscectomy in terms of pain relief and functional outcomes, while enhancing postoperative recovery. This study describes the technique of FEFLD in detail, including every crucial step, such as patient positioning, puncture trajectory, endoscopic dissection of the superior articular process (SAP), endoscopic foraminoplasty, and more. We hope this will be helpful to beginners who wish to apply this approach.
Introduction
Loading...
$$\rightleftharpoonup{xx}$$
$$\longleftharp{xx}$$,
$$\longrightharp{xx}$$,
Percutaneous endoscopic transforaminal discectomy (PETD) is a well-accepted technique for the surgical treatment of lumbar disc herniation (LDH)1,2. The significant advantages of PETD include fast recovery to daily activities, a lower risk of spinal destabilization, and reduced wound complications2,3,4. Although various approaches have been developed over the decades, the anatomical basis of each PETD originates from the concept of a safe transforaminal triangle proposed by Parviz Kambin5. The Yeung endoscopic spine system (YESS) and transforaminal endoscopic spine system (TESSYS) are the two most representative techniques that have greatly promoted the development of PETD6,7.
Technique modifications based on TESSYS have significantly expanded the surgical indications for PETD, such as central disc herniations, highly migrated disc herniations, lateral recess stenosis, recurrent LDHs, and others8,9,10,11,12. The biggest innovation in TESSYS is the performance of outside-in transforaminal foraminoplasty prior to the insertion of the working channel7. After the gradual resection of the ventral part of the superior articular process (SAP), the working channel can be placed into the spinal canal through the lower part of the intervertebral foramen, allowing direct exposure and decompression of the nerve root.
However, conventional multi-step foraminoplasty is challenging for most beginners2,13,14. Performing successful foraminoplasty heavily relies on fluoroscopic guidance and years of experience. This process has been associated with exiting root injury, which hinders the fast recovery of patients15,16. The reported incidence of exiting root injury varies from 1% to 8.9% in transforaminal endoscopic surgery15,17,18,19,20. Although the introduction of innovative instruments, such as the eccentric trephine and the duck-mouth protective cannula, has greatly reduced technical difficulties, it still involves complicated surgical procedures with repeated fluoroscopies9,21.
The full-visualized foraminoplasty has been proposed to address this issue. In 2020, Chen et al. first reported full-endoscopic foraminoplasty with the aid of a periendoscopic trephine in the treatment of LDHs22. Benefiting from the larger protective cannula, the endoscope, and the trephine can work simultaneously for full visualization of foraminoplasty. Meanwhile, the inner diameter of the working channel is further enlarged, which can be adapted to efficient surgical instruments. Besides, the expanded endoscopic field of view (FOV) allows the surgeon to identify more anatomical structures, which is friendly to beginners with open operative experience. Our recent clinical study showed that full-endoscopic foraminoplasty and lumbar discectomy (FEFLD) could yield comparable functional outcomes to conventional microdiscectomy (MD) in treating single-level LDHs without neural complications occurring23. Other clinical series also showed the advantages of FEFLD in treating disc herniation and lumbar stenosis of the lateral recess24,25.
Herein, we performed a detailed step-by-step description of the FEFLD surgical technique, shedding light on surgical tips and pitfalls for outstanding performance. The procedure is structured in consecutive stages from the preoperative phase to the end of the operation: patient positioning, the trajectory of puncture, endoscopic dissection of the superior articular process (SAP), endoscopic foraminoplasty, endoscopic discectomy, and others. We also described the clinical outcomes of 30 consecutive patients who underwent FEFLD between December 2022 and May 2023.
Protocol
Loading...
$$\rightleftharpoonup{xx}$$
$$\longleftharp{xx}$$,
$$\longrightharp{xx}$$,
The protocol follows the guidelines of the Ethics Committee of the Third Hospital of Hebei Medical University. Written informed consent was obtained from all patients presenting with unilateral sciatica due to lumbar disc herniation. These symptoms persisted for more than 12 weeks and were refractory to conservative treatment. Exclusion criteria included the presence of cauda equina syndrome, spondylolisthesis, central canal stenosis, and previous spinal surgery at the same level. All eligible patients underwent examination and questioning by the same spine surgeon. The pieces of equipment necessary for the surgery are listed in the Table of Materials.
1. Patient position and skin marking
- Position the patient in a prone position on a foam-prone mattress and flex the hip joint to reduce lumbar lordosis (Figure 1).
NOTE: Maintaining good flexion of the hip and knee joints facilitates the patient's adaptation to the prone position under local anesthesia. - Using C-arm fluoroscopy guidance, mark the horizontal line of the intervertebral disc (Figure 2A). Outline the superior border of the iliac crest for L4-5 or L5-S1 disc herniation.
- Mark the paraspinal skin entry point along the horizontal disc line for LDH at and above L4-5 (Figure 2B). This entry point is typically 10-14 cm lateral to the midline of the spinous process, depending on the patient's waist size.
NOTE: In practice, it is relatively straightforward to position the working cannula along the intervertebral space with minimal intraoperative fluoroscopies (approximately 5 times). For a down-migrated herniation, the needle's entry point should begin slightly above the disc level in a slight cephalic direction.
2. Local anesthesia and needle puncture
- Subcutaneously infiltrate around the entry point with 2 mL of 1% lidocaine, followed by infiltrating the intended trajectory with 8-10 mL of 1% lidocaine through an 18 G needle.
NOTE: When the needle passes through the thoracolumbar fascia, care should be taken to administer anesthetic doses. - Direct the needle tip towards the ventral portion of the superior articular process (SAP) or pass the needle through the ventral margin of SAP and into the spinal canal.
- In the anteroposterior (AP) view, halt the needle tip at the exterior margin of SAP, and in the lateral view, halt it at the ventral SAP (Figure 3A). Alternatively, in the AP view, stop the needle tip at the medial pedicle line, and in the lateral view, stop it at the posterior rim of the intervertebral disc (Figure 3B). Administer local anesthesia at this point by injecting 4-6 mL of 1% lidocaine.
NOTE: In FEFLD, the target of needle puncture is not strictly limited to the extruding or sequestrated fragment.
3. Insertion of the endoscope
- Remove the needle core and insert a guidewire through the needle.
- Create an 8 mm incision centered on the entry point and place the sequential dilators along the guidewire.
- Introduce a U-head working cannula with an inner diameter of 9 mm over the final dilator and firmly dock the cannula head with the SAP (Figure 4A). Ensure the location of the working cannula with anteroposterior (AP) and lateral radiographs (Figure 4B).
- Introduce the endoscope into the working cannula; no additional fluoroscopy is required.
4. The endoscopic dissection of SAP
- Utilize the nucleus forceps to remove the soft tissues around the superior articular process (SAP) and expose the osseous part of SAP.
- Employ the flexible curved tip of the radiofrequency probe to identify and palpate the anatomical landmarks of SAP. Three landmarks need to be identified: the upper tip of the SAP, the upper notch of the pedicle, and the dorsal space of the intervertebral foramen (Figure 5A-C). Avoid excessive disturbance around the pedicle to minimize intraoperative bleeding.
NOTE: Clear identification of these landmarks provides the surgeon with a comprehensive understanding of the size of the ventral portion of the SAP and assists in determining the extent of subsequent foraminoplasty (Figure 6).
5. The endoscopic foraminoplasty
- Insert the trephine and the endoscope into the cannula once the dissection of the superior articular process (SAP) is completed.
- Carefully rotate and advance the trephine along the working cannula under the guidance of the endoscope (Figure 7). Monitor the depth at which the trephine enters by observing the scale on its inner surface.
- Halt the drilling once any rotation of the osseous core is noted. Remove the sawn bone cylinder entirely or in pieces with forceps. During this process, the assistant is responsible for holding the endoscope, while the surgeon controls the working cannula and the trephine.
NOTE: Initially, the position of the trephine may shift, potentially causing irritation of the exiting nerve root during foraminoplasty. To address this, a hammer can be used to gently tap the serrated head of the trephine into the bone before rotating it for final foraminoplasty.
6. The endoscopic discectomy
- Insert the longer T-head inner working cannula with an inner diameter of 7.9 mm and lock it with the U-head cannula once the foraminotomy is achieved.
NOTE: Direct the inner working cannula to the area of the extruding or sequestrated fragment. - Use the Kerrison rongeur to resect the ligamentum flavum and expose the epidural fat (Figure 8A). Subsequently, remove the intradiscal fragments using forceps until the posterior longitudinal ligament is clearly visible (Figure 8B).
- Employ punch forceps to resect the posterior longitudinal ligament completely, removing any migrated or sequestered discs (Figure 8C). Confirm that the traversing nerve root is free from compression by observing the pulsation of the nerve root (Figure 8D).
NOTE: In cases of highly down-migrated disc herniation, move the working cannula caudally and further enlarge the intervertebral foramen using the high-speed drill under continuous visualization. Subsequently, the migrated fragments can be detected and successfully removed. - Close the wound after achieving careful hemostasis using a radiofrequency coagulator.
7. Postoperative management
- Encourage patients to stand or walk while wearing a custom-made rigid lumbar brace on postoperative day 2.
NOTE: It is important to avoid vigorous physical activity during the first 4-6 weeks postoperatively.
Results
Loading...
$$\rightleftharpoonup{xx}$$
$$\longleftharp{xx}$$,
$$\longrightharp{xx}$$,
Outcome evaluation
Pain intensity and quality of daily living were assessed using the visual analog scale (VAS) for leg pain and back pain (scored from 0 to 10) and the Oswestry Disability Index (ODI) preoperatively2, at 1 week postoperatively, and at 3 months postoperatively. Patient satisfaction was evaluated according to the modified MacNab criteria25 (excellent, good, fair, and poor).
Baseline characteristics
A total of thirty patients with single-level symptomatic lumbar disc herniation (LDH) were included in this study (L3/4: n = 3, L4/5: n = 19, and L5/S1: n = 8). The baseline characteristics of the subjects included are provided in Table 1. The mean age of the patients was 43.5 ± 16.4 years (range, 17-73 years), and the male-to-female ratio was 1:1. The distribution of herniation types was as follows: central: n = 6, paracentral: n = 14, prolapsed/sequestered: n = 10. The mean operative time was 84.8 ± 16.6 min (range, 45-110 min), and the mean length of hospital stay was 3.1 ± 0.7 days (range, 2-5 days). The average usage of intraoperative fluoroscopy was 9.6 ± 3.1 times (range, 5-16 times).
Complications
During surgery, three cases of transient dorsal root irritation were noted. Additionally, one case of wound hematoma and one case of early recurrence were diagnosed postoperatively. Of these two patients, one required conservative treatment, and the symptoms were relieved within 3 months after surgery, while the other patient underwent revision FEFLD.
Clinical and functional outcomes
Significant improvement in leg pain was observed at 1 week after surgery, with a mean decrease from 7.7 ± 1.7 to 2.1 ± 1.1 on the visual analog scale (VAS). At 3 months after surgery, the mean VAS for leg pain decreased further to 1.7 ± 1.5, and the mean VAS for back pain decreased from 4.0 ± 2.3 preoperatively to 1.6 ± 1.3. The mean Oswestry Disability Index (ODI) decreased from 56.5 ± 14.6 preoperatively to 7.8 ± 10.1 at 3 months postoperatively (Table 1). According to the MacNab criteria, excellent results were observed in 12 patients (40.0%), good results in 16 patients (53.3%), and fair results in 2 patients (6.7%).
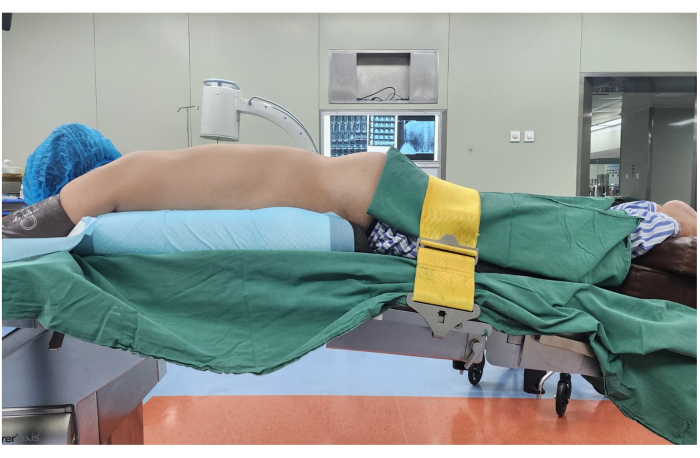
Figure 1: Patient positioning. The patient is placed in a prone position on a foam-prone mattress with good flexion of the hip and knee joint. Please click here to view a larger version of this figure.
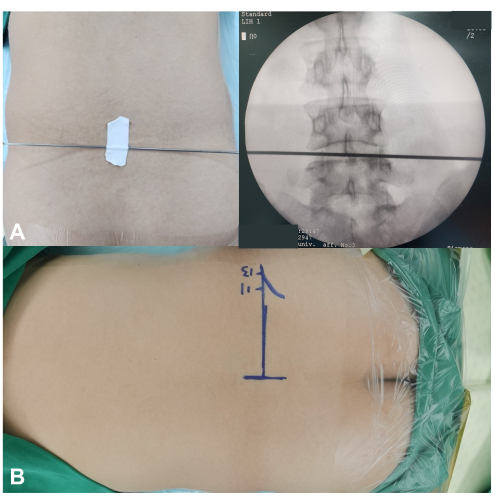
Figure 2: Skin markers and skin entry point in FEFLD surgery. (A) The horizontal line of the intervertebral disc is marked under the guidance of C-arm fluoroscopy with anteroposterior (AP) view. (B) The markers of the skin entry point along the horizontal disc line for LDH at L4-5. Please click here to view a larger version of this figure.

Figure 3: The trajectory of needle puncture. (A) The needle tip is aimed at the ventral portion of SAP and stopped at the exterior margin of SAP in the AP view and at the ventral SAP in the lateral view. (B) The needle tip passes through the ventral margin of SAP and into the spinal canal. The needle tip lies at the medial pedicle line in the AP view and at the posterior rim of the intervertebral disc in the lateral view. Please click here to view a larger version of this figure.
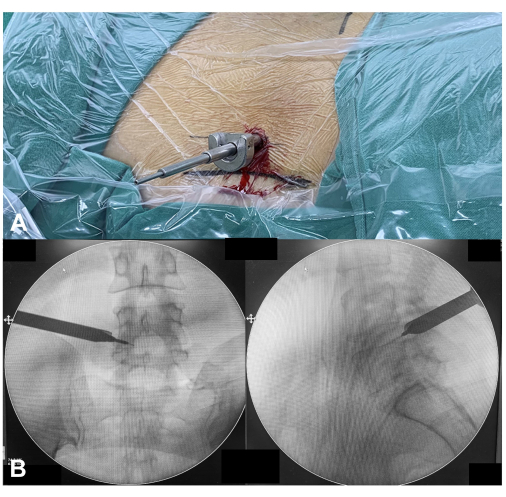
Figure 4: Insertion of endoscope. (A) A U-head working cannula is introduced over the final dilator. (B) The AP and lateral radiographs are needed to ensure the working cannula is firmly docked with the SAP. Please click here to view a larger version of this figure.
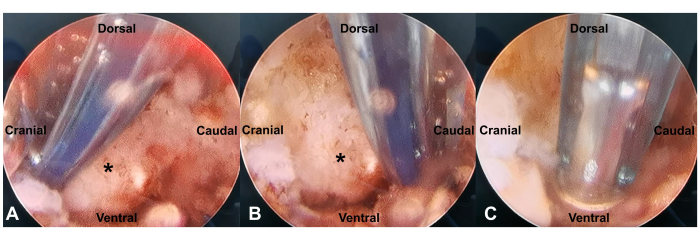
Figure 5: The detection of anatomical landmarks of SAP (asterisk). Three landmarks need to be identified: the upper tip of the SAP (A), the upper notch of the pedicle (B), and the dorsal space of the intervertebral foramen (C). Please click here to view a larger version of this figure.
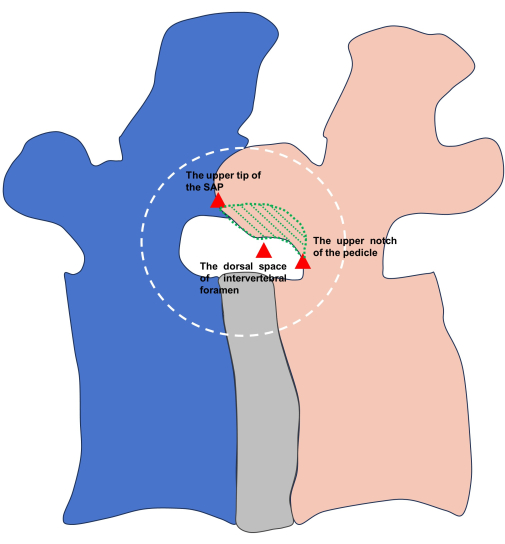
Figure 6: The demonstration of the three landmarks around SAP (red triangles). The ventral portion (the green zone) needs to be resected during subsequent foraminoplasty. Please click here to view a larger version of this figure.
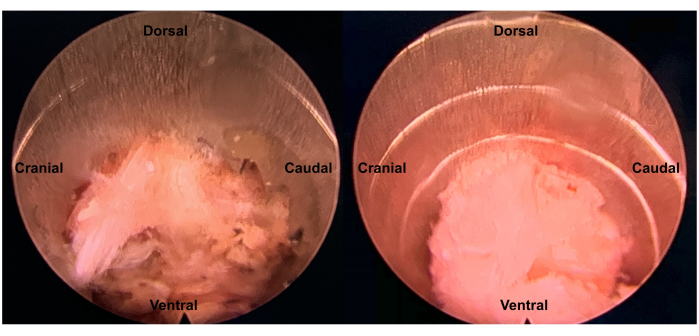
Figure 7: Endoscopic foraminoplasty. Under endoscopic guidance, the trephine is rotated and carefully advanced along the working cannula. The depth at which the trephine enters is recorded by the scale on its inner surface. Please click here to view a larger version of this figure.
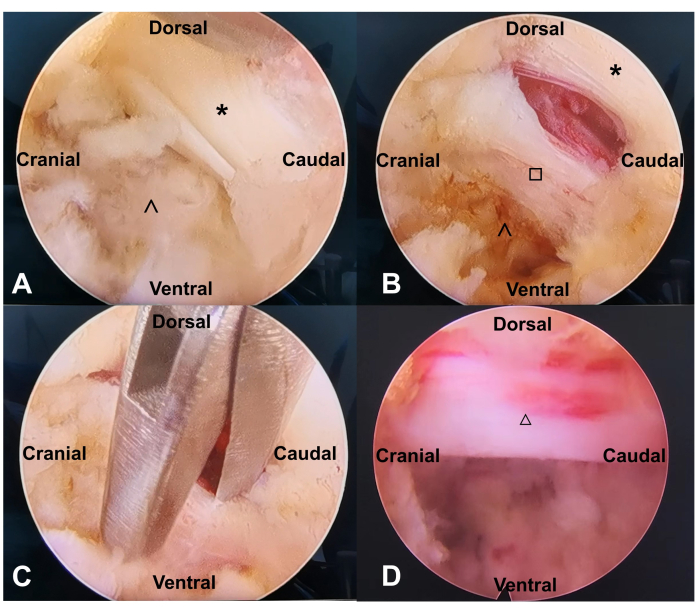
Figure 8: The process of endoscopic discectomy. (A) The space between the ligamentum flavum (asterisk) and disc (arrow) is revealed once the foraminoplasty is done. (B) The posterior longitudinal ligament (square) is easily seen during intradiscal decompression. (C) The posterior longitudinal ligament is partially resected using punch forceps to identify the sequestered discs. (D) The traversing nerve root (triangle) moves freely during Valsalva's maneuver. Please click here to view a larger version of this figure.
| Parameters | Values (n = 30 patients) | |
| Age, y | 43.5 ± 16.4 | |
| Male sex, No (%) | 15 (50.0) | |
| BMI, kg/m2 | 26.0 ± 3.4 | |
| Affected level, No (%) | ||
| L3-4 | 3 (10.0) | |
| L4-5 | 19 (63.3) | |
| L5-S1 | 8 (26.7) | |
| Type of herniation, No (%) | ||
| Central | 6 (20.0) | |
| Paracentral | 14 (46.7) | |
| Prolapsus/sequestered | 10 (33.3) | |
| Preoperative | Postoperative (3 months after surgery) | |
| ODI score | 56.5 ± 14.6 | 7.8 ± 10.1 |
| VAS for BP | 4.0 ± 2.3 | 1.6 ± 1.3 |
| VAS for LP | 7.7 ± 1.7 | 1.7 ± 1.5 |
Table 1: Patient characteristics of the FEFLD technique. FEFLD: Full-endoscopic foraminoplasty and lumbar discectomy. BP: Back pain. LP: Leg pain. BMI: Body mass index. VAS: Visual Analog Scale. ODI: Oswestry Disability Index.
Discussion
Loading...
$$\rightleftharpoonup{xx}$$
$$\longleftharp{xx}$$,
$$\longrightharp{xx}$$,
Despite significant advances in minimally invasive treatment of lumbar disc herniations (LDHs), percutaneous endoscopic transforaminal discectomy (PETD) surgery still remains technically demanding regarding various surgical steps, and it has not become a widely adopted surgical treatment yet26. The concept of targeted discectomy requires accurate puncture and placement of the working cannula, which can be challenging for beginners27. Yong et al. reported a mean cutoff of 24.7 patients before obtaining a flattening of the learning curve28. This cutoff appears higher compared to other minimally invasive spinal surgeries29. Additionally, the conventional endoscopic working channel was relatively narrow (3.7 mm), and it could only be adapted to surgical instruments with low working efficiency and stiffness. Due to the limited field of view (FOV), identifying anatomical structures could sometimes be difficult, leading to a loss of confidence in the operating surgeon and risk of exiting root injury.
The introduction of full-endoscopic foraminoplasty and lumbar discectomy (FEFLD) aims to address the above issues and further lower the threshold for mastering transforaminal endoscopic surgery. First of all, the inner diameter of the endoscopic channel and the protective cannula was increased to 4.7 mm and 9.0 mm, respectively. This larger endoscopic system provides a wider FOV and allows clear identification of anatomical structures, which helps the surgeon confirm the location and direction of the surgical field. In this case series, anatomical landmarks around the superior articular process (SAP) are palpated using the radiofrequency probe, giving the surgeon an overall view of the SAP and greatly improving the safety of foraminoplasty. With a complete understanding of SAP anatomy, foraminoplasty becomes easier to handle under direct visualization. During the foraminoplasty process, no permanent exiting root injury complications were found. However, three cases of transient dorsal root irritation were identified during the placement of the U-head working cannula. This may be due to the unsatisfactory placement of the working cannula. Given the relatively large diameter of the working cannula, it should be placed caudally to the intervertebral foramen to avoid nerve irritation.
While X-ray image intensifiers facilitate puncture and cannulation during surgeries, they also increase the radiation exposure of both doctors and patients30,31. Ahn et al. measured the radiation exposure to surgeons during percutaneous endoscopic lumbar discectomy (PELD) in 30 cases, reporting an average fluoroscopy time of 150 s30. In this study, the median number of intraoperative images acquired was 9.6 ± 3.1, which was lower than previously reported results (13.1 ± 6.9)23. This reduction is mainly attributed to a change in the strategy of needle puncture. Punctures were performed along the intervertebral space rather than in a cranio-caudal direction. This approach allowed for satisfactory puncture by adjusting the puncture angle mainly according to the sagittal X-ray, thus minimizing harmful radiation exposure to both surgeons and patients. For patients with down-migrated discs, the working cannula can be moved downwards accordingly after fully enlarging the caudal space of the foramen, enabling successful detection and removal of the migrated disc. In this study, nearly one-third of the patients included had lumbar disc prolapse or sequestered LDH, all of whom achieved satisfactory clinical outcomes.
Full-endoscopic foraminoplasty can also be performed using an endoscopic drill, which is more controllable and reliable. However, the working efficiency of high-speed drills is much lower than that of trephines, and they generate a large amount of bone debris during use, leading to blurred vision or visual field defects. Despite this, with its good reliability, it can be used as a supplementary tool for the extensive enlargement of the intervertebral foramen. Additionally, the endoscopic drill remains an ideal instrument for the removal of calcified lumbar disc herniation.
Although full-endoscopic foraminoplasty and lumbar discectomy (FEFLD) have a wide range of surgical indications, including massive central disc herniation and calcified lumbar disc herniation, they are not the first choice for patients with spinal stenosis due to their limited ability to perform dorsal decompression of the nerve root. Additionally, endoscopic surgery through the interlaminar approach is more suitable for patients with L5-S1 pathologies and high iliac crests.
In the current study, we shared our experiences of using this full-endoscopic surgery with favorable clinical outcomes. Overall, FEFLD is an effective and beginner-friendly technique with promising application prospects in the treatment of lumbar disc herniations.
Materials
| Name | Company | Catalog Number | Comments |
|---|---|---|---|
| Dilator 1 | UninTech | UNT-II-241540 | 1.5 mm × OD 4.0 mm × L 240 mm |
| Dilator 2 | UninTech | UNT-II-214266 | 4.2 mm × OD 6.6 mm × L 215 mm |
| Dilator 3 | UninTech | UNT-II-196888 | 6.8 mm × OD 8.8 mm × L195 mm |
| Endoscope | UninTech | UNTV-076.30.171 | WL 171 mm/OD 7.6 mm/30°/ WChD 4.7 mm/2 x IC 1.5 mm |
| Radiofrequency coagulator | Kai Zhuo | RFS-4000KD | None |
| T-head cannula | UninTech | UNT-II-167989T | 7.9 mm × OD 8.9 mm × L168 mm |
| Trephine | UninTech | UNT-III-177888 | 7.8 mm × OD 8.8mm × L 171 mm |
| U-head cannula | UninTech | UNT-II-159010U | 9.0 mm × OD 10.2 mm × L151 mm |
References
Loading...
$$\rightleftharpoonup{xx}$$
$$\longleftharp{xx}$$,
$$\longrightharp{xx}$$,
- The evolution of transforaminal endoscopic spine surgery. World Neurosurg. 145, 643-656 (2021).">Khandge, A. V., Sharma, S. B., Kim, J. S. The evolution of transforaminal endoscopic spine surgery. World Neurosurg. 145, 643-656 (2021).
- A one-step foraminoplasty via a large trephine in percutaneous endoscopic transforaminal discectomy for the treatment of lumbar disc herniation. PLoS One. 17 (5), e0268564(2022).">Yu, Z., Lu, Y., Li, Y., An, Y., Wang, B. A one-step foraminoplasty via a large trephine in percutaneous endoscopic transforaminal discectomy for the treatment of lumbar disc herniation. PLoS One. 17 (5), e0268564(2022).
- Percutaneous endoscopic transforaminal outside-in outside technique for foraminal and extraforaminal lumbar disc herniations-operative technique. World Neurosurg. 130, 244-253 (2019).">Fiorenza, V., Ascanio, F. Percutaneous endoscopic transforaminal outside-in outside technique for foraminal and extraforaminal lumbar disc herniations-operative technique. World Neurosurg. 130, 244-253 (2019).
- Endoscopic spine discectomy: Indications and outcomes. Int Orthop. 43 (4), 909-916 (2019).">Ahn, Y. Endoscopic spine discectomy: Indications and outcomes. Int Orthop. 43 (4), 909-916 (2019).
- Posterolateral percutaneous suction-excision of herniated lumbar intervertebral discs. Report of interim results. Clin Orthop Relat Res. 207, 37-43 (1986).">Kambin, P., Sampson, S. Posterolateral percutaneous suction-excision of herniated lumbar intervertebral discs. Report of interim results. Clin Orthop Relat Res. 207, 37-43 (1986).
- Minimally invasive disc surgery with the yeung endoscopic spine system (yess). Surg Technol Int. 8, 267-277 (1999).">Yeung, A. T. Minimally invasive disc surgery with the yeung endoscopic spine system (yess). Surg Technol Int. 8, 267-277 (1999).
- Transforaminal posterolateral endoscopic discectomy with or without the combination of a low-dose chymopapain: A prospective randomized study in 280 consecutive cases. Spine. (Phila Pa). 31 (24), E890-E897 (2006).">Hoogland, T., Schubert, M., Miklitz, B., Ramirez, A. Transforaminal posterolateral endoscopic discectomy with or without the combination of a low-dose chymopapain: A prospective randomized study in 280 consecutive cases. Spine. (Phila Pa). 31 (24), E890-E897 (2006).
- Early outcomes of 270-degree spinal canal decompression by using TESSYs-isee technique in patients with lumbar spinal stenosis combined with disk herniation. Eur Spine J. 28 (1), 78-86 (2019).">Xiong, C., et al. Early outcomes of 270-degree spinal canal decompression by using TESSYs-isee technique in patients with lumbar spinal stenosis combined with disk herniation. Eur Spine J. 28 (1), 78-86 (2019).
- Modified percutaneous lumbar foraminoplasty and percutaneous endoscopic lumbar discectomy: Instrument design, technique notes, and 5 years follow-up. Pain Physician. 20 (1), E85-E98 (2017).">Li, Z. Z., Hou, S. X., Shang, W. L., Song, K. R., Zhao, H. L. Modified percutaneous lumbar foraminoplasty and percutaneous endoscopic lumbar discectomy: Instrument design, technique notes, and 5 years follow-up. Pain Physician. 20 (1), E85-E98 (2017).
- Transforaminal percutaneous endoscopic lumbar discectomy for very high-grade migrated disc herniation. Clin Neurol Neurosurg. 147, 11-17 (2016).">Ahn, Y., Jang, I. T., Kim, W. K. Transforaminal percutaneous endoscopic lumbar discectomy for very high-grade migrated disc herniation. Clin Neurol Neurosurg. 147, 11-17 (2016).
- Transforaminal endoscopic lumbar discectomy with targeted puncture and foraminotomy for very highly migrated disc herniation: A technique note with case series. Heliyon. 8 (10), e11115(2022).">Shen, J. J., et al. Transforaminal endoscopic lumbar discectomy with targeted puncture and foraminotomy for very highly migrated disc herniation: A technique note with case series. Heliyon. 8 (10), e11115(2022).
- Suprapedicular retrocorporeal technique of transforaminal full-endoscopic lumbar discectomy for highly downward-migrated disc herniation. World Neurosurg. 143, e631-e639 (2020).">Chen, C. M., et al. Suprapedicular retrocorporeal technique of transforaminal full-endoscopic lumbar discectomy for highly downward-migrated disc herniation. World Neurosurg. 143, e631-e639 (2020).
- The 20 most important questions for novices of full-endoscopic spinal surgery in china: A mixed-method study protocol. BMJ Open. 11 (8), e049902(2021).">Liu, C., et al. The 20 most important questions for novices of full-endoscopic spinal surgery in china: A mixed-method study protocol. BMJ Open. 11 (8), e049902(2021).
- Significant reduction of fluoroscopy repetition with lumbar localization system in minimally invasive spine surgery: A prospective study. Medicine. 96 (21), Baltimore. e6684(2017).">Fan, G., et al. Significant reduction of fluoroscopy repetition with lumbar localization system in minimally invasive spine surgery: A prospective study. Medicine. 96 (21), Baltimore. e6684(2017).
- Exiting root injury in transforaminal endoscopic discectomy: Preoperative image considerations for safety. Eur Spine J. 22 (11), 2481-2487 (2013).">Choi, I., et al. Exiting root injury in transforaminal endoscopic discectomy: Preoperative image considerations for safety. Eur Spine J. 22 (11), 2481-2487 (2013).
- Prevention of development of postoperative dysesthesia in transforaminal percutaneous endoscopic lumbar discectomy for intracanalicular lumbar disc herniation: Floating retraction technique. Minim Invasive Neurosurg. 54 (5-6), 214-218 (2011).">Cho, J. Y., Lee, S. H., Lee, H. Y. Prevention of development of postoperative dysesthesia in transforaminal percutaneous endoscopic lumbar discectomy for intracanalicular lumbar disc herniation: Floating retraction technique. Minim Invasive Neurosurg. 54 (5-6), 214-218 (2011).
- Transforaminal endoscopic decompression for radiculopathy secondary to intracanal noncontained lumbar disc herniations: Outcome and technique. Spine J. 2 (1), 41-48 (2002).">Tsou, P. M., Yeung, A. T. Transforaminal endoscopic decompression for radiculopathy secondary to intracanal noncontained lumbar disc herniations: Outcome and technique. Spine J. 2 (1), 41-48 (2002).
- Full-endoscopic interlaminar and transforaminal lumbar discectomy versus conventional microsurgical technique: A prospective, randomized, controlled study. Spine. (Phila Pa). 33 (9), 931-939 (2008).">Ruetten, S., Komp, M., Merk, H., Godolias, G. Full-endoscopic interlaminar and transforaminal lumbar discectomy versus conventional microsurgical technique: A prospective, randomized, controlled study. Spine. (Phila Pa). 33 (9), 931-939 (2008).
- Posterolateral endoscopic excision for lumbar disc herniation: Surgical technique, outcome, and complications in 307 consecutive cases. Spine. (Phila Pa). 27 (7), 722-731 (2002).">Yeung, A. T., Tsou, P. M. Posterolateral endoscopic excision for lumbar disc herniation: Surgical technique, outcome, and complications in 307 consecutive cases. Spine. (Phila Pa). 27 (7), 722-731 (2002).
- Dysethesia due to irritation of the dorsal root ganglion following lumbar transforaminal endoscopy: Analysis of frequency and contributing factors. Clin Neurol Neurosurg. 197, 106073(2020).">Lewandrowski, K. U., et al. Dysethesia due to irritation of the dorsal root ganglion following lumbar transforaminal endoscopy: Analysis of frequency and contributing factors. Clin Neurol Neurosurg. 197, 106073(2020).
- A novel targeted foraminoplasty device improves the efficacy and safety of foraminoplasty in percutaneous endoscopic lumbar discectomy: Preliminary clinical application of 70 cases. World Neurosurg. 115, e263-e271 (2018).">Ao, S., Wu, J., Zheng, W., Zhou, Y. A novel targeted foraminoplasty device improves the efficacy and safety of foraminoplasty in percutaneous endoscopic lumbar discectomy: Preliminary clinical application of 70 cases. World Neurosurg. 115, e263-e271 (2018).
- Full endoscopic lumbar foraminoplasty with periendoscopic visualized trephine technique for lumbar disc herniation with migration and/or foraminal or lateral recess stenosis. World Neurosurg. 148, e658-e666 (2021).">Chen, C., et al. Full endoscopic lumbar foraminoplasty with periendoscopic visualized trephine technique for lumbar disc herniation with migration and/or foraminal or lateral recess stenosis. World Neurosurg. 148, e658-e666 (2021).
- Comparison of full-endoscopic foraminoplasty and lumbar discectomy (FEFLD), unilateral biportal endoscopic (UBE) discectomy, and microdiscectomy (MD) for symptomatic lumbar disc herniation. Eur Spine J. 32 (2), 542-554 (2023).">Chang, H., et al. Comparison of full-endoscopic foraminoplasty and lumbar discectomy (FEFLD), unilateral biportal endoscopic (UBE) discectomy, and microdiscectomy (MD) for symptomatic lumbar disc herniation. Eur Spine J. 32 (2), 542-554 (2023).
- Full-endoscopic foraminoplasty using a visualized bone reamer in the treatment of lumbar disc herniation: A retrospective study of 80 cases. World Neurosurg. 149, e292-e297 (2021).">Ouyang, Z. H., et al. Full-endoscopic foraminoplasty using a visualized bone reamer in the treatment of lumbar disc herniation: A retrospective study of 80 cases. World Neurosurg. 149, e292-e297 (2021).
- Full-endoscopic foraminoplasty for highly down-migrated lumbar disc herniation. BMC Musculoskelet Disord. 23 (1), 303(2022).">Cai, H., et al. Full-endoscopic foraminoplasty for highly down-migrated lumbar disc herniation. BMC Musculoskelet Disord. 23 (1), 303(2022).
- A review of endoscopic spine surgery: Decompression for radiculopathy. Curr Pain Headache Rep. 26 (3), 183-191 (2022).">Franco, D., et al. A review of endoscopic spine surgery: Decompression for radiculopathy. Curr Pain Headache Rep. 26 (3), 183-191 (2022).
- Navigation improves the learning curve of transforamimal percutaneous endoscopic lumbar discectomy. Int Orthop. 41 (2), 323-332 (2017).">Fan, G., et al. Navigation improves the learning curve of transforamimal percutaneous endoscopic lumbar discectomy. Int Orthop. 41 (2), 323-332 (2017).
- Learning curve for transforaminal percutaneous endoscopic lumbar discectomy: A systematic review. World Neurosurg. 143, 471-479 (2020).">Ahn, Y., Lee, S., Son, S., Kim, H., Kim, J. E. Learning curve for transforaminal percutaneous endoscopic lumbar discectomy: A systematic review. World Neurosurg. 143, 471-479 (2020).
- Tubular microdiscectomy for recurrent lumbar disc herniation: A valuable alternative to endoscopic techniques. World Neurosurg. 173, e401-e407 (2023).">De Nijs, L., Fomekong, E., Raftopoulos, C. Tubular microdiscectomy for recurrent lumbar disc herniation: A valuable alternative to endoscopic techniques. World Neurosurg. 173, e401-e407 (2023).
- Radiation exposure to the surgeon during percutaneous endoscopic lumbar discectomy: A prospective study. Spine. (Phila Pa). 38 (7), 617-625 (2013).">Ahn, Y., Kim, C. H., Lee, J. H., Lee, S. H., Kim, J. S. Radiation exposure to the surgeon during percutaneous endoscopic lumbar discectomy: A prospective study. Spine. (Phila Pa). 38 (7), 617-625 (2013).
- Radiation exposure to the surgeon during ultrasound-assisted transforaminal percutaneous endoscopic lumbar discectomy: A prospective study. World Neurosurg. 101, 658-665 (2017).">Wu, R., Liao, X., Xia, H. Radiation exposure to the surgeon during ultrasound-assisted transforaminal percutaneous endoscopic lumbar discectomy: A prospective study. World Neurosurg. 101, 658-665 (2017).
Reprints and Permissions
Request permission to reuse the text or figures of this JoVE article
Request Permission