The protocol shows a flow cytometry-based method using chemistry to study energy metabolism in cells.
Method Article
Method to Study Metabolism in Lymphoid Cells using Chemistry to Measure Puromycin Incorporation by Flow Cytometry
In This Article
Summary
Abstract
Upon antigen stimulation, naïve T cells undergo rapid proliferation and expansion to effector T cells. Metabolism plays an important role in the generation of biomass needed for these rapidly proliferating cells and for the generation of molecules required for effector T cell differentiation and function, which influence the outcome of the adaptive immune response in infection or cancers. Naïve T cells reprogram their metabolism upon antigenic stimulation to increase the generation of ATP, which is required to support their growth, biosynthesis, and effector functions. ATP can be generated in a cell either by the mitochondrial-oxidative phosphorylation (OXPHOS) pathway or by the glycolytic pathway. Because most of the ATP generated in a dividing, growing cell is used up for the synthesis of proteins, protein synthesis has been used as a surrogate for ATP levels. Protein synthesis can be measured by the incorporation of puromycin, which mimics the 3′ adenosine of a tRNA charged with a modified tyrosine and leads to spontaneous termination of protein translation. Metabolic inhibitors like 2-deoxyglucose (2DG), which blocks the glycolytic pathway, and Oligomycin (O), which blocks complex 5 of the electron transport chain (ETC), can be used to study the dependencies of cellular ATP generation on these two pathways in conjunction with evaluation of protein synthesis in a method called SCENITH. We describe here a variation of this method that detects puromycin incorporation by flow cytometry using chemistry. This method of studying metabolism is relatively easy and can be used for evaluating rare cell populations, as well as patient samples, by flow cytometry.
Introduction
In recent years, there has been a growing appreciation of the important role of metabolism in the regulation of T cells. Cellular metabolism regulates many critical functions in lymphocytes, including clonal expansion of pathogen-specific T cells and their differentiation into effector cell subsets, which synthesize a variety of effector molecules, including inflammatory cytokines and cytolytic granzymes required to kill pathogens1. The study of T cell metabolism is therefore important both for evaluating normal T cell function and for the development of potential therapeutics.
Naïve T cells are metabolically quiescent and rely on catabolic metabolism and oxidative phosphorylation (OXPHOS) for their energy needs1,2. Upon T cell receptor (TCR) activation, T cells undergo rapid metabolic reprogramming driven in part by the upregulation of nutrient transporters on the surface of the cells, which increase the uptake of glucose and multiple amino acids, including glutamine, from the environment. These nutrient building blocks are then used in anabolic pathways to make macromolecules that contribute to cellular growth and support the increased energy demands associated with increased cell growth and division1,2,3. Metabolic reprogramming in activated T cells makes the cells more dependent on aerobic glycolysis and glutaminolysis for their energy needs1,2,3. Upon TCR stimulation, the uptake of nutrients also plays a critical role in activating downstream molecular pathways3. For example, uptake of amino acids and increased local amino acid concentration activate mTORC1 signaling4. Conversely, reducing the availability of intracellular amino acids diminishes the mTORC1 signaling pathway2,3,5,6,7. Thus, metabolism and cellular function are tightly linked in an effector T cell.
The large increase in biomass required for rapidly dividing T cells requires the upregulation of protein synthesis/translation8. Protein synthesis can be quantified in a cell by studying the incorporation of puromycin9, a tyrosyl-tRNA mimic that blocks translation by incorporating, marking, and releasing elongating polypeptide chains from translating ribosomes9. Protein translation is a high-energy-dependent process; indeed, most of the ATP generated in dividing, growing cells is used for the synthesis of proteins. Thus, protein synthesis has been used as a surrogate measurement for cellular ATP10. To generate ATP, cells commonly rely on glycolysis and/or the mitochondrial OXPHOS pathway11. Glycolysis generates two ATP molecules per glucose molecule. The OXPHOS pathway generates 36 ATPs per glucose12,13, but glycolysis can generate ATP faster14. Thus, rapidly dividing activated T cells, like cancer cells, rely heavily on the glycolytic pathway for ATP generation.
The dependency of a cell on each metabolic pathway can be studied by the use of specific inhibitors. The glycolytic pathway inhibitor 2-Deoxyglucose (2-DG), which is a glucose analog, acts as a competitive inhibitor for the glycolytic enzyme hexokinase15. 2-DG is phosphorylated to 2DG-phosphate (2DG-P) by hexokinase. 2DG-P cannot be further metabolized by phosphohexose isomerase, which normally converts glucose-6-phosphate (G-6-P) to fructose-6-phosphate16. 2DG-P is, therefore, trapped and accumulates in the cells, leading to inhibition of glycolysis and depletion of cellular ATP, thereby blocking protein synthesis17. In a similar manner, the dependency of cells on the mitochondrial OXPHOS pathway can be studied using Oligomycin, which binds to the proton channel of ATP synthase of the electron transport chain (ETC)18, thus blocking mitochondrial ATP synthesis (Figure 1). The use of these inhibitors in conjunction with an evaluation of protein synthesis can provide a picture of the metabolic state of cells and has been used in a powerful single-cell method known as SCENITH that evaluates puromycin incorporation using flow cytometry10. However, the availability of SCENITH reagents can be limiting. Other commonly used techniques for evaluating glycolysis and OXPHOS include Seahorse extracellular flux analyses, which require larger cell numbers, which may not be experimentally feasible. In this article, we describe an alternative method for evaluating puromycin incorporation using a commercially available Click-it chemistry reagent. The ease of this method allows rapid evaluation of the metabolic state of lymphocytes, including rare cell populations and patient samples.
Protocol
Animal husbandry and experiments were performed in accordance with approved protocol G98-3 by the National Human Genome Research Institute's Animal Use and Care Committee, NIH, and approved protocol LISB 22E by the National Institute of Allergy and Infectious Diseases Animal Care and Use Committee, NIH. Male C57Bl/6J mice aged 6-12 weeks, bred and housed in specific pathogen-free (SPF) conditions, were used for the present study. Similar results were obtained with female mice. Human whole blood was obtained from the NIH Blood Bank under NIH Clinical Center IRB-approved protocol 99-CC-0168 Collection and Distribution of Blood Components from Healthy Donors for In Vitro Research Use. Written informed consent was obtained from all subjects in accordance with the Declaration of Helsinki.
1. Mouse naïve CD4+ T cell isolation and culture
- Purify naïve CD4+ T cells by negative selection from pooled single-cell suspensions of mouse spleen or lymph nodes from 6 to 12-week-old male mice using a magnetic cell separation system according to the manufacturer's protocol.
- Culture cells (as described below) in IMDM media containing L-alanyl-L-glutamine dipeptide and supplemented with 10% Fetal Bovine Serum, 2 mM L-glutamine, 100 U/mL penicillin, 100 U/mL streptomycin, and 0.05 mM 2-β-mercaptoethanol.
- Co-culture naive CD4 T cells at a ratio of 1:8 with mitomycin-C-treated T-depleted splenocytes (described below) as APCs in 48-well plates under non-polarized (1 µg/mL of anti-CD3 [clone 2C11] and 3 µg/mL of anti-CD28 [clone 37.51]), and Th0 conditions (1 µg/mL of anti-CD3, 3 µg/mL of anti-CD28, 10 µg/mL each of anti-IFNg [clone XMG1.2], anti-IL-12 [clone C17.8], and anti-IL-4 [clone 11B11]) for 72 h at 37 °C. Set up cultures using 1 x 10⁶ APCs and 0.13 x 10⁶ naïve CD4 T cells per well of a 48-well plate (Table of Materials)
- Generation of mitomycin-C-treated T-depleted splenocytes as APCs: In brief, stain a single cell suspension of mouse spleen with FITC-conjugated CD4 and CD8 antibodies. Subsequently, label the cells magnetically with Anti-FITC Microbeads (see Table of Materials). Then, using a magnetic cell separation system according to the manufacturer's protocol, negatively select the APCs from T cells. Next, treat the APCs with 50 µg/mL Mitomycin C for 40 min at 37 °C incubator, followed by washing 3x with 1x PBS.
2. Human PBMCs isolation and culture
- Isolate PBMCs from whole blood using lymphocyte separation media and according to the manufacturer's protocol (see Table of Materials).
- Culture PBMCs in RPMI media supplemented with 2 mM L-glutamine, 0.01 M HEPES, 1 mM sodium pyruvate, 1% non-essential amino acids, 100 U/mL penicillin and Streptomycin, 0.05 mM 2-β-mercaptoethanol, and 5% Human Serum.
- Culture 1 x 10⁶ PBMCs per well of a U-bottomed 96-well plate with 5 µg/mL of Phytohemagglutinin-L (PHA-L) for 18-24 h at 37 °C.
3. Metabolic assay
NOTE: It is important to keep all cells, inhibitors [Oligomycin (O), 2-Deoxyglucose (2-DG), DMSO (Co)], and O-propargyl-puromycin (OPP) reagent as close to 37 °C as possible. Aliquot out the cells, inhibitors, and OPP reagent onto U-bottomed 96 plates and leave the plates in a 37 °C incubator as much as possible. Aliquot inhibitors 2-DG and O into smaller volumes to avoid multiple freeze-thaws.
- Make a 2 M (20x) stock solution of 2-DG and a 40 µM (40x) stock solution of O. For OPP, dilute 1 µL of OPP in 49 µL of medium so that the concentration is 400 µM-this will be the 20x stock solution.
- Make sure all other components of the OPP protein synthesis kit (see Table of Materials) are at room temperature (RT), before starting the experiment.
- Prepare 1x OPP reaction buffer by diluting an aliquot from the Component C bottle 1:10 with deionized water. After use, store any remaining 1x solution at 2-8 °C.
- Seed 0.1-2 x 10⁶ cells per well of round-bottom 96-well plate for each condition (Co / DG / O / DGO) in 100 µL of complete IMDM (for mouse CD4 T cells) or complete RPMI (for human PBMCs) or any complete media of choice. Keep the plate in the incubator as much as possible.
- Add 1x inhibitors from stock solutions (5 µL of 20x DG, Co), (2.5 µL of 40x O) and incubate for 15 min at 37 °C, 5% CO2. The final concentrations on cells are 100 mM DG and 1 µM O. Mix the inhibitors with the cells carefully with a pipette. For ease, aliquot out inhibitors in a 96-well plate and add cells to the inhibitors and mix well by pipetting up and down a few times.
- In the DGO sample, add 1x of DG (5 µL), mix carefully with a pipette, and incubate for 10 min at 37 °C, 5% CO2. Then, add 1x O (2.5 µL), pipette a couple of times, and incubate for 5 min at 37 °C, 5% CO2.
- Without washing out the inhibitors, add 5 µL of OPP from the 20x (400 µM) stock solution to each sample so that the concentration is 20 µM in cells, pipette up and down multiple times, and incubate 30 min at 37 °C, 5% CO2. For ease, aliquot out OPP onto a 96-well plate, add cells with inhibitors to the OPP reagent, and mix well.
NOTE: For less metabolically active cells and cells isolated directly ex vivo, increase the incubation time after OPP addition. Incubation time with OPP needs to be standardized for each cell type. - After incubation with OPP, add 100-150 µL of ice-cold FACS Buffer (2% FBS and 1 mM EDTA in 1x PBS). Centrifuge at 750 x g for 2 min at 4°C. Discard the supernatant and repeat the wash step.
- Stain cells with appropriate surface markers, anti-mouse CD4 antibody (used at 1/200 dilution) or anti-human CD4 antibody (used at 1/50 dilution), Live/Dead reagent (used at 1/600 dilution), in the presence of Fc Block (used at 1/200 dilution). Incubate for 25-30 min at 4 °C in the dark.
- Wash the plate with 150-200 µL of FACS buffer and centrifuge at 750 x g for 2 min at 4 °C. Gently flick the plate to discard the supernatant, then repeat the wash step. At this stage, the cells are stained on the surface.
- Resuspend the cells in 1% PFA in PBS, mix well, and incubate for 10-15 min at 4 °C. Protect from light.
- Wash with FACS Buffer and centrifuge at 750 x g for 2 min at 4 °C, and repeat washing.
- Resuspend the cell pellet in 200 µL of cold 1x Saponin permeabilization buffer (0.1% (wt/vol) Saponin + 3% FBS in 1x PBS). Incubate at RT, protected from light for 5-15 min. The cells are fixed and permeabilized at this time.
- Prepare 1x OPP reaction buffer additive (Component E) by diluting the 10x solution 1:10 in deionized water. Prepare this solution fresh and use it on the same day.
- Prepare OPP reaction cocktail according to Table 1. Use the reaction cocktail within 15 min of preparation.
- Centrifuge the samples from step 3.13 at 750 x g for 2 min. Discard the supernatant. Wash the cells 2x with 200 µL of 1x Saponin permeabilization buffer. Spin and discard the supernatant.
- Add 50-100 µL of OPP reaction cocktail (prepared in step 3.12) to each well and mix well. Incubate for 30 min at RT, protected from light. Then, spin plates at 750 x g or 2 min at 4 °C. Discard the supernatant.
- Resuspend the pellet in 200 µL of 1x Saponin permeabilization buffer and centrifuge samples at 750 x g for 2 min at 4 °C. Discard the supernatant.
- Resuspend in 50 µL of Reaction Rinse Buffer (Component F) per well and centrifuge at 750 x g for 2 min at 4°C. Resuspend stained cells in 200 µL of FACS buffer.
- Analyze samples by flow cytometry (see Supplementary Figure 1) the same day, or store the cells in the dark at 4 °C and analyze them the next day.
4. Analysis of metabolic assay
- Measure the incorporation of puromycin (OPP) as a surrogate for protein synthesis under the following conditions: 1) control condition (Co); 2) in cells where the glycolytic pathway is blocked by 2-DG; 3) in cells where the mitochondrial OXPHOS pathway is blocked by O; and 4) in cells where both the glycolytic and mitochondrial pathways are blocked by inhibitors (DGO), by evaluating the mean fluorescence intensity (MFI) of OPP (Figure 2).
- Analyze the dependency of cells towards a particular pathway by looking at the MFI of OPP in each condition. Directly evaluate the MFI as a measure of protein synthesis. Calculate the glucose dependence, glycolytic capacity, fatty acid oxidation (FAO) and amino acid oxidation (AAO) capacity, and mitochondrial dependence according to10.
Results
Naïve CD4+ T cells were isolated from the spleen and lymph nodes of mice and differentiated to Th0 or non-polarized (NP) lineages for 72 h. Cells were harvested after 0 h, 48 h, and 72 h of culture, and OPP incorporation was measured by looking at the MFI of the OPP. Naïve CD4+ T cells were less synthetic than the activated T cells, as seen by the MFI of OPP (Figure 3). Naïve cells were partially dependent on glycolysis but more so on the OXPHOS pathway as evaluated by the MFI and fold change of OPP incorporation. If we take the control (Co) set to be 100%, then blocking glycolysis lowers protein synthesis to 60% of the control; blocking the OXPHOS pathway lowers it further to 45%.
Upon activation, CD4+ T cells increase their protein synthesis, as evidenced by the increased MFI (Figure 3), and become more dependent on the glycolytic pathway; blocking glycolysis lowers protein synthesis in these cells by half. In contrast, blocking the OXPHOS pathway in these activated T cells did not reduce protein synthesis, and often increases incorporation of OPP, perhaps due to some metabolic adaptation in these activated cells. Here, the control (Co) set serves as a positive control, and the DGO set, where we block both pathways, serves as a negative control for the experiment. For comparison, we have included staining with a commercially available anti-puromycin Ab, where we also see a similar trend in both the NP and Th0 activated CD4 T cells being more dependent on the glycolytic pathway, but the signal is brighter with the OPP staining than with antibody staining, as evident from the MFI.
Human PBMCs were treated with PHA-L for 24 h. As observed with naïve mouse CD4 T cells, unstimulated human CD4 T cells were also less synthetic than activated/PHA-treated CD4 T cells, as evidenced by the MFI of the control samples (Figure 4). Unstimulated human CD4 T cells were more dependent on the glycolytic pathway and partially dependent on the OXPHOS pathway. If the control (Co) is set to 100%, then blocking glycolysis lowers protein synthesis to 67% of the control, and blocking the OXPHOS pathway lowers it to 81%. Upon activation, these cells were more synthetic, as evident from the higher MFI of OPP and highly dependent on the glycolytic pathway, showing no dependence on the OXPHOS pathway (Figure 4). Again, for comparison, we have included staining with a commercially available anti-puromycin Ab, where we also see a similar trend in activated human CD4 T cells being more dependent on the glycolytic pathway, but the signal is much brighter with the OPP staining than with antibody staining, as evident from the MFI.

Figure 1: Schematic of energy metabolism, ATP production, and protein synthesis pathway. Rough schematic of the energy/ATP production pathways in a cell-the glycolytic pathway, which can be inhibited by 2-Deoxyglucose (2-DG), and the oxidative phosphorylation pathway, which is inhibited by Oligomycin (O). Protein synthesis is an energy-intensive process that can be studied by puromycin incorporation, which blocks polypeptide chain elongation, leading to the release of the chain from the ribosome. Please click here to view a larger version of this figure.
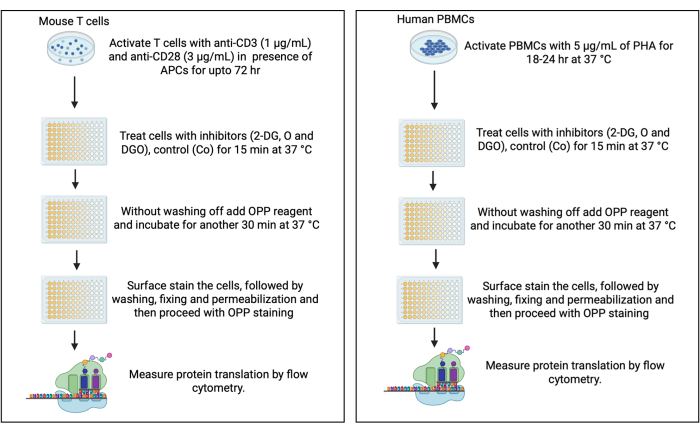
Figure 2: Schematic for the metabolic assay for mice and human lymphoid cells by flow cytometry. Flowchart of the metabolic assay in mouse and human lymphoid cells, which includes culture conditions, treatment, and assay readout. Please click here to view a larger version of this figure.
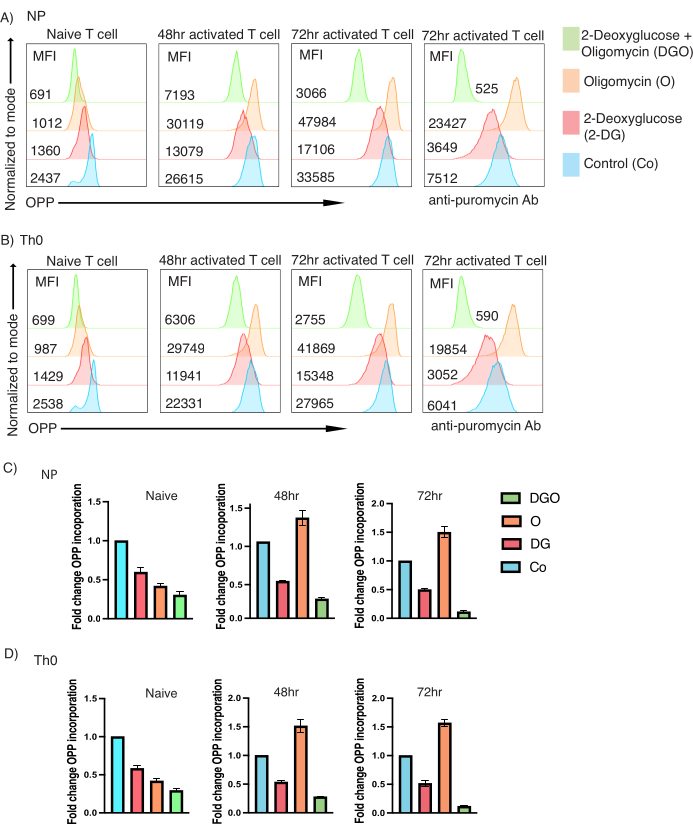
Figure 3: Metabolic assay for mouse CD4 T cells by flow cytometry. (A) and (C) Representative data of the metabolic assay for mouse naïve CD4 T cells differentiated to non-polarized (NP) lineage for 72 h. Assay was performed at the end of each timepoint by treating the cells with or without inhibitors (Co, DG, O, DGO) for 15 min, followed by 30 min incubation with OPP reagent at 37 °C. MFI comparison and fold change in the MFI were compared to the control (Co) sample. (B) and (D) Representative data of the metabolic assay for mouse naïve CD4 T cells differentiated to Th0 lineage for 72 h. Assay was performed at the end of each timepoint by treating the cells with or without inhibitors (Co, DG, O, DGO) for 15 min, followed by 30 min incubation with OPP reagent at 37 °C, then labeling cells for analyses by flow cytometry. MFI comparison and fold change in the MFI were compared to the control (Co) sample. Data in (C), and (D) are presented as mean values ± SEM. Representative data are shown from three independent experiments. Please click here to view a larger version of this figure.
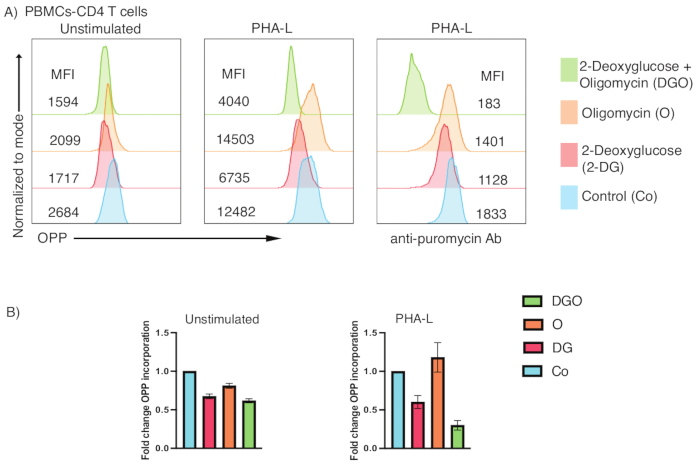
Figure 4: Metabolic assay for human PBMCs by flow cytometry. (A) and (B) Representative data of the metabolic assay for freshly isolated unstimulated human PBMCs and PBMCs which were treated with 5 µg/mL of PHA-L for 24 h at 37 °C. Assay was performed on unstimulated and PHA-L-treated cells, where inhibitors (Co, DG, O, DGO) were added for 15 min, followed by 30 min incubation with OPP reagent at 37 °C, and then labeled for analyses by flow cytometry. CD4+ T cells were gated on, and MFI comparison and fold change in the MFI were compared to the control (Co) sample. Data in (B) is presented as mean value ± SEM. Representative data are shown from three independent experiments. Please click here to view a larger version of this figure.
Supplementary Figure 1: Gating strategy. Gating strategy used for mouse lymphocytes and human PBMCs. Please click here to download this File.
| Reaction Components | Number of coverslips/Number of wells of a 96-well plate | |||
| 1 coverslip/10 wells | 5 coverslips/50 wells | 10 coverslips/100 wells | 20 coverslips/200 wells | |
| OPP reaction buffer (1x solution, component C) | 880 µL | 4.4 mL | 8.8 mL | 17.6 mL |
| Copper protectant (Component D) | 20 µL | 100 µL | 200 µL | 400 µL |
| Alexa Fluor picolyl azid (Component B) | 2.5 µL | 12.5 µL | 25 µL | 50 µL |
| Reaction buffer additive ( 1x solution, component E) | 100 µL | 500 µL | 1 mL | 2 mL |
| Total reaction volume | 1 mL | 5 mL | 10 mL | 20 mL |
Table 1: Protein synthesis reaction cocktail. The table is adapted from the protein synthesis kit (see Table of Materials).
Discussion
This paper provides a method to study metabolism in lymphoid cells by flow cytometry, based on SCENITH technology, but using chemical labeling of incorporated puromycin. Although we have focused on lymphocytes, this protocol can be adjusted to study metabolism in any cell type. This method is also advantageous to study metabolism in rare populations of cells and patient samples, where other techniques, such as Seahorse, require larger numbers of cells.
A critical step in the protocol is to make sure that the cells, inhibitors, and all reagents used are at room temperature unless otherwise specified. Cells that have been left in the fridge for too long should be incubated at 37 °C until the cells reach physiological temperature. Ideally, the cells, inhibitors and other reagents should be left in the incubator for a while before starting the actual experiment.
This method may also be modified to stain for intracellular proteins in conjunction with OPP staining. In the example presented, we have surface-labeled the cells to study the metabolism of CD4+ T cells, but we did not distinguish between the various subsets of effector CD4+ T cells present. Modification of this protocol to include more markers and potentially intracellular staining may increase the subpopulations to be evaluated. In this case, we would suggest to proceed with intracellular staining after completing the OPP stain by using the fix and permeabilization buffer for intracellular staining and then proceeding to intracellular staining of specific proteins. Such advances may allow evaluation of the dependency of specific subsets of CD4+ T cells towards various metabolic pathways.
This method is useful for looking at metabolic dependencies of activated cells, which have a high protein translation rate. One can also study the dependency of naïve cells, yet these are more difficult to study as they are less synthetic. Another limitation of this method is that one has to standardize the time of incubating the cells with OPP reagent; more synthetic cells should be incubated for shorter times, whereas fewer synthetic cells should be incubated for a longer time.
The SCENITH paper by Argüello et al.10 was an important contribution that demonstrated that looking at protein translation in conjunction with the use of inhibitors could permit evaluation of the dependencies of cells on different metabolic pathways by flow cytometry. In this work, the investigators looked at puromycin incorporation using an anti-puromycin monoclonal antibody. However, the reagent used is not currently available commercially. Our method is a variation of SCENITH that also looks at puromycin incorporation rate but uses a commercially available O-propargyl-puromycin (OPP) reagent that is then fluorescently labeled with a bright, photostable dye in a fast, highly specific, and mild click reaction, and is readily available and easy to use. Furthermore, like SCENITH, this method can be used for precious patient samples or ex vivo samples, where relatively low numbers of cells are available to study metabolic dependencies. Together, these techniques can provide insight into underlying metabolic programs that regulate cells, which may be key for developing novel approaches to disease.
Disclosures
The authors have no conflicts of interest to disclose.
Acknowledgements
We thank Dr. Qin Xu and Dr. Avik Dutta for providing PBMC samples and valuable experimental suggestions. This research was supported in part by the Division of Intramural Research of NIAID, NIH.
Materials
| Name | Company | Catalog Number | Comments |
|---|---|---|---|
| 2-Mercaptoethanol | Thermo Fisher | 21985-023 | |
| Alexa Fluor 488 anti-Puromycin Antibody | Biolegend | 381506 | Dilution used: 1/100 |
| Alexa Fluor 647 anti-human CD4 Antibody | Biolegend | 357422 | Dilution used: 1/50 |
| BD Horizon BUV737 Rat Anti-Mouse CD4 | BD Biosciences | 612761 | Dilution used: 1/200 |
| Click-iT Plus OPP Alexa Fluor 488 Protein Synthesis Assay Kit | Thermo Fisher | C10456 | |
| HEPES (1 M) | Thermo Fisher | 15630080 | |
| Human Serum | Millipore Sigma | H4522 | |
| IMDM, GlutaMAX Supplement, 500 ml | Thermo Fisher | 31980030 | |
| InVivoMAb anti-mouse CD28, Clone: 37.51 | BioXcell | BE0015-1 | |
| InVivoMAb anti-mouse CD3ε, Clone: 145-2C11 | BioXcell | BE0001-1 | |
| InVivoMAb anti-mouse IFNγ, Clone: XMG1.2 | BioXcell | BE0055 | |
| InVivoMAb anti-mouse IL-12 p40, Clone: C17.8 | BioXcell | BE0051 | |
| InVivoMAb anti-mouse IL-4, Clone: 11B11 | BioXcell | BE0045 | |
| L-Glutamine (200 mM) | Thermo Fisher | 25030081 | |
| LIVE/DEAD Fixable Aqua Dead Cell Stain Kit, for 405 nm excitation | Thermo Fisher | L34966 | Dilution used: 1/600 |
| LSM lymphocyte separation medium | MP Biomedicals | 50494X | |
| MEM Non-Essential Amino Acids Solution (100X) | Thermo Fisher | 11140050 | |
| Mitomycin C from Streptomyces caespitosus | Sigma | M0503-10X2MG | |
| Naive CD4 Isolation Kit, mouse | Miltenyi Biotec | 130-104-453 | |
| Paraformaldehyde 16% Aqueous Solution EM Grade | Electron Microscopy Sciences | 15710 | |
| PBS (1X), pH 7.4, 500 mL | Quality Biologicals | 114-058-101 | |
| Penicillin-Streptomycin (10,000 U/mL). 100mL | Thermo Fisher | 15140122 | |
| Phytohemagglutinin-L (PHA-L) | Millipore Sigma | 11249738001 | |
| Premium Grade Fetal Bovine Serum (FBS) | Avantor | 97068-085 | |
| RPMI 1640 Medium, no glutamine | Thermo Fisher | 21870076 | |
| Saponin | Thermo Fisher | A18820.22 | |
| Sodium Pyruvate (100 mM) | Thermo Fisher | 11360070 |
References
- Saravia, J., Raynor, J. L., Chapman, N. M., Lim, S. A., Chi, H. Signaling networks in immunometabolism. Cell Res. 30, 328-342 (2020).
- Chapman, N. M., Boothby, M. R., Chi, H. Metabolic coordination of T cell quiescence and activation. Nat Rev Immunol. 20, 55-70 (2020).
- Raynor, J. L., Chi, H. Nutrients: Signal 4 in T cell immunity. J Exp Med. (221), e20221839(2024).
- Shimobayashi, M., Hall, M. N. Multiple amino acid sensing inputs to mTORC1. Cell Res. 26, 7-20 (2016).
- Huang, H., et al. In vivo CRISPR screening reveals nutrient signaling processes underpinning CD8(+) T cell fate decisions. Cell. 184, 1245-1261.e21 (2021).
- Pollizzi, K. N., et al. Asymmetric inheritance of mTORC1 kinase activity during division dictates CD8(+) T cell differentiation. Nat Immunol. 17, 704-711 (2016).
- Verbist, K. C., et al. Metabolic maintenance of cell asymmetry following division in activated T lymphocytes. Nature. 532, 389-393 (2016).
- Marchingo, J. M., Cantrell, D. A. Protein synthesis, degradation, and energy metabolism in T cell immunity. Cell Mol Immunol. 19, 303-315 (2022).
- Enam, S. U., et al. Puromycin reactivity does not accurately localize translation at the subcellular level. Elife. 9, e60303(2020).
- Argüello, R. J., et al. SCENITH: A Flow Cytometry-Based Method to Functionally Profile Energy Metabolism with Single-Cell Resolution. Cell Metab. 32, 1063-1075.e7 (2020).
- Dunn, J., Grider, M. H. Physiology, Adenosine Triphosphate. , StatPearls Publishing LLC. (2024).
- Shiratori, R., et al. Glycolytic suppression dramatically changes the intracellular metabolic profile of multiple cancer cell lines in a mitochondrial metabolism-dependent manner. Sci Rep. 9, 18699(2019).
- Vander Heiden, M. G., Cantley, L. C., Thompson, C. B. Understanding the Warburg effect: the metabolic requirements of cell proliferation. Science. 324, 1029-1033 (2009).
- Pfeiffer, T., Schuster, S., Bonhoeffer, S. Cooperation and competition in the evolution of ATP-producing pathways. Science. 292, 504-507 (2001).
- Brown, J. Effects of 2-deoxyglucose on carbohydrate metabolism: review of the literature and studies in the rat. Metabolism. 11, 1098-1112 (1962).
- Weindruch, R., et al. Caloric restriction mimetics: metabolic interventions. J Gerontol A Biol Sci Med Sci. 56 Spec No1, 20-33 (2001).
- Gronostajski, R. M., Pardee, A. B., Goldberg, A. L. The ATP dependence of the degradation of short- and long-lived proteins in growing fibroblasts. J Biol Chem. 260, 3344-3349 (1985).
- Hearne, A., Chen, H., Monarchino, A., Wiseman, J. S. Oligomycin-induced proton uncoupling. Toxicol In Vitro. 67, 104907(2020).
Reprints and Permissions
This article has been published
Video Coming Soon