This protocol describes the implementation of a quality control framework to detect inter-individual contamination and mismatches in next-generation sequencing data by verifying the genetic identity of pairs of samples within individuals.
Method Article
Detecting Inter-Individual Contamination and Mismatches in Multiomics Next-Generation Sequencing Data
In This Article
Summary
Abstract
High-throughput processing of patient biosamples by next-generation sequencing and the comparison of molecular data with patient-level and sample-level clinical data require precise tracking and matching of sample identifiers throughout the biospecimen chain of custody and are critical to enabling robust interpretation of biomarker trial results. In addition to tracing individual steps in the sample and data processing workflows, bioinformatics solutions can be used to confirm that samples originate from the same patient. Here, the use of a bioinformatics workflow to identify matched samples originating from the same individual is showcased. The analysis workflow is suitable for any two or more pairs of NGS datasets to be compared and verified for patient sample origin. A scoring algorithm based on genome-wide comparisons of samples enables the user to determine whether two samples stem from the same individual. Specifically, single-nucleotide polymorphisms (SNPs) within selected linkage disequilibrium blocks are used to identify and compare samples. Threshold combinations for permissive and stringent selection of matched and mismatched samples were identified. The utility of this protocol was demonstrated through its application to the quality control and validation of clinical tumor tissue and blood samples, encompassing multiple omics modalities from over 2,000 patients.
Introduction
The large-scale collection and analysis of clinical samples necessitate the exact tracking of samples along their chain of custody, as correct matching of molecular data from the same or different modalities and clinical patient- and sample-level data is essential for accurate interpretation and informed decision-making. Despite rigorous efforts to streamline sample-processing protocols under good clinical practice, sample swapping or mislabeling can occur at various stages, from the biopsy/sample extraction to the preparation and processing steps, and to the data analysis stage (Figure 1). With increasing numbers of samples and sample processing steps, the likelihood of sample swaps and cross-contamination increases. This can result in the analysis of data with incorrect sample-patient relationships, affecting downstream analysis and conclusions, and is thus an important aspect to be considered in clinical genomics research. In clinical studies, the incorrect identification of samples can strongly impact the overall results, especially for studies with small sample size1. Contamination across individuals can lead to loss of power for the identification of differences and false positive results when comparing multiple samples from the same patient. Sample swaps have an influence on the detection power of genetic associations and can lead to the underestimation of heritability of complex traits in genome-wide association analysis2.
Cancer research is one of the areas in which large-scale genomic and transcriptomic analyses are performed3, specifically monitoring genomic and phenotypic inter- and intrapatient heterogeneity. One aspect of cancer research is that samples from the same patient may carry different mutations and copy number alterations and thus exhibit independent variant allele frequencies4. Especially when interpreting data from multiple omics types, the correct integration of multimodal datasets from the same individuals is important and thus requires monitoring of inter-individual contamination5,6,7,8. Studies on datasets from the cancer genome atlas program (TCGA) and the lung genomic research consortium (LGRC) have identified sample misidentification rates of 3% on average and as high as ~20% in certain studies2,9,10,11. These examples show the importance of monitoring the occurrence of sample swaps and cross-contamination12. Beyond routine monitoring and quality control at every process step, a comparative analysis of sequencing results acts as a final quality check. This ensures accurate sample matching before moving to data analysis and interpretation.
A number of bioinformatics approaches have been established to identify whether samples stem from the same individual1,4,13,14,15,16. Initial approaches leveraged short tandem repeats to verify sample identity17. Next-generation sequencing data at the RNA and DNA level now allow for the comparison across pairs of samples based on single-nucleotide polymorphisms18. They differ regarding their applicability to different sequencing modalities and datasets, e.g. for RNA sequencing19 or for whole exome sequencing data5, their implementation, e.g. checking across sequencing lanes20, and ease of use. Although samples from the same individual can be identified based on 20–45 single-nucleotide polymorphisms, low to medium-coverage sequencing approaches typically used in cancer research require the integration of a large number of SNPs1.
Here, the implementation and adjustments to one such approach using linkage disequilibrium blocks of SNPs15, which is used for the quality control of matched samples, are described. The approach has been shown to have a low false flag rate and false match rate, and the workflow allows for the comparison across modalities, e.g., between whole exome sequencing and RNA-sequencing samples, as well as for the use with different data formats. For large-scale applicability of the method across datasets in clinical trial samples, the bioinformatic pipeline was implemented in common workflow language (CWL)21,22. Owing to its readability and YAML-like syntax, scientists with limited programming experience can easily interpret the general structure of the workflow and analysis results. Another key feature of CWL is its scatter/gather functionality, which enables the parallelization of processes to fully utilize allocated computational resources. Users can specify the conditions under which certain steps are executed, thus enhancing the flexibility of the resulting analyses. CWL can be integrated with other components of a complete workflow management system, such as database storage, a graphical user interface, and a job dispatcher, forming a powerful platform for creating, running, and maintaining a reproducible set of scientific analyses. Thus, this implementation allows for facilitated access to the workflow and high-throughput processing of datasets in the context of defined workflow management systems.
Furthermore, the effects of tuning selection parameter thresholding between matched and unmatched samples were investigated, and thresholds for permissive and stringent selection of mismatched cases were determined. The effects of modifying these parameters on sample pair selection and their applicability within and across different omics modalities were showcased. Effectively fine-tuning these parameters will allow users to adjust the stringency of their interpretations. The workflow was applied to a set of large-scale clinical datasets with several thousand samples.
Protocol
Ethics statement: This analysis of cross-individual contamination was performed retrospectively using individual patient-level data from completed phase I and phase II clinical studies, in accordance with Roche’s responsible data reuse process and in compliance with the master informed consent form for each study. Ethics Committee/Institutional Review Board approvals were obtained for each study prior to its conduct. Participants gave and signed informed consent to participate in these studies.
Bioinformatics workflow
NOTE: The bioinformatics workflow implementation starts from raw fastq files derived from next-generation sequencing data, e.g., whole-genome, whole-exome, or whole-transcriptome sequencing. Individual steps described here are integrated into the CWL workflow.
1. Reference materials required
- For the bioinformatics workflow, provide the following:
- Human reference genome (GRCh38) in .fasta format.
- Corresponding indexing file as .fasta.fai.
- Corresponding dictionary in .dict format.
- A haplotype map matching genomic regions of interest for SNPs and linkage disequilibrium blocks (e.g., Picard build_fingerprint_maps, SCR_006525).
- Ensure that the header of the haplotype map matches the reference genome.
2. Alignment to reference genome, sorting, and indexing
- Run the CWL workflow to provide the outputs for the following steps described below (list of tools in Table of Materials) (Figure 2).
- Initiate the CWL workflow by providing a directory of paired fastq files or aligned bam files.
- Provide the pattern, e.g., R1/R2, as an input regular expression pattern in the CWL command.
- Additionally, provide the location for the workflow to run, the genome reference, and haplotype mapping files.
NOTE: For an all-to-all comparison, the complete input directory is used. If a subset of files is to be compared, provide a comma-separated file containing the file names for comparison. The advanced option allows selection of random-access memory and the number of central processing units to run the process. - Map the fastq files to the human reference genome by using a mapping algorithm.
NOTE: Depending on the sequencing modality, BWA-MEM is used for DNA sequencing results23, and the splice-aware mapper STAR is used for RNA sequencing results24. Exemplary code for STAR alignment is provided below:
STAR \
--readFilesCommand zcat \
--runThreadN 8 \
--outSAMmapqUnique 60 \
--outSAMattributes All \
--outReadsUnmapped Fastx \
--outTmpDir /tmp/STARtmp/ \
--runDirPerm All_RWX \
--outSAMtype BAM Unsorted \
--outFileNamePrefix /FILENAME_ \
--outSAMattrRGline ID:FILEID.L001 SM:SAMPLE \
--genomeDir /REF/GENOME/DIR \
--readFilesIn /path/to/FILENAME.R1.fastq.gz /path/to/FILENAME.R2.fastq.gz - Sort the resulting aligned binary alignment matrix (BAM) files by read coordinate by using SAMtools sort (samtools sort -o FILENAME_OUT.bam FILENAME_IN.bam).
- Index the sorted BAM files by using SAMtools index (samtools index FILENAME_OUT.bam).
- Mark and remove duplicates by using Picard MarkDuplicates.
- Re-index BAM files and include read groups (RG) by using SAMtools.
NOTE: BAM files must have RG tags for the workflow to function.
3. Extract fingerprints
- Use the sorted and indexed BAM files to identify SNP fingerprints by using Picard ExtractFingerprints.
- Use intermediate storage of the resulting variant call format (VCF) files solely for the purpose of comparison across samples.
4. Calculation of similarity scores
- Use Picard CrossCheckFingerprints to calculate log odds ratio scores (LOD) of similarity based on linkage disequilibrium blocks, which are provided in a crosscheck_metrics file format as crosscheck_metrics.txt.
NOTE: The workflow implementation allows for a cross-comparison of all possible combinations of pairs of samples or a selected comparison across samples from a predefined list. - Delete intermediate VCF files.
- The crosscheck_metrics file provides four comparisons for each pair of samples tested. Interpretation of the LOD scores is as follows:
LOD score > 0: samples likely originate from the same individual (sample match)
LOD score ≤ 0: samples likely originate from different individuals - Validate the cut-off value for sample matches by visualizing the LOD score distribution as a histogram, for example, in R or Python (Figure 3).
- A collaborative team including experienced bioinformatics expertise is suggested to determine if the evidence is sufficient for an unequivocal identification of sample identities and a potential adjustment of the thresholds used, for example, by including all three LOD scores or a comparison to the LOD score distribution of samples known to stem from different individuals.
NOTE: Sample mix-ups can result in multiple unexpected matches (LOD score < 0 for samples of the same donor) and mismatches (LOD score > 0 for samples from different donors). Complex interpretations require close exchange between the cross-functional team and the bioinformatics expert.
5. Code availability
The computational workflow will be made available on Github: https://github.com/Roche/sample-matching-workflow.
Results
CWL workflow implementation
A workflow for the identification of sample matches, based on a previously established approach that uses linkage disequilibrium blocks of single-nucleotide polymorphisms for the identification of sample swaps, was implemented15. The authors have shown classification rates of 0% FMR and 0.01% FFR for this method. A comparison to other approaches showed similar performance to NGSCheckmate at high and intermediate coverage and improved performance over NGSCheckmate at low coverage and for minimal regional genomic overlap. Inconclusive results were obtained when comparing to Conpair and BAMixChecker13,15,25. Here, the workflow was implemented in CWL, LOD thresholds were investigated and optimized, and it was applied for the comparison of RNA sequencing pairs and DNA sequencing pairs or across modalities within samples extracted from tissue and between samples from tissue and peripheral blood (Figure 3, Table 1). The workflow implementation allowed for a cross-comparison of all possible combinations of pairs of samples or a selected comparison across samples from a predefined list.
The workflow input uses a selected set of haplotypes. These are used to calculate single-nucleotide polymorphisms in linkage disequilibrium blocks. Calculation of log-odds ratio (LOD) scores of these blocks of SNPs across pairs of samples allows for differentiation between matched and mismatched samples. Previously, LOD scores in the range of LOD < -5 and LOD > 5 have been shown to correctly classify matched pairs of samples15. Additional LOD scores (LOD_SCORE_TUMOR_NORMAL, LOD_SCORE_NORMAL_TUMOR) are calculated taking into consideration a potential loss of heterozygosity in the tumor sample for either of the samples (heterozygous regions in one sample detected as homozygous in the other sample).
Influence of input parameters and thresholds on match/mismatch rates
The evaluation of this workflow highlighted three critical aspects impacting its performance and accuracy. First, the selection of genomic regions covered by the haplotype map proved to be a pivotal step. The choice of these regions directly influences the discriminative power of the matching process. Second, the combination of read alignment strategies and the specific haplotype maps used for fingerprint extraction significantly affected the final analysis results. Variations in these upstream processing steps can introduce subtle biases that propagate to the matching scores (Figure 4A–B). Third, careful evaluation and selection of thresholds for determining a sample match were essential. Optimal threshold values can vary considerably depending on the specific data modality (e.g., whole exome sequencing vs. whole transcriptome sequencing) and the genomic regions being assessed. Different thresholds can adjust the stringency of the approach (high false positive rate vs. high false negative rate) (Figure 4C). To address this for a large cohort of clinical samples, the method was adapted to define both permissive and stringent sample matching score combinations based on the combination of LOD scores used and the comparator. A first thresholding approach (I) was achieved by considering any positive value across the three LOD scores (LOD_SCORE, LOD_SCORE_TUMOR_NORMAL, LOD_SCORE_NORMAL_TUMOR). By including information on TUMOR_NORMAL and NORMAL_TUMOR scores, the effects of loss of heterozygosity, occurring owing to copy number alterations of cancer samples, can be mitigated. Conversely, a more stringent threshold for mismatches (II) was implemented by applying two alternative filtering criteria, tailored to reduce false positives: (a) categorization as a match only, if LOD_SCORE is positive, b) categorization as a match, if, for a given sample, LOD_SCORE is greater than the maximum score of that sample’s other pairwise LOD_SCOREs among samples it is not expected to match (based on documented patient of origin), even if the LOD_SCORE itself is negative.
In this application, to generate a permissive threshold, any sample pair designated as a match by any of the above criteria (I, IIa, IIb) was deemed a match. This provided high confidence in all identified mismatches, at the expense of some potential true mismatches being designated as matches (i.e., false negatives). A comparison of the permissive threshold with more stringent thresholds showed a shift in the percentage of pairs being classified as mismatches. The difference between the approaches, across all analyzed studies, ranged from 3.9% (any of the three LOD scores positive (I)), 13.3% (LOD_SCORE must be positive (IIa)), 9.2% (LOD_SCORE compared to a samples non-matching pairs (IIb)), and 3.6% (taking into account if any of the above to designate a match) (Figure 4C).
Influence of genomic region coverage
The difference between negative and positive LOD scores for matched and mismatched samples is highest when a large range of genomic regions is covered (whole genome sequencing (WGS) or comparison of WGS samples with other modalities), thus facilitating threshold selection (Figure 5A). For whole-exome sequencing and RNA-sequencing comparisons, LOD scores fall closer to zero with thresholding approaches affecting the results, highlighting the importance of evaluating the stringency of the thresholds for modalities with lower genomic coverage. A distribution of results from known paired samples with positive LOD scores is displayed in Figure 5B. Javed et al. (2020) have shown that as little as 0.02% genome overlap is sufficient for a distinction between matched and unmatched samples when using linkage disequilibrium blocks15.
Validation
The approach was validated on additional breast cancer, colorectal cancer, and lung cancer whole-exome sequencing (WES) and RNA-sequencing datasets, for which a known set of samples was expected to stem from the same individuals (Figure 6A). Pairs of samples from the same individual showed a 100% match rate (Figure 6B), whereas additional comparisons to other samples known to stem from different individuals showed a 100% mismatch rate. Neither false positives nor false negatives were observed in any of these datasets.
In summary, implementing the quality control workflow facilitates inter-individual comparisons of pairs of next-generation sequencing samples by providing a standardized, reproducible approach. The resulting LOD score thresholds yield low false-positive and false-negative rates for samples with large genomic regional overlap, and additional threshold optimization may be applied for samples with low sequencing depth or for which little genomic overlap is present.
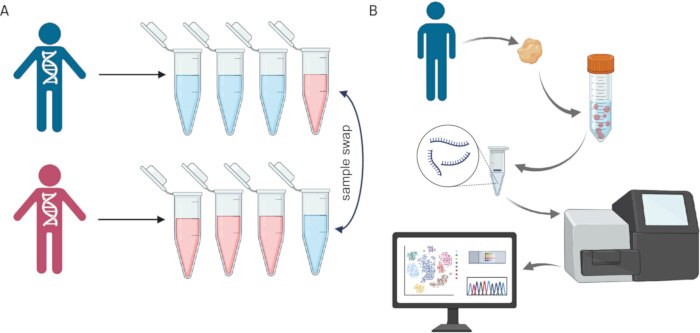
Figure 1: Schematic representation of the occurrence of sample swaps and mislabeling. (A) Sample swap of one sample each between two individuals. (B) Representation of sample processing steps from biopsy extraction to the analysis of sequencing data. Created in BioRender. Voith von Voithenberg, L. (2026) https://BioRender.com/xhbp178. Please click here to view a larger version of this figure.
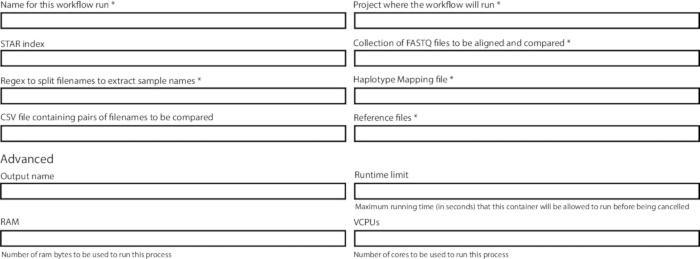
Figure 2: Representation of the user interface for input files and parameters required for running the sample matching quality control workflow in CWL. Graphical user interface for file and parameter input. Please click here to view a larger version of this figure.
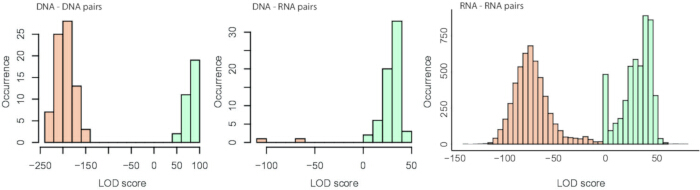
Figure 3: Results obtained from the sample matching workflow. Distribution of LOD scores for an exemplary set of DNA sequencing (whole genome and whole exome sequencing) samples (left), for a comparison between DNA sequencing and RNA sequencing (center) to display how very few mismatched samples behave as compared to the distribution of matched samples, and for an exemplary larger cohort of RNA sequencing pairs (right) with data known to stem from different individuals (mismatches, light red) and from the same individual (matches, light green). Abbreviations; LOD = log odds ratio. Please click here to view a larger version of this figure.
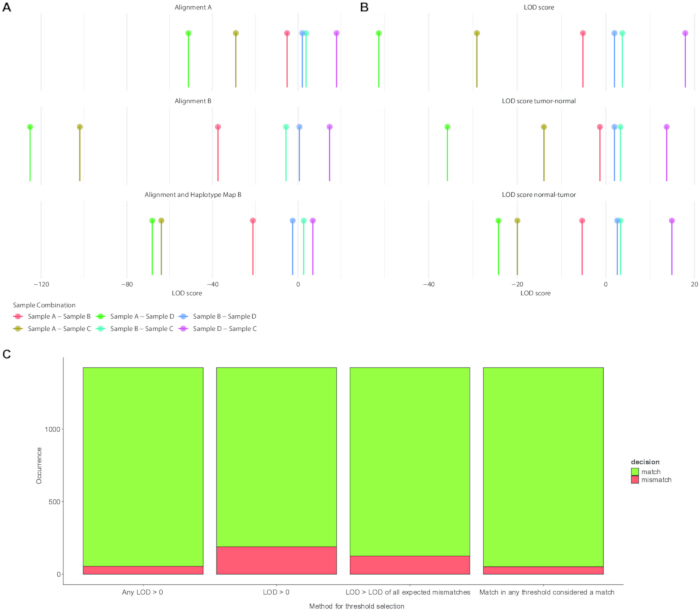
Figure 4: Exemplary differences in LOD score observed. (A) when combining different sequence alignment approaches and haplotype maps for a set of known mismatched and matched samples, and (B) for scoring by integration of tumor and normal information. (C) Occurrence of the number of sample matches and mismatches defined by thresholding approaches of different stringency. Abbreviations; LOD = log odds ratio. Please click here to view a larger version of this figure.
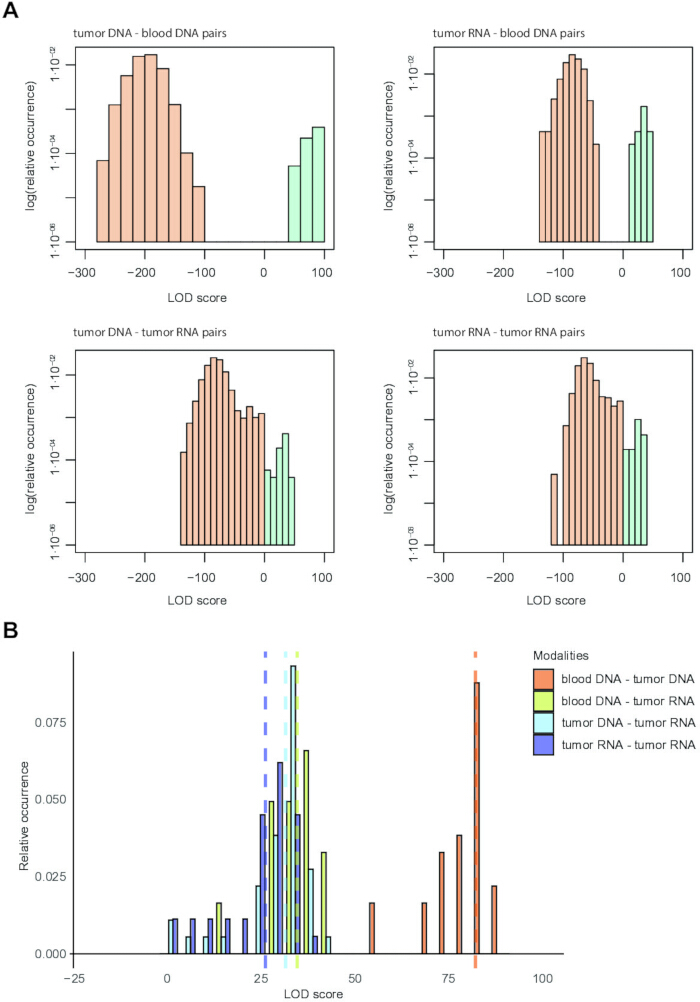
Figure 5: Exemplary distribution of LOD scores for comparing different next-generation sequencing modalities. (A) LOD score distribution of expected mismatched and matched samples between DNA-sequencing from blood and tumor tissue and RNA-sequencing from tumor tissue. (B) LOD score distribution of matched samples for combinations of different modalities. Abbreviations; LOD = log odds ratio. Please click here to view a larger version of this figure.
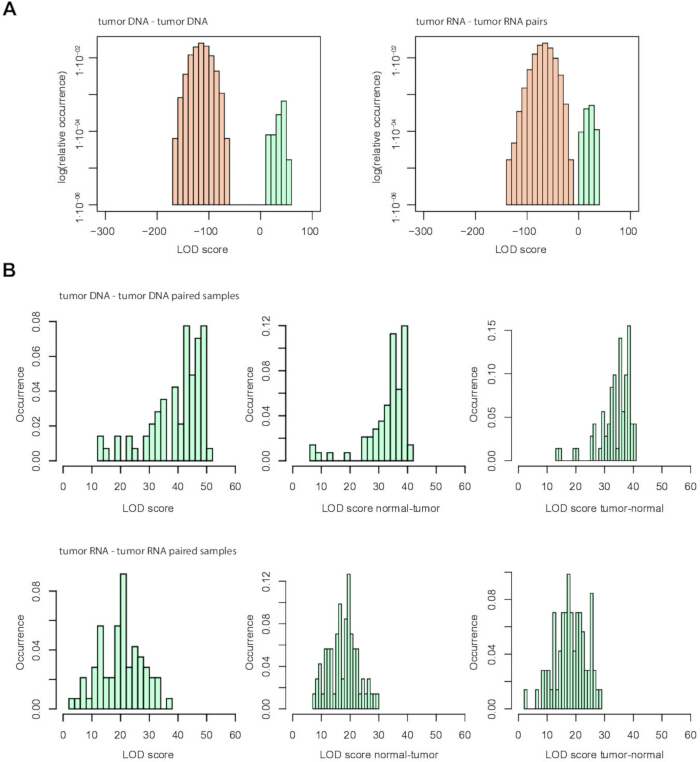
Figure 6: Distribution of LOD scores for the analysis of a breast cancer WES and RNA-sequencing dataset. The deidentified breast cancer dataset was obtained from Caris Life Sciences and is derived from comprehensive tumor profiling. (A) Logarithmic occurrence of LOD scores for comparisons between tumor WES samples (left) and between RNA-sequencing samples (right). (B) LOD score distributions for expected pairs of samples from the same individuals (WES upper row, RNA-sequencing lower row). Abbreviations; LOD = log odds ratio. Please click here to view a larger version of this figure.
| LEFT_GROUP_VALUE | RIGHT_GROUP_VALUE | RESULT | LOD_SCORE | LOD_SCORE_ TUMOR_NORMAL | LOD_SCORE_ NORMAL_TUMOR |
| Sample 1 | Sample 1 | EXPECTED_MATCH | 38.119266 | 29.649485 | 29.649485 |
| Sample 1 | Sample 2 | EXPECTED_MISMATCH | -2.552644 | -4.57422 | 5.283698 |
| Sample 2 | Sample 1 | EXPECTED_MISMATCH | -2.552644 | 5.283698 | -4.57422 |
| Sample 2 | Sample 2 | EXPECTED_MATCH | 12.328737 | 8.796457 | 8.796457 |
Table 1: Exemplary results obtained from running Crosscheck Fingerprints. The table shows exemplary results of a pair of samples compared by the sample matching approach.
Discussion
A variety of methods for identifying sample matches is available1,4,13,14,15,16. Here, the implementation of an approach using SNP linkage disequilibrium blocks applicable across multiple omics modalities, with low false-positive and false-negative rates, was described15. Implementation was done in CWL to facilitate high-throughput processing across datasets within a standardized workflow environment. The workflow evaluation identified three key aspects to consider when applying the approach. A key step in the process is selecting the genomic regions covered by the haplotype map. Additionally, combining read alignment with fingerprint extraction using different haplotype maps can affect analysis results. Furthermore, the careful evaluation and selection of thresholds, which may depend on data modality and the regions covered, are essential and can lead to either more or less permissive sample-matching calling.
For evaluating large sets of clinical samples, the method was adapted to define combinations of thresholds for permissive and stringent sample-matching scores. The method was adjusted to include a permissive thresholding approach by considering a combined score comprising any of the LOD scores (LOD_SCORE, LOD_SCORE_TUMOR_NORMAL, LOD_SCORE_NORMAL_TUMOR) or two alternative filtering criteria, resulting in a more stringent selection of samples. The applicability of the approach is limited to samples for which SNP information across a range of genomic regions is available, e.g., next-generation sequencing data. Furthermore, at least pairs of samples from the same individual are required for comparative analysis and sample matching. Additional clinical information, such as mutation status obtained by targeted methods or patient metadata, such as sex, may be used to provide further evidence for matching between high-dimensional molecular data and patient-level clinical data.
The implementation of the approach in a workflow management environment, with the possibility of parallel data storage, enables high-throughput quality-control analysis of samples for inter-individual contamination. Thus, it increases accessibility and reproducibility of the approach across datasets and samples. The adaptability of the thresholding criteria in this approach enables the processing and analysis of cancer samples with low and high tumor mutational burden and copy number alterations that may lead to loss of heterozygosity and thus affect genotype likelihood.
The method can find broad applicability across any type of project that involves next-generation sequencing data from human individuals and for which more than a single sample per person is available. This may range from personalized approaches for individual patients to large clinical trials collecting high-dimensional molecular data for different disease areas. It can be combined with quality control workflows, investigating cross-species contamination, and approaches to link high-dimensional molecular datasets with clinical information for integration into any quality control pipeline for next-generation sequencing data.
Disclosures
All authors are employees or external contractors and shareholders of F. Hoffmann-La Roche Ltd. Additionally, Zachary Whitfield is an employee of Rancho Biosciences, and Ana Teixeira is an employee of A4Pbio. The authors declare no competing interests.
Acknowledgements
We sincerely thank the patients and their families for providing their samples. We extend our deepest gratitude to everyone involved in the clinical studies, particularly the members of the study teams, investigator teams, and project teams at our clinical research organizations, for their invaluable contributions. The authors thank N. Nair and E. Guarin for their critical reading of the manuscript and valuable comments. We also extend our gratitude to A. Cosolo for his support in making additional datasets accessible. We acknowledge the Roche-wide Enhanced Data and Insights Sharing (EDIS) network for their efforts in data curation and harmonization.
Materials
| Name | Company | Catalog Number | Comments |
|---|---|---|---|
| FastQC | v0.11.9 | SCR_014583 | |
| MultiQC | v1.8 | SCR_014982 | |
| BWA-MEM | v0.7.17 | SCR_010910 | |
| STAR | v2.7.9a | SCR_004463 | |
| SAMtools | V1.12, v1.19.2 | SCR_005227 | |
| - faidx | |||
| - sort | |||
| - index | |||
| - addreplacerg | |||
| Picard | V2.25.5, v3.0.0 | SCR_006525 | |
| - CreateSequenceDictionary | |||
| - MarkDuplicates | |||
| - build_fingerprint_maps | |||
| - ExtractFingerprints | |||
| - CrosscheckFingerprints | |||
| CWL | v1.2 | SCR_015528 | |
| R | R v4.3.1 | SCR_001905 | |
| dplyr v1.1.4 |
References
- Westphal, M., et al. SMaSH: sample matching using SNPs in humans. BMC Genomics. 20 (12), 1001(2019).
- Westra, H. J., et al. MixupMapper: correcting sample mix-ups in genome-wide datasets increases power to detect small genetic effects. Bioinformatics. 27 (15), 2104-2111 (2011).
- Addala, V., et al. Computational immunogenomic approaches to predict response to cancer immunotherapies. Nat. Rev. Clin. Oncol. 21 (1), 28-46 (2024).
- Schröder, J., Corbin, V., Papenfuss, A. T. HYSYS: have you swapped your samples. Bioinformatics. 33 (4), 596-598 (2017).
- Pengelly, R. J., et al. A SNP profiling panel for sample tracking in whole-exome sequencing studies. Genome Med. 5 (9), 89(2013).
- Subramanian, I., et al. Multi-omics data integration, interpretation, and its application. Bioinform Biol Insights. 14, 117793221989905(2020).
- Baião, A. R., et al. A technical review of multi-omics data integration methods: from classical statistical to deep generative approaches. Brief Bioinform. 26 (4), bbaf355(2025).
- Wang, Z., Zhao, Y., Zhang, L. Emerging trends and hot topics in the application of multi-omics in drug discovery: A bibliometric and visualized study. Curr Pharm Anal. 21 (1), 20-32 (2024).
- Morris, S., et al. Two algorithms for biospecimen comparison and differentiation using SNP genotypes. Pharmacogenomics. 14 (4), 379-390 (2013).
- Yoo, S., et al. MODMatcher: multi-omics data matcher for integrative genomic analysis. PLoS Comput Biol. 10 (8), e1003790(2014).
- Li, L., et al. SMAP is a pipeline for sample matching in proteogenomics. Nat Commun. 13 (1), 744(2022).
- Cibulskis, K., et al. ContEst: estimating cross-contamination of human samples in next-generation sequencing data. Bioinformatics. 27 (18), 2601-2602 (2011).
- Chun, H., Kim, S. BAMixChecker: an automated checkup tool for matched sample pairs in NGS cohort. Bioinformatics. 35 (22), 4806-4808 (2019).
- Lee, S., et al. NGSCheckMate: software for validating sample identity in next-generation sequencing studies within and across data types. Nucleic Acids Res. 45 (11), e103-e103 (2017).
- Javed, N., et al. Detecting sample swaps in diverse NGS data types using linkage disequilibrium. Nature Commun. 11 (1), 3697(2020).
- Wang, P. P. S., Parker, W. T., Branford, S., Schreiber, A. W. BAM-matcher: a tool for rapid NGS sample matching. Bioinformatics. 32 (17), 2699-2701 (2016).
- Katsanis, S. H., Wagner, J. K. Characterization of the standard and recommended codis markers. J Forensic Sci. 58, s1(2013).
- Yousefi, S., et al. BIOS consortium. A SNP panel for identification of DNA and RNA specimens. BMC Genomics. 19 (1), 90(2018).
- Huang, J., Chen, J., Lathrop, M., Liang, L. A tool for RNA sequencing sample identity check. Bioinformatics. 29 (11), 1463-1464 (2013).
- Goldfeder, R. L., et al. A bioinformatics approach for determining sample identity from different lanes of high-throughput sequencing data. PLoS ONE. 6 (8), e23683(2011).
- Crusoe, M. R., et al. Methods included: standardizing computational reuse and portability with the common workflow language. Commun ACM. 65 (6), 54-63 (2022).
- Ahmed, A. E., et al. Design considerations for workflow management systems use in production genomics research and the clinic. Scientific Rep. 11 (1), (2021).
- Li, H., Durbin, R. Fast and accurate short read alignment with Burrows-Wheeler transform. Bioinformatics. 25 (14), 1754-1760 (2009).
- Dobin, A., et al. STAR: ultrafast universal RNA-seq aligner. Bioinformatics. 29 (1), 15-21 (2013).
- Bergmann, E. A., et al. Conpair: concordance and contamination estimator for matched tumor–normal pairs. Bioinformatics. 32 (20), 3196-3198 (2016).