This study presents an improved feature point matching and 3D registration method for augmented reality tourism, enhancing alignment, stability, and matching accuracy. Combining enhanced ORB, LK optical flow, and improved homography matrix, the approach achieves higher correct matching rates and registration accuracy, improving virtual-real scene fusion in tourism applications.
A subscription to JoVE is required to view this content. Sign in or start your free trial.
Research Article
Augmented Reality Tourism Technology Based on an Improved ORB Algorithm and Homography Matrix
In This Article
Summary
Abstract
This study proposes an improved feature-point matching and 3D registration method for augmented reality tourism applications. This method addresses issues such as poor alignment, low stability in complex environments, and low feature-matching accuracy. An improved feature point matching method for tourism images is introduced, which combines the Speeded Up Robust Features (SURF) algorithm with an enhanced Oriented FAST and Rotated BRIEF algorithm. In this method, feature points are initially detected using the SURF algorithm, and their orientation is determined via wavelet response analysis. The Lucas-Kanade optical flow method is employed for feature point tracking. The random sample consensus algorithm is then used to eliminate mistracked points. Furthermore, an augmented reality tourism 3D registration technique based on an improved homography matrix is proposed to overcome the limitations of traditional homography matrices, such as low matching accuracy and registration efficiency. The performance of the proposed method was analyzed through comparative experiments against the SIFT, SURF, and original ORB algorithms under various image transformations, including scale, blur, illumination, and rotation. The correct matching rate and matching time were used as evaluation metrics. Simulation tests were conducted for 3D registration using different 3D models. Registration accuracy and successful registration counts were evaluated under rotational changes. The outcomes indicated that the average correct matching rate of the proposed algorithm is increased by 44.08%, 36.51%, and 16.09% under scale variation than the scale invariant feature transformation algorithm, speeded up robust features algorithm, and unimproved algorithm, respectively. The correct matching rate under fuzzy transformation increased by 33.46%, 19.65%, and 9.35%, respectively. The average registration accuracy of the proposed 3D registration technique was 98.74% under rotational transformation. The outcomes reveal that the study's suggested approach can successfully improve the scene's virtual and real-world fusion effect and offers a fresh approach to the use of augmented reality technology in the travel industry.
Introduction
Technology has emerged as a key tool for promoting the synergistic progress of culture and tourism in the fast-changing digital economy1. In recent years, augmented reality (AR) technology has seen a surge in adoption across various sectors, including tourism, education, medicine, and industry. AR is an emerging field within the broader technological landscape2. In the field of tourism, this technology is able to superimpose virtual information into real scenes, providing an immersive, interactive experience for tourists. This technology can not only enhance tourists' travel experiences but also innovate the tourism consumption scene and promote the digital transformation of the culture and tourism industry3. However, the widespread adoption of AR in dynamic and unstructured tourism environments is still hindered by significant technical challenges. Existing AR techniques often exhibit poor robustness in practical applications. They are characterized by low feature matching accuracy, inadequate alignment between virtual and real objects, and limited stability under complex environmental conditions, such as varying scales, changes in illumination, and occlusions4. These limitations can lead to a frustrating user experience, with virtual content jittering, drifting, or failing to anchor properly, thereby undermining the sense of immersion and realism. Therefore, exploring a robust and efficient AR technique for tourism that can reliably operate in real-world settings is a current research priority. As a fast feature point extraction (FPE) and description algorithm, oriented FAST and rotated BRIEF (ORB) are widely used in image FPE due to it's high efficiency and rotational invariance5.
Zhang et al.6 proposed an enhanced FPE method for ORB-SLAM2 dense maps, aiming to improve efficiency and reduce the cost of acquiring 3D maps of indoor environments. The method performed efficient extraction of feature points (FP) by means of asymptotic sample consistency to reduce the use of memory. It was found that the method could be used for the navigation process with superior FPE accuracy and high tracking efficiency6. Wu proposed a fast feature matching algorithm that combines ORB and random sample consensus (RANSAC) to address the issues of large-scale rotational alignment error, low alignment rate, randomness, and instability. The efficacy of this approach was substantiated by the findings, which demonstrated that the proposed method exhibited high FP matching accuracy and robust stability7. Chen et al. proposed a feature matching method that combines the improved ORB with the Lucas-Kanade (LK) optical flow (OF) algorithm to address the problem of low accuracy of image feature matching. The method utilized the Michelson contrast method for FPE, and the quadtree structure was used to homogenize the extracted FPs to reduce the computational amount of feature matching. The results demonstrated that the FP uniformity and accuracy of the method were improved by 0.22% and 50.47%, respectively8. Zuo et al. proposed an improved sphere algorithm for FP matching of fully focused optical field images, aiming to enhance the accuracy and robustness of the image FPE and matching method. The method was enhanced by refining the conventional ORB algorithm to augment the number and precision of FPE for light field fully focused images9. Anggara et al. suggested a feature extraction method that fuses the color map and ORB detector in AR. The method first extracted the speckle and edge features of the image using a feature-based natural feature tracking method and then converted the color image to a grayscale image using an ORB detector in an effort to improve the detection efficiency of the features. The results indicated that the suggested approach might successfully improve feature extraction10.
Because of its capacity to accurately combine virtual data and actual scenes with AR technologies, the homography matrix (HM) has garnered a lot of interest in recent years11,12. Kim et al. proposed a real-time online AR system based on HM. The method utilized a 3D camera with simultaneous localization and map building to track the scene information, and an HM was used to fill the image source frames in an attempt to enhance the image quality. The outcomes demonstrated that the method could effectively reduce visual inconsistencies and artifacts and improve the AR user experience13. Clement proposed a three-level filtering-based AR tracking direction-enhancing feature description method. The method employed an HM to describe the motion of the target between different frames in order to improve the robustness of image feature matching. The outcomes indicated that the method achieved repeatability scores of 100%, 100% and 99% for illumination change, blur change, and viewpoint change, respectively14. Liu et al. proposed a local motion matching method for remote sensing images based on HM, aiming to eliminate the wrong matching of image features. The method under consideration represented the consistency of image local motion by HM and introduced a resampling method. The findings demonstrated that the proposed method exhibited a superior matching performance15.
As reviewed above, the technical pursuit of robust feature matching and registration is fundamentally driven by the demand for its application to create compelling user experiences. To situate this technical work within the broader context of AR tourism research, it is essential to engage with recent studies that empirically examine the psychological and behavioral effects of AR on tourists. For instance, Zhu et al. explored the mechanism by which authenticity and narrative transportation in AR tourism influence word-of-mouth through AR attachment, using structural equation modeling. The results revealed that the AR attachment mediates the relationship between authenticity, narrative transportation, and word-of-mouth, providing a fresh approach to heritage tourism marketing15. Concurrently, Ngan and Lei analyzed the impact of AR on sports event experiences and revisit intention. Their study indicated that AR users exhibited significantly higher cognitive engagement and that experiential dimensions significantly impacted the intention to revisit, confirming the effectiveness of AR in enhancing the attractiveness and immersion of events16. Furthermore, Zhu et al. investigated the impact mechanism of tourist presence in AR experiences on Word-of-Mouth (WOM), using survey data from an AR exhibition at the Palace Museum. The results demonstrated that presence could positively influence WOM, and authenticity played a significant mediating role there17.
In conclusion, a significant body of research has been conducted by numerous scholars on AR techniques based on the ORB algorithm with HM, yielding superior results. However, the ORB algorithm still suffers from poor robustness and inefficiency of FPE under scale change, illumination change, and occlusion18. Furthermore, traditional HM is often a bottleneck characterized by low matching accuracy and registration efficiency. This leads to misalignment and instability of virtual objects in dynamic tourism environments. The discrepancy between the performance of current methods and the requirements for stable, immersive AR experiences in tourism remains a critical, unaddressed challenge. To address these persistent challenges and enable a more stable and immersive AR experience in tourism, this study is motivated to increase the effectiveness of FPE and 3D registration. This work has three theoretical contributions. First, it presents a new feature-matching framework that combines the scale-invariant property of the SURF detector with the improved computational efficiency of the ORB descriptor. This integration is enhanced by determining feature orientation via wavelet response and refining the point set using Harris corner criteria. This provides a more robust theoretical model for feature correspondence under transformations, making it more than just sequential. Second, it introduces a theoretical enhancement to the homography estimation process by employing a virtual-real object back-calculation method. This approach aims to overcome the limitations of traditional homography matrices by offering a more stable and precise projection model for 3D registration. Finally, by systematically combining these improved components, the study offers a consolidated theoretical approach for achieving superior virtual-real fusion, specifically tailored to the complexities of outdoor tourism scenarios.
This improved technique is highly relevant to key tourism stakeholders. It enables destination marketers and tour operators to develop stable and immersive AR applications that serve as unique value propositions. For cultural heritage site managers, it offers a reliable tool for creating educational overlays without damaging physical artifacts. Ultimately, for tourists, the method directly enhances the experience by providing a seamless and stable fusion of virtual information with the real environment. This eliminates the frustration of misaligned or jittering virtual content. As a result, immersion is significantly deeper, contextual understanding is enriched, and overall satisfaction with the tourism service increases. The innovativeness of this research is as follows: (1) The image is smoothed by Gaussian filtering, and the wavelet response is utilized to determine the direction of FPs. Moreover, to increase the accuracy and stability of FP detection, the best FPs are filtered by integrating with the Harris corner point detection technique. (2) The RANSAC algorithm is introduced to eliminate the mistracked FPs to further improve the robustness of feature matching. (3) The HM is enhanced by the virtual-real object back calculation method, which aims to address the limitations of the traditional HM, such as low FP matching accuracy and registration efficiency.
Access restricted. Please log in or start a trial to view this content.
Protocol
This section first proposes an FP matching method for tourism images combining SURF and an improved ORB algorithm to improve the robustness of FP matching. Then, the study proposes an AR tourism 3D registration technique based on improved HM to enhance the fusion effect between virtual information and the real world. The experiments were conducted using publicly available image datasets. Specifically, the Oxford Visual Geometry Group (VGG) dataset was utilized, which includes image sequences with variations in scale, blur, illumination, and viewpoint, and is widely adopted for evaluating feature matching and registration algorithms in computer vision. No ethical committee approval was required for the use of this publicly available dataset.
Combining SURF and an improved ORB algorithm for FP matching in tourism images
With the booming development of the tourism industry, the demand for AR technology in automated tourism services is increasing. ORB algorithm is an efficient FP detection and description algorithm. AR technology has been widely used19. However, in the process of FP matching tourism images, the existing ORB algorithm suffers from defects such as poor robustness to scale changes, low feature matching accuracy, and being time-consuming20. To increase the accuracy and robustness of matching, this study proposes a robust feature matching method integrating SURF with an improved ORB algorithm. To achieve scale invariance, the input image undergoes Gaussian filtering and pyramid construction. The SURF algorithm detects scale-invariant FPs, with orientations determined via wavelet responses. The feature quality is improved by refining the initial points using the Harris corner criterion and retaining the most distinctive ones. The Lucas-Kanade optical flow method tracks features across frames, and the RANSAC algorithm eliminates mismatched points. The methodological gap addressed here is not merely the sequential application of SURF and ORB, but a novel hybridization strategy designed to overcome the specific limitations of standard hybrids in complex tourism environments. Unlike conventional SURF-ORB approaches, which use SURF for detection and then apply an ORB descriptor directly, the present method introduces two critical enhancements. First, the orientation of each FP localized by SURF is recalculated using its wavelet response. This provides a more robust directional estimate than SURF alone using the standard Haar-wavelet-based method. Second, and more importantly, the initial SURF points are not used directly. Instead, they are rigorously refined using the Harris corner criterion to filter out non-distinctive points with low responses located in flat regions or along edges.
Image preprocessing
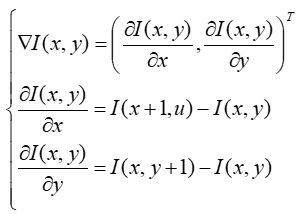
In the preprocessing stage of tourism images, the study extracts the features from grayscale images. To further characterize the local features of the image, the study uses the gradient component to identify and classify the image21. Equation (1) demonstrated its expression.
 (1)
(1)
In Equation (1) I(x,y) denotes the pixel value of the image at coordinate (x,y). 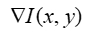 denotes the gradient vector of the image at (x,y).
  and
and  display the partial derivatives of the image in the x and y directions, respectively. T denotes the transpose of the gradient vector.
Feature point detection
After recognizing the image by gradient components, the study uses features from the accelerated segments test (FAST) in the ORB algorithm to detect the FPs of the image. Moreover, the FPs are violently matched using the binary robust independent elementary features (BRIEF) description algorithm22. The schematic of feature detection and matching of this algorithm is shown in Figure 1.
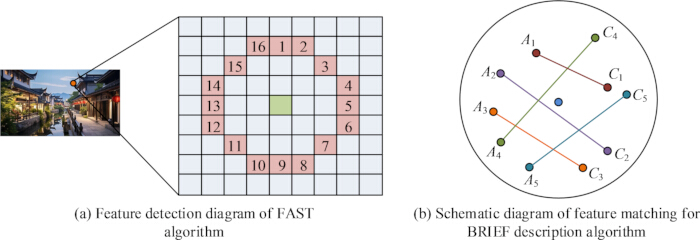
Figure 1: Schematic diagram of feature matching between the FAST algorithm feature detection and the BRIEF description algorithm. Please click here to view a larger version of this figure.
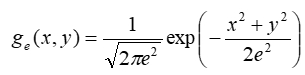
Figure 1 illustrates the feature detection process of the FAST and BRIEF algorithms. Figure 1A is a schematic diagram of feature detection using the FAST algorithm. A 16 pixel circular template is used to compare brightness around the central pixel for rapid detection of corner features in the image. Figure 1B is a schematic diagram of feature matching in the BRIEF algorithm. By selecting several pairs of pixels around the feature points for grayscale comparison, binary descriptors are generated, and brute force matching is used to achieve the correspondence of feature points between two images. The enhancement involves the initial utilization of the Gaussian filtering method, which serves to smooth the image and mitigate high-frequency noise. Subsequently, the down-sampling method is employed to reduce the spatial resolution of the image, thereby reducing the computational complexity while preserving the image's primary features. The study employs an image pyramid construction method, leveraging the aforementioned two techniques to ensure that image FPs exhibit scale-invariance properties23. The expression for smoothing the image by a low-pass Gaussian filter is shown in Equation (2).
 (2)
(2)
In Equation (2), ge(x,y) denotes the Gaussian filter function. e is the standard deviation (SD) of the Gaussian function. exp denotes the exponential function. The image pyramid constructed by Gaussian filtering is shown schematically in Figure 2.
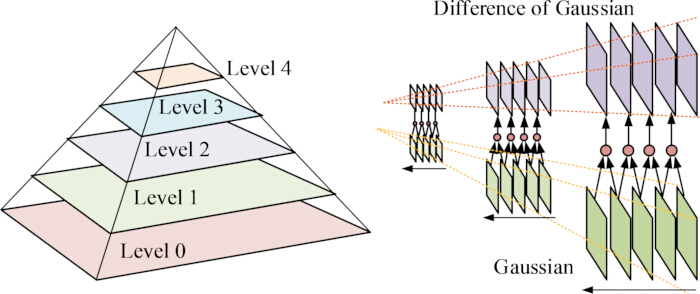
Figure 2: Schematic diagram of the image pyramid constructed by Gaussian filtering. Please click here to view a larger version of this figure.
Figure 2 shows the image pyramid structure, where multiple images of lower resolution are gradually generated by Gaussian filtering and downsampling. Among them, the Gaussian filter reduces the high-frequency noise in the image by blurring it via a convolution operation. As a visual checkpoint during this preprocessing stage, the generated image pyramid can be displayed. It should be noted that each level of the pyramid presents a progressively lower resolution of the original image. There is a noticeable increase in blurriness and a reduction in fine details due to the applied Gaussian filtering and downsampling. To enhance the efficacy of identifying the FPs in an image, the study employs a SURF algorithm for localizing these FPs in the image. This method involves quantifying the surrounding region of the FP and leveraging the wavelet response to ascertain the direction of the FP. Due to the existence of duplicated and invalid FPs extracted by SURF, their excessive number will reduce the recognition speed of target image (TI) features. Therefore, the study utilizes the Harris angle point detection algorithm to identify the optimal image FPs24. Equation (3) displays the algorithm's angular response value.
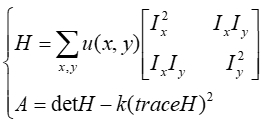 (3)
(3)
In Equation (3), H denotes the Harris matrix. u(x,y) denotes the weight function of the window. Ix and Iy denote the size of the gray value (GV) of the pixel point. A denotes the response value of the Harris angle. det H and traceH denote the determinant and trace of the Harris matrix, respectively. k denotes the coefficient value. The schematic of the direction of the FPs selected by the SURF algorithm and the sliding window of the Harris angle detection algorithm are shown in Figure 3.
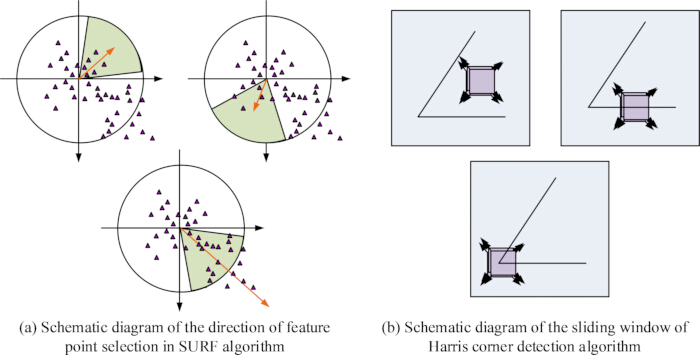
Figure 3: Schematic diagram of SURF algorithm, FP selection, and sliding window for the Harris corner detection algorithm. Please click here to view a larger version of this figure.
Figure 3 shows the composition of the SURF algorithm for detecting FPs in an image. Figure 3A shows the schematic diagram of feature point direction selection in the SURF algorithm. By calculating the main direction of Haar wavelet response in the feature point neighborhood, the rotation invariant direction of the feature point is determined, usually represented intuitively by arrows or directional line segments. Figure 3B is a schematic diagram of the Harris corner detection algorithm's sliding window, showing the movement process of the window within the image area. Corner points are detected by calculating the grayscale changes of pixels within the window, and areas with high response values are identified as corner points.
Feature matching
Subsequent to detecting image FPs, the study utilizes the LK OF method to track the detected image FPs. This method calculates the motion between neighboring image frames by tracking the movement of FPs in the image to achieve FP matching in the video sequence. The LK OF method needs to satisfy the assumptions of constant pixel GV, small motion, and region motion consistency when calculating the motion between adjacent image frames25. The Lucas-Kanade method is strategically adopted considering its computational efficiency, which is crucial for real-time AR tourism applications. Its assumptions are mitigated within the specific context. The high frame rate of video capture generally ensures small inter-frame displacements, which satisfies the requirement of small motion. While absolute brightness constancy is ideal, the short tracking window between consecutive frames minimizes severe violations. Most importantly, the subsequent RANSAC algorithm robustly handles potential tracking errors arising from assumption violations by filtering outliers. Thus, LK serves as an efficient initial tracker whose output is rigorously validated, making it suitable for a real-time system, in which balancing speed and robustness is essential. According to the assumption of constant pixel GV, the expression is shown in Equation (4).
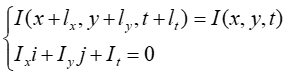 (4)
(4)
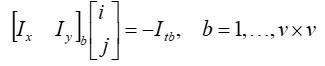
In Equation (4), I(x,y,t) denotes the pixel GV of the image at position (x,y) at the moment t . Ix and Ix denote the displacement of the pixel in the x and y directions, respectively. i and j denote the OF components of the pixel point. Ix, Iy, and It denote the difference of the image in the x, y and t directions, respectively. The assumption of regional motion consistency is calculated in Equation (5).
 (5)
(5)
In Equation (5), Itb denotes the partial derivative of the b th pixel point in the domain in the time direction t . v x v denotes the size of the selected domain area. b denotes all pixel points within the domain. In conclusion, the present study employs the BRIEF descriptor to match the tracked FPs and the RANSAC algorithm to reject the FPs that are mistracked by the ORB. This combination of methods serves to enhance the robustness of feature matching26. Figure 4 exhibits the schematic diagram of the LK OF method.
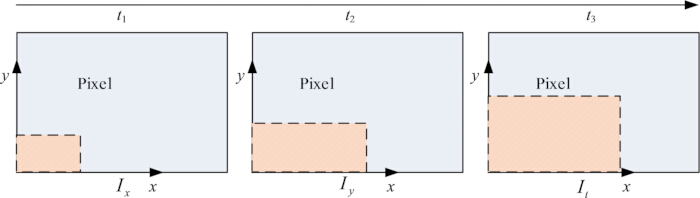
Figure 4: Schematic diagram of the LK OF method. Please click here to view a larger version of this figure.
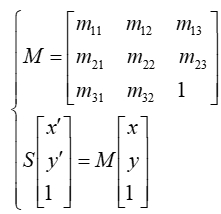
Figure 4 shows the implementation process of LK streaming optical hair, which uses an iterative optimization method for FP displacement between adjacent frames. For qualitative validation of the feature matching algorithm, the matched FPs between the template and test images can be visually overlaid. Correctly matched point pairs are typically connected by green lines or marked with green indicators. Conversely, the RANSAC algorithm can display outliers with red markers. This provides an immediate visual assessment of matching robustness and accuracy before quantitative analysis. The study employs the RANSAC algorithm to compute the HM of the corresponding FPs in the image, thereby eliminating those that are not correctly matched. The FPs that are accurately matched are then retained. In this case, the HM and the scale parameter expression of the RANSAC algorithm are shown in Equation (6).
 (6)
(6)
In Equation (6), M denotes the HM. m denotes the element in the matrix M. S denotes the scale parameter. (x,y) and (x',y') denote the FP locations of the template image and the test image, respectively. Subsequent to acquiring the coordinates of the FPs of the test image, the study undertakes a comparative analysis of the distances between them and the matched FPs. Equation (7) illustrates that it also updates the number of iterations and determines the number of interior points.
E = log(1 - c)/log(1 - ηn) (7)
In Equation (7), E is the iterations. c denotes the confidence level. η denotes the proportion of interior points. n is the quantity of samples. Then the expression for the SD of the iteration E is shown in Equation (8).
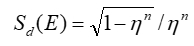 (8)
(8)
In Equation (8), Sd(E) denotes the SD. The improvement of the ORB algorithm described above is shown to provide a high-quality feature matching basis for the subsequent 3D registration technology. This improvement shows higher accuracy and robustness in complex scenes. Some of these scenes include scale change, light change, and occlusion.
The pseudocode for improved ORB with SURF and enhanced homography for AR tourism is as follows.
Algorithm 1: Improved ORB with SURF and Enhanced Homography for AR Tourism
Input: Tourism image sequence I, 3D virtual model M
Output: Rendered AR scene with virtual object registered
// Step 1: Image Preprocessing
1: I_gray ← ConvertToGrayscale(I)
2: I_smooth ← GaussianBlur(I_gray, kernel=5×5, σ=1.2)
3: Pyramid ← BuildImagePyramid(I_smooth, levels=4, scale=1.2)
// Step 2: Feature Point Detection
4: keypoints_SURF ← SURF_Detect(Pyramid, HessianThreshold=1000)
5: for each kp in keypoints_SURF do
6: orientation ← ComputeWaveletResponse(kp)
7: end for
8: keypoints_Harris ← HarrisCornerFilter(keypoints_SURF, k=0.04)
9: descriptors ← ImprovedORB_Describe(keypoints_Harris)
// Step 3: Feature Matching
10: keypoints_tracked ← LucasKanadeOpticalFlow(keypoints_Harris, window=15×15)
11: matches ← BruteForceMatcher(descriptors)
12: inliers, H ← RANSAC(matches, maxIterations=2000, reprojThreshold=3.0)
// Step 4: 3D Registration with Improved Homography
13: H_improved ← ComputeImprovedHomography(inliers, camera_intrinsics)
14: R, t ← DecomposeHomography(H_improved)
15: pose ← ComposeCameraPose(R, t)// Step 5: AR Rendering
16: virtual_object ← Load3DModel(M)
17: scene_rendered ← OpenGL_Render(virtual_object, pose, background=I)
18: return scene_rendered
AR tourism 3D registration technique based on improved HM
After accurately matching the features of tourism images through the FP matching method, it needs to be further applied to AR technology. 3D registration technology is a foundational technology for the realization of AR systems. It calculates the camera's pose information in the real world through the projection of a target tourism image. This enables accurate matching and fusion of virtual objects and real scenes27. The HM can map the virtual object to the real world from the user's perspective, which enhances the fusion effect between virtual information and the real world. Furthermore, it can solve the problem of registering the virtual reality when the logo is partially obscured. However, the registration efficiency of HM in the actual 3D registration technology is low, and it leads to virtual object misalignment, which leads to the instability of virtual objects28. Therefore, this study proposes a 3D registration technique based on an improved HM. Using accurate FP pairs from Phase 1, enhanced HM is computed via a virtual-to-real object back-calculation method that incorporates camera intrinsics. This method effectively addresses the low registration efficiency and virtual object misalignment of traditional methods in dynamic scenes. The matrix is decomposed into a rotation matrix and a translation vector to define the camera pose. The OpenGL rendering engine precisely projects 3D virtual models into the live video stream based on pose parameters. Texture mapping and lighting models ensure physically consistent fusion.
3D registration and visualization
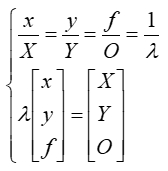
For the realization of the 3D registration technique, the study first needs to build a pinhole imaging model to map the 3D real world to a 2D image. The expression of this model is displayed in Equation (9).
 (9)
(9)
In Equation (9), X , Y , and O denote the three axes of the camera CS. (x,y,f) denotes the coordinate vector. f denotes the focal length (FL). λ denotes the scale factor. As demonstrated in Figure 5, the current study examines the imaging properties of the pinhole camera by using the transformation relationship between the image CS and the camera CS.
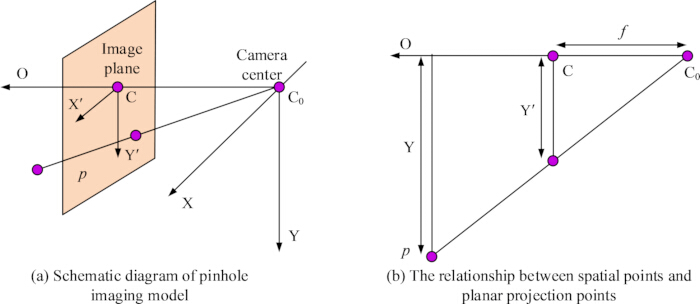
Figure 5: Pinhole imaging model and the relationship between spatial points and planar projection points. Please click here to view a larger version of this figure.
Figure 5 shows the basic structure of pinhole imaging. Figure 5A is a schematic diagram of the pinhole imaging model, which describes the basic geometric structure of projecting a three-dimensional scene onto a two-dimensional imaging plane through a small hole at the center of the camera, reflecting the principles of ray propagation and perspective projection. Figure 5B further illustrates the process of projecting spatial points onto the corresponding points on the imaging plane through the camera center, clarifying the proportional relationship between focal length, image point coordinates, and object point coordinates. After constructing the pinhole imaging model, the study further employs the HM to construct the relationship mapping between the template and the real scene images under camera capture. It is assumed that the feature matching points of two images I1 and I2 are in the same plane. The plane needs to satisfy the expression shown in Equation (10).
NZ P + d = 0 (10)
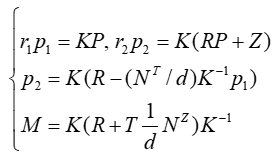
In Equation (10), P denotes the plane. N denotes the normal vector of the plane P. d denotes the distance from the plane P to the origin. Z denotes the translation vector. For rotations and translations, the study uses the singular value decomposition method for their extraction. The expression is shown in Equation (11)29.
 (11)
(11)
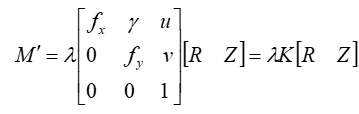
In Equation (11), p1 and p2 denote the pixel coordinates of the feature matching point pairs of shadows in images I1 and I2 , respectively. r1 and r2 denote the scaling factors of the pixel points in images I1 and I2 , respectively. K denotes the internal reference matrix of the camera. R denotes the rotation matrix. The HM has high computational complexity and is prone to the problem of FP matching error. Therefore, the study improves it by using the virtual and real object inverse calculation method30. The improved HM expression is displayed in Equation (12).
 (12)
(12)
In Equation (12), M' denotes the improved HM. fx and fy denote the FLs of the camera along the X and Y -axis, respectively. u and v denote the principal point coordinates. γ denotes the skew parameter. The physical transformation of the method is shown in Equation (13).
![Camera transformation matrix equations M'=K·T', T'=[R|Z]=[tx, ty, to|Z], diagram.](/files/ftp_upload/69514/69514eq14.jpg "figure-protocol-19") (13)
(13)
In Equation (13), T' denotes the physical transformation matrix. tx, ty and to denote the rotation components of the three coordinate axes. [R|Z] denotes the transformation matrix of the world and camera CS. In the implementation of AR technology, the expression of the mapping between the template and the image of the real traveling scene is shown in Equation (14).
![Mathematical equations of image processing, equations: Id=K[tx,ty|Z]Is=MTIs, Is=M'^-1Id.](/files/ftp_upload/69514/69514eq15.jpg "figure-protocol-20") (14)
(14)
In Equation (14), Is and Id denote the points on the reference and TIs, respectively. The study further calculates the alignment accuracy of the improved HM to investigate the alignment effectiveness of the method, as expressed in Equation (15).
 (15)
(15)
In Equation (15), Pre(M') denotes the alignment accuracy of the improved HM. (xa,ya,oa) denotes the actual FPs. (xb,yb,ob) denotes the aligned FPs. n denotes the number of groups of matched points. Figure 6 displays the mapping between the schematic diagram and the photos of the upgraded HM.
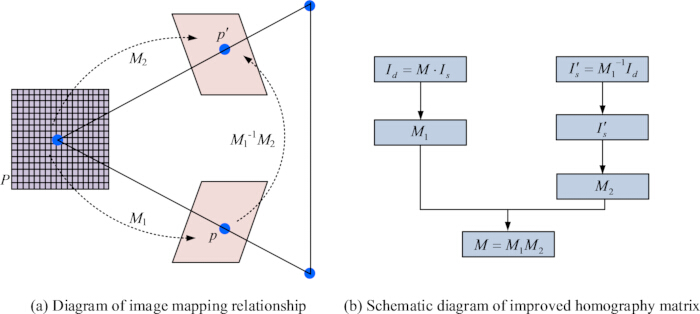
Figure 6: Mapping relationship of images and the schematic diagram of the improved HM. Please click here to view a larger version of this figure.
As illustrated in Figure 6, there is a clear correspondence between the template image and the TI. Following the application of the improved HM, a key visual checkpoint involves the warping and alignment of the template image onto the target scene image. The edges of the projected template should closely align with the corresponding features in the TI. During the final AR rendering, visually inspect the virtual 3D model to ensure it is persistently and accurately anchored to the correct position and orientation in the real-world scene. There should be no noticeable jitter or misalignment as the camera perspective changes.
The study demonstrates the mapping of the template image through an enhanced but-for influence matrix. To achieve real-time interaction between virtual objects and actual tourism sceneries, the study uses the OpenGL technology to render 3D models for the construction of the AR tourism system. The technique first sets up the OpenGL context, loads the 3D model of the virtual tourist elements, and computes with texture mapping and lighting. Then, the real-time video stream captured by the camera is used as a background to provide a reference for rendering virtual objects. Virtual objects are accurately superimposed into the real world using an HM, which renders the virtual objects in the correct position and orientation to blend them with the real-world scene. In the AR tourism system, in which the video is captured through the OpenCV library for the real-time video of the tour31. Image processing uses an optimized ORB algorithm to identify and match features in video frames. In the 3D registration module, the study uses an improved HM to fuse virtual and reality. The final output and interaction are displayed through OpenGL technology. The implementation process of AR tour technology is illustrated in Figure 7, which demonstrates the overall implementation process of AR tour technology. Figure 7 presents the system implementation flowchart of the AR tourism technology. After system startup, the real-time video stream is first captured via the camera, from which the target image is extracted. The process then enters the feature processing stage, sequentially performing feature point extraction and description to construct image features. If the feature point matching is successful, the system proceeds to the 3D tracking registration phase, where camera pose parameters are calculated. This is combined with 3D models from the virtual material library to achieve virtual-real fusion, and the final fused AR effect is displayed to the user in real-time. If the matching fails, the RANSAC algorithm is employed to eliminate mismatched points, and the feature processing stage is re-entered to ensure system stability and robustness. The entire process forms a complete closed loop from image acquisition and feature processing to 3D registration, virtual-real fusion, and interactive display, illustrating the technical pathway for AR tourism systems to achieve real-time, stable virtual-real fusion in dynamic scenes.
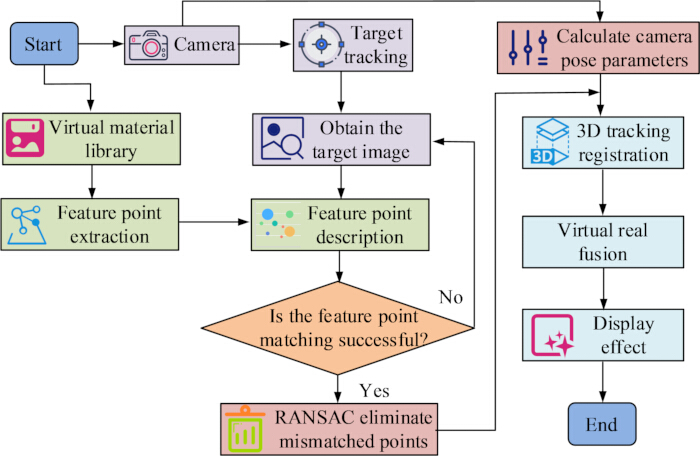
Figure 7: Schematic diagram of the implementation process of AR tourism technology. Please click here to view a larger version of this figure.
Experimental setup and materials
To ensure the reproducibility of the experiments, the hardware specifications, software environment, and datasets used in this study are explicitly listed in Table 1.
| Category | Item | Specification / Version |
| Hardware | Camera | Logitech C920 HD Pro Webcam |
| Computer Processor | AMD Ryzen 7 3700X 8-Core Processor | |
| Computer Memory | 32 GB RAM | |
| Operating System | Windows 10 (64-bit) | |
| Software and Libraries | Programming Language | C++ |
| Development Environment | Microsoft Visual Studio 2019 | |
| Computer Vision Library | OpenCV 4.5.1 | |
| Graphics API | OpenGL 4.6 | |
| Simulation Platform | Visual Studio Simulation Tools | |
| Dataset | Primary Dataset | Oxford Dataset |
Table 1: Experimental setup: hardware, software, and dataset specifications.
In OpenCV, the Gaussian blur is applied using the GaussianBlur() function. The image pyramid is constructed using buildPyramid(). The SURF detector is initialized with SURF.create(), setting the Hessian threshold to 400. The Harris corner response is computed using cornerHarris(), and non-maximum suppression is subsequently applied to filter the keypoints. The LK optical flow is computed using the calcOpticalFlowPyrLK() function, which implements the pyramidal Lucas-Kanade method. The findHomography() function is utilized for homography estimation, with the method flag set to RANSAC to leverage the specified reprojection threshold. The resulting HM is then used with perspectiveTransform() to validate inlier points. In the OpenGL rendering pipeline, the HM is converted to a camera pose and set using glLoadMatrix(). The 3D virtual models are loaded as .obj files and rendered using standard OpenGL transformation commands (glTranslate, glRotate). The real-time video feed from OpenCV is passed to OpenGL as a texture using glTexImage2D() to achieve the final AR overlay. The key parameters for the algorithms used in this study are explicitly defined in Table 2.
| Algorithm / Component | Parameter | Value |
| Gaussian Filter | Kernel size | 5 × 5 pixels |
| Standard deviation | 1.2 | |
| LK Optical Flow | Window size | 15 × 15 pixels |
| RANSAC | Maximum iterations | 2000 |
| Reprojection threshold | 3.0 pixels | |
| ORB feature detector | Maximum number of features | 1000 |
| Scale factor (Pyramid) | 1.2 | |
| Number of pyramid levels | 4 | |
| SURF feature detector | Hessian threshold | 1000 |
| Harris corner detector | Aperture size | 3 |
| k-value | 0.04 |
Table 2: Key algorithm parameters for reproducibility.
Access restricted. Please log in or start a trial to view this content.
Results
Performance of the combined SURF and improved ORB algorithm for FP matching tourism images
To establish robust performance baselines and control comparisons, the proposed algorithm is evaluated against three widely used feature matching algorithms: the scale-invariant feature transform (SIFT), speeded-up robust features (SURF), and the original, unimproved ORB algorithm. These algorithms serve as control groups, allowing for a direct assessment of the performance gains attribu...
Access restricted. Please log in or start a trial to view this content.
Discussion
The study proposed a FP matching method for tourism images combining SURF and an improved ORB algorithm, aiming to improve the matching accuracy of features. To further realize the accurate matching and fusion between the proposed objects and the real scene, the study proposed an AR tourism 3D registration technique based on improved HM. Regarding 3D registration, the findings illustrated that the ARA was 98.74% and the average number of SRs for 3D registration under rotational transformation was 68. It indicated that th...
Access restricted. Please log in or start a trial to view this content.
Disclosures
The authors declare that they have no competing interests to disclose.
Materials
| Name | Company | Catalog Number | Comments |
|---|---|---|---|
| AMD Ryzen 7 3700X 8-Core Processor | AMD | Ryzen 7 3700X | |
| Camera | Logitech | C920 HD Pro Webcam | |
| Computer Memory | / | 32 GB RAM | |
| Logitech C920 HD Pro Webcam | Logitech | C920 | |
| Microsoft Visual Studio 2019 | Microsoft | 2019 | |
| OpenCV | OpenCV Foundation | 4.5.1 | |
| OpenGL | Khronos Group | 4.6 | |
| Oxford Dataset | University of Oxford | / | |
| Programming Language | / | C++ | |
| Visual Studio Simulation Tools | Microsoft | Included in VS 2019 | |
| Windows 10 (64-bit) | Microsoft | 10 (64-bit) |
References
- Tang, R. Digital economy drives tourism development—Empirical evidence based on the UK. Econ Res. 36 (1), 2003-2020 (2023).
- Nur Amin, S., et al. An augmented reality-based approach for designing interactive food menu of restaurant using android. Artif Intell Appl. 1 (1), 26-34 (2022).
- Ahmad, H., Butt, A., Muzaffar, A. Travel before you actually travel with augmented reality–role of augmented reality in future destination. Curr Issues Tour. 26 (17), 2845-2862 (2023).
- Long, X. M., Chen, Y. J., Zhou, J. Development of AR experiment on electric-thermal effect by open framework with simulation-based asset and user-defined input. Artif Intell Appl. 1 (1), 52-57 (2022).
- Xie, Y., Wang, Q., Chang, Y., Zhang, X. Fast target recognition based on improved ORB feature. Appl Sci. 12 (2), 786-799 (2022).
- Zhang, L., Zhang, Y. Improved feature point extraction method of ORB-SLAM2 dense map. Assembly Automat. 42 (4), 552-566 (2022).
- Wu, K. Creating panoramic images using ORB feature detection and RANSAC-based image alignment. Adv Comput Commun. 4 (4), 220-224 (2023).
- Chen, Q., et al. Horticultural image feature matching algorithm based on improved ORB and LK optical flow. Remote Sens. 14 (18), 4465-4482 (2022).
- Zuo, Y., Guan, H., Duan, F., Wu, T. A light field full-focus image feature point matching method with an improved ORB algorithm. Sensors. 23 (1), 123-136 (2022).
- Anggara, D. W., et al. Integrated colormap and ORB detector method for feature extraction approach in augmented reality. Multimed Tools Appl. 81 (25), 35713-35729 (2022).
- Tian, J., Wu, Y., Cai, Y., Fan, H., Yu, W. A novel mosaic method for spaceborne ScanSAR images based on homography matrix compensation. Remote Sens. 13 (15), 2866-2885 (2021).
- Kim, T., Kim, G. J. Real-time and on-line removal of moving human figures in hand-held mobile augmented reality. Vis Comput. 39 (7), 2571-2582 (2023).
- Clement, J. C. Directional intensified feature description using tertiary filtering for augmented reality tracking. Sci. Rep. 13 (1), 2571-2582 (2023).
- Liu, J., Liang, A., Zhao, E., Pang, M., Zhang, D. Homography matrix-based local motion consistent matching for remote sensing images. Remote Sens. 15 (13), 3379-3400 (2023).
- Zhu, C., Io, M. U., Hall, C. M., Ngan, H. F. B., Peralta, R. L. How to use augmented reality to promote a destination? The mediating role of augmented reality attachment. Int J Tour Res. 26 (1), e2603(2024).
- Ngan, H. F. B., Lei, W. S. Examining the effects of augmented reality on sport event experiences and revisit intention: A comparative analysis between AR and non-AR users. Issues Tour. 28 (4), 666-679 (2025).
- Zhu, C., Io, M. U., Hall, C. M., Ngan, H. F. B., Peralta, R. L. Exploring the influence of augmented reality on tourist word-of-mouth through the lens of museum tourism. J Herit Tour. 20 (1), 78-91 (2025).
- Jia, X., Xu, T., Bao, K., Wang, D., Dai, Y. Multi-point displacement measurement method based on ORB feature detection. Insight. 67 (2), 73-79 (2025).
- Chen, J., Ramakrishnan, K. K., Dhakazl, A., Ran, X. Networked architectures for localization-based multi-user augmented reality. IEEE Commun Mag. 61 (12), 104-110 (2023).
- Yang, M., Wang, S., Zhang, N., Zhou, A., Ma, X. Survey on tracking and registration technology for mobile augmented reality. Int J Web Grid Serv. 18 (2), 99-140 (2022).
- Lee, J., Lee, H., Mun, D. 3D convolutional neural network for machining feature recognition with gradient-based visual explanations from 3D CAD models. Sci Rep. 12 (1), 14864-14877 (2022).
- Ren, J., et al. Matching algorithms: Fundamentals, applications and challenges. IEEE Trans Emerg Top Comput Intell. 5 (3), 332-350 (2021).
- Li, L., Yang, M. Point cloud registration based on direct deep features with applications in intelligent vehicles. IEEE Trans Intell Transp Syst. 23 (8), 13346-13357 (2021).
- Hao, Z., Wang, X., Zheng, S. Recognition of basketball players’ action detection based on visual image and Harris corner extraction algorithm. J Intell Fuzzy Syst. 40 (4), 7589-7599 (2021).
- Liu, Q., Xi, X., Zhang, W., Yang, L., Hanajima, N. Improved image matching algorithm based on LK optical flow and grid motion statistics. Int J Comput Appl Technol. 68 (1), 49-57 (2022).
- Zhang, D., Zhu, J., Wang, F., Hu, X., Ye, X. GMS-RANSAC: A fast algorithm for removing mismatches based on ORB-SLAM2. Symmetry. 14 (5), 849-860 (2022).
- Fu, H., Yang, H., Chen, C., Zhang, H. 3D registration based on V-SLAM and application in augmented reality. J Comput Methods Sci Eng. 22 (3), 911-923 (2022).
- Bao, Y., Liu, J., Jia, X., Qie, J. An assisted assembly method based on augmented reality. Int J Adv Manuf Technol. 135 (1), 1035-1050 (2024).
- Cattari, N., Condino, S., Cutolo, F., Ferrari, M., Ferrari, V. In situ visualization for 3D ultrasound-guided interventions with augmented reality headset. Bioengineering. 8 (10), 131-146 (2021).
- Hong, H. A measurement method of the focal distance of the virtual image in an augmented reality or virtual reality device. J Soc Inf Disp. 29 (4), 230-236 (2021).
- Dinara, G., Evgeniy, Z., Vlada, K. Using OpenCV for augmented reality applications. Artif Life Robot. 3 (3), 179-184 (2022).
- Xu, H., Yuan, J., Ma, J. Murf: Mutually reinforcing multi-modal image registration and fusion. IEEE Trans Pattern Anal Mach Intell. 45 (10), 12148-12166 (2023).
- Li, W., Wang, J., Liu, M., Zhao, S., Ding, X. Integrated registration and occlusion handling based on deep learning for augmented-reality-assisted assembly instruction. IEEE Trans Ind Inform. 19 (5), 6825-6835 (2022).
- Lim, H., Kim, B., Kim, D., Mason Lee, E., Myung, H. Quatro++: Robust global registration exploiting ground segmentation for loop closing in LiDAR SLAM. Int J Rob Res. 43 (5), 685-715 (2024).
- Xu, N., et al. CubeMuseum AR: A tangible augmented reality interface for cultural heritage learning and museum gifting. Int J Hum Comput Interact. 40 (6), 1409-1437 (2024).
- Arshad, S., Kim, G. W. A robust feature matching strategy for fast and effective visual place recognition in challenging environmental conditions. Int J Control Autom Syst. 21 (3), 948-962 (2023).
Access restricted. Please log in or start a trial to view this content.