This protocol visualizes a remote sensing-AI-IoT integrated workflow for real-time ecological monitoring and decision support in digital agriculture.
Research Article
Research on Ecological Monitoring of Digital Agriculture Industry Driven by Remote Sensing-Smart Devices-AI Collaboration
In This Article
Summary
Abstract
Continuous ecological monitoring is required for digital agriculture, but traditional approaches usually rely on isolated data sources such as satellites, UAVs, or field sensors, which limit spatial coverage, temporal frequency, and real-time decision-making. A single protocol that combines multi-scale data and describes how to create an effective and scalable monitoring workflow is desperately needed. To provide a dependable and automated ecological monitoring system for digital agriculture, this research aims to provide a clear, sequential process for combining remote sensing, smart field-based equipment, and Artificial Intelligence (AI) techniques. Developing an integrated monitoring method that provides reliable, high-resolution ecological data remains possible by adhering to the protocol. Harmonized datasets, robust data streams, and automated analytical outputs appropriate for operational agricultural monitoring are produced by the integrated Long Short-Term Memory with Transformer and Graph Neural Network (LSTM/Transformer/GCN) technique. Experiments were carried out in the Huang-Huai-Hai Plain (China) over a full crop rotation cycle (June 2023-May 2024). Results showed that fused data improved overall integrity to 92.3 ± 2.1% (23.5% higher than single RS data), reducing RMSE of soil volumetric water content (to 1.78 ± 0.25%) and crop NDVI (to 0.04 ± 0.01) by over 50%. Investigators and practitioners are able to utilize the structured methodology to implement real-time ecological monitoring in a useful and flexible way. It facilitates effective, automated, and scalable digital farming applications by integrating remote sensing, advanced technology, and AI applications.
Introduction
Digitization of agriculture has become a necessity in the world to solve the twofold crises of food security and conservation of agricultural systems. As the global population is expected to grow to 9.7 billion by the year 2050, agricultural output will have to increase by a substantial margin, yet conventional intensive agriculture has already caused devastating ecological effects, including soil salinization, loss of biodiversity, and water pollution, which has created a dilemma between productivity and ecological wellbeing1. Here, the combination of remote sensing (RS), smart devices, and artificial intelligence (AI) may be regarded as a disruptive technology to digital agricultural ecological monitoring, as it gathers the macro-scale of observation, micro-scale sensing, and intelligent analysis to close the gap between agricultural production and ecological protection. Together, RS provides macro-scale environmental observation through high-resolution satellite2 and UAV multispectral imagery (0.1-0.5 m), IoT sensors3 deliver continuous field-level measurements such as soil moisture, EC, and pH at 10-50 cm depth along with 10 min weather updates, and AI models integrate these multisource inputs into coherent ecological insights for monitoring dynamic agricultural environments4. Despite these technological advancements, the synergistic potential of the three technologies has not been fully exploited, limiting their ability to support comprehensive industrial ecological monitoring in digital agriculture.
While remote sensing, smart devices, and AI have been applied in agricultural monitoring individually, critical gaps persist regarding their collaborative use for industrial ecological assessment -- directly aligning with the core focus of this study:
Gap 1: Production-living-ecological integration indicators are missing; current RS-IoT studies only monitor yield or soil moisture without linking rural livelihoods and habitat services5.
Gap 2: Circular-bioeconomy metrics are absent; the potential of recycling agricultural ash or polymer-based water retainers is not quantified, so ecological footprints are incomplete6.
Gap 3: Sub-field water-security early warning is lacking -- high-resolution imagery is rarely fused with ground aquifer or riparian-identifier data, hampering timely irrigation-deficit alerts in peri-urban areas7.
This study is motivated by the urgent need to address the above gaps and realize the full potential of RS-UAV-IoT-AI integrated system for digital agricultural industrial ecological monitoring. Drawing on prior advancements -- such as data-driven sustainable agriculture framework8 and multimodal RS research8 -- this study aims to:
This study designs a distributed collaborative architecture spanning perception, network, data, intelligence, and application layers to unify remote sensing for macro-scale observation, smart devices for micro-scale sensing, and AI for intelligent analysis. It further develops industrial-level ecological indicators that connect crop-level parameters with broader ecosystem health, overcoming the narrow scope of existing metrics. In addition, edge computing is integrated into smart device-AI collaboratiods to reduce system latency to below 500 ms, thereby enabling real-time ecological early warnings and satisfying the requirements of industrial-scale monitoring
By achieving these goals, this study seeks to provide a scalable, collaboration-driven solution for digital agricultural industrial ecological monitoring, reconciling food security with ecological sustainability and advancing digital agriculture from isolated technology application to integrated industrial ecosystem management.
RS technology provides an efficient means for large-scale agricultural ecological monitoring. With its macro perspective, satellite RS can acquire regional-scale information on vegetation, soil, and meteorology9. Sentinel-2 and Landsat satellites are widely used for vegetation monitoring. Owing to its high spatial resolution and short revisit cycle, Sentinel-2 is particularly suitable for capturing vegetation dynamics and is commonly used to derive NDVI for assessing vegetation condition10. Landsat-9 Landsat- with a medium resolution (30 m in visible/near-infrared bands and 100 m in thermal infrared bands) and a 16-day revisit period is used in research, including land surface temperature measurements. Fine-scale crop health monitoring, high-resolution commercial satellites such as PlanetScope, with a spatial resolution of approximately 3 m and daily revisit capability, can be employed to monitor small agricultural plots ranging from 0.1 to 1 ha. This compensates for the limitations of traditional medium-resolution satellites, such as Sentinel-2 and Landsat, which may be less effective in capturing crop heterogeneity at such fine spatial scales.
IoT devices enable real-time and sophisticated monitoring of farmland environments. Soil sensors continuously measure key parameters such as moisture, electrical conductivity, and pH, providing a foundation for precision irrigation and fertilization11. Weather stations provide essential meteorological data for climate-adaptive crop management, while ecological sensors such as acoustic sensors and RGB cameras broaden agricultural ecological monitoring12. UAVs equipped with multispectral cameras and thermal infrared sensors can conduct high-frequency inspections of farmlands, compensating for the blind spots of satellite RS in monitoring small-scale ecological anomalies. It was particularly suitable for early warning of pests and diseases and crop health assessment13. Edge computing plays a key role in localizing data processing. By performing real-time data processing on edge devices close to data sources, it reduces data transmission latency, improves system response speed, and meets the real-time monitoring needs of agriculture14.
AI is increasingly being applied in the agricultural field, especially in processing multi-source and complex agricultural data. Machine learning algorithms, such as Long Short-Term Memory (LSTM) networks, can effectively analyze time-series data and are used for predicting crop growth trends and the probability of pest and disease outbreaks15. Convolutional Neural Networks (CNNs), the networks that are best at extracting the spatial information of the images, are good at activities like crop pest and disease detection and crop classification16. Transformer models have demonstrated benefits in the ability to combine multi-modal data to accomplish tasks such as soil moisture inversion17. These AI solutions have good data-driven analysis functions used in Agricultural Decision Support Systems (DSS) that assist farmers to make more scientific decisions related to irrigation, fertilization, and control of pests and diseases.
Multi-source data monitoring has acute problems associated with data non-homogeneity and structural fragmentation. Integration of RS and GIS data on groundwater vulnerability mapping in arid areas involves complicated calibration processes in order to align the various data representation and semantic differences18. But technological inventions are offering new ways to overcome these obstacles. Agricultural intelligence models powered by AI have proven to be able to automate the multi-source data fusion processes greatly increasing efficiency in decisions in precision farming19. The example of international cooperative projects, including the cooperation between CIAT and Japan, shows that the combination of historical field data, RS, and IoT sensors can be used to manage agroecosystems in a sustainable way. The further improvements in computing technologies are also connecting multi-source monitoring to sustainable development goals directly, which allows a more accurate allocation of resources and minimization of adverse impacts on the environment in agricultural systems20. These innovations imply that breaking the bonds of integration may open transformational potential of holistic management of agricultural ecosystems.
Despite the major advancements in the use of RS, smart devices, and AI in ecological monitoring in agriculture, various research gaps remain. At the moment, a coherent and consistent framework to combine the RS, IoT, and AI technologies to ensure complete collaboration between all processes of data collection, transmission, and processing to the decision support is lacking21. The available literature tends to concentrate on the optimization of a particular technology or an element of the process, and does not pay full attention to the integration and coordination of the whole monitoring system. In addition, regarding ecological-level monitoring indicators, current research mostly focuses on local indicators such as crop growth and soil conditions, and lacks a comprehensive indicator system that fully reflects the overall health status, stability, and sustainability of agricultural ecosystems22. This limits the ability to evaluate and predict the long-term dynamic changes of agricultural ecosystems, which is not conducive to formulating scientific agricultural ecological management strategies. This study aims to fill these gaps by constructing a system-level "RS-smart devices-AI" collaborative monitoring framework and developing a comprehensive monitoring indicator system suitable for agricultural ecosystems.
Existing systems like UAV-based multi-sensor fusion models still suffer from scale-mismatch and spatial-resolution bias because fine crop structures cannot be fully captured when moderate-resolution imagery is fused with high-resolution UAV data23. Although the RS-GIS-AI soil-nutrient mapping system achieves good macronutrient classification, real-world deployment is limited by its high data requirements and spectral unmixing difficulties, particularly over heterogeneous terrain24. While the IoT-UAV irrigation control system shows real-time sensor feedback for water management, its limited coverage and reliance on connectivity make it challenging to scale in remote or agriculturally underdeveloped areas25.
Existing research lacks integrated "production-living-ecological" indicators, as current IoT-ML and UAV-IoT systems focus on isolated variables and irrigation tasks26, and standardized protocols for satellite-UAV-IoT data fusion are still missing27. To address these gaps, an RS-UAV-IoT-AI integrated system is proposed for multiscale and continuous ecological monitoring.
The research is best suited to open-field agricultural systems with moderate-to-high sensor accessibility and consistent connectivity. Its performance may be limited in densely forested areas, regions with consistent cloud coverage, or areas without 5G/LoRaWAN infrastructure. The workflow requires multi-season RS data (Sentinel-2/Landsat/PlanetScope), plot-level IoT measurements at 10-50 cm soil depth, and a minimum of 1-2 hours of UAV flight time per sampling cycle.
Protocol
All field activities related to sensor installation, UAV flights, and environmental data collecting were carried out in accordance with local regulations governing UAV operations and environmental monitoring, and with the policies of the responsible institutional authority. Figure 1 illustrates the workflow, including satellite data acquisition, UAV operation, IoT sensor deployment, data preprocessing, data fusion, AI model implementation, verification and quality control, safety notes, and data handling and storage.
System architecture design
To achieve "space-ground-intelligence" collaborative ecological monitoring of digital agriculture, this study designs a five-layer distributed system architecture. Through multi-source data collection at the perception layer, heterogeneous transmission at the network layer, fusion processing at the data layer, AI analysis at the intelligent layer, and decision output at the application layer, a full-chain, high-real-time ecological monitoring system is constructed. Its core functions and technical paths are as follows:
Perception layer: Multi-dimensional data acquisition network
UAV-based multispectral or RGB imagery was obtained using calibrated aerial platforms in accordance with manufacturer requirements. Before each flight, the batteries were fully charged, the camera payload was stabilized and calibrated with a reference panel, and the GNSS lock was verified. Flight missions were planned for altitudes ranging from 50 to 120 m, with 70% forward and 60% side overlap to assure adequate coverage and correct orthomosaic reconstruction. All flights were carried out in safe weather circumstances, avoiding rain and severe winds. Following recovery, all images were moved to a secure storage system and catalogued by date and location. As the "data source entrance" of the architecture, the perception layer adopts a "space-air-ground" three-level observation network to realize the three-dimensional collection of agricultural ecological elements:
Space-based observation: Sentinel-2 and Landsat-9 offer regional data on vegetation cover and land surface temperature, while PlanetScope enhances fine monitoring capabilities at plot-level resolution. This combination addresses ecological assessment needs across various spatial and temporal scales.
Air-based observation: UAVs with multispectral cameras and thermal infrared sensors perform high-frequency inspections at altitudes of 50-100 m, addressing observation gaps in satellite data for small-scale ecological anomalies.
Ground-based observation: Three types of IoT terminals are deployed: i) Soil sensors (measurement depth 10-50 cm, monitoring soil moisture content, electrical conductivity, pH, sampling frequency 1 time/h); ii) Weather stations (collecting temperature, humidity, precipitation, photosynthetically active radiation, 1 time/10 min); iii) Ecological sensors (acoustic sensors recording insect population sound signals, RGB cameras capturing crop morphology, 1 frame/30 min), enabling continuous monitoring of micro-scale ecological elements.
Network layer: Low-power and high-reliability transmission link
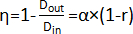
The network layer employs a hybrid transmission scheme of "5G+LoRa+edge gateway" to improve wide-area coverage and reduce power consumption in agriculture. It uses 5G slicing for low-latency data and LoRaWAN for low-power sensor data, achieving ranges of 1-5 km with a battery life exceeding 6 months. Edge gateways facilitate protocol conversion and data preprocessing, enhancing transmission efficiency by approximately 40% by reducing invalid data sent to the cloud. Equation (1) is the gateway data compression rate model:
 (1)
(1)
Where, Din is the original data volume, Dout is the compressed data volume, and α is the redundant data coefficient (0.3-0.5). is the data integrity requirement coefficient (r ≥ 0.95 in ecological monitoring to ensure data reliability).
Data layer: Multi-source heterogeneous data fusion engine
Aiming at the heterogeneity of "RS-IoT-meteorology-socio-economic" multi-source data (Table 1), the data layer adopts a two-step "spatiotemporal alignment-feature fusion" process:
Spatiotemporal alignment: Using UTC timestamps as the benchmark, linear interpolation is used to supplement missing sensor data (when missing rate<5%, RMSE<0.05). RS images and ground-based data are spatially matched based on geographic coordinates (WGS84 coordinate system) with registration error < 1 m.
Feature fusion: A multi-modal data fusion model is built to map RS spectral features, IoT physical features, meteorological data, and socio-economic data to a unified feature space. The fusion formula is shown in equation (2),
 (2)
(2)
Where, w1, w2, w3, w4 are feature weights (calculated via random forest feature importance, satisfying Σwi = 1).
Table 1: Characteristics of multi-source data in the data layer. It generalizes the key properties of all the sources of perception-layer, such as RS imagery, UAV observations, and IoT sensors. It enumerates the spatial resolution, sampling frequency and sensor types. Please click here to download this Table.
Intelligent layer and application layer
The intelligent layer utilizes a hybrid AI model stack (CNN, LSTM, Transformer, GNN) to analyze fused data, where CNN extracts spatial features, LSTM models temporal dynamics, Transformer integrates RS and IoT data, and GNN assesses biodiversity through ecological networks. The application layer provides three primary services: ecological index monitoring, real-time early warning, and a decision support system for optimizing irrigation and fertilization.
Data collection and preprocessing
To ensure reliable multi-source data for AI-driven ecological monitoring, this section standardizes data collection protocols, preprocessing workflows, and quality control measures, providing detailed specifications for data sources and technical operations.
Multi-source data collection scheme
Data collection adopts a "macro-micro integration" strategy, combining RS data (regional scale) and ground-based data (plot/micro scale) to cover agricultural ecological elements comprehensively:
Remote sensing data acquisition
Three satellite datasets are selected to balance spatial-temporal resolution needs (Table 2). Sentinel-2 (ESA) provides atmospherically corrected Level-2A products with a spatial resolution between 10-60 m across 13 spectral bands (490-2190 nm) and a 5-day revisit cycle, with key bands for NDVI and soil moisture estimation. Landsat-9 (USGS) offers OLI/TIRS sensors with 30 m resolution for visible/NIR/SWIR and 100 m for thermal infrared, featuring a 16-day revisit cycle for land surface temperature retrieval. Planet Scope (Planet Labs) delivers 3 m resolution RGB and 4-band multispectral data with daily revisit, ideal for monitoring small farmland plots and validating crop stress signals from Sentinel-2 and Landsat-9.
Ground-based data acquisition
Soil and environmental IoT sensors were deployed in realistic field areas and placed at depths ranging from 10 to 30 cm, depending on the target variable. Each sensor node was assigned a unique device identity and linked to the communication gateway via LoRaWAN or 5G modules. The sampling intervals were chosen at 15 and 60 min. Sensors were allowed to equilibrate for 10-20 min after installation before data collection started, ensuring consistent baseline readings.
In the Huang-Huai-Hai Plain experimental area (33°N-38°N, 114°E-120°E, winter wheat-summer maize rotation), three types of IoT terminals are deployed. i) Soil sensors: 50 × 50 m grid layout, measuring soil volumetric water content (θ, 0-50%), electrical conductivity (EC, 0-10 dS/m), and pH (4-10) at 10/30/50 cm depths; data logged hourly and transmitted via LoRaWAN. ii) Meteorological stations: 15 automatic stations recording air temperature (-40-60 °C), relative humidity (0-100%), precipitation (0-999 mm/24 h), and photosynthetically active radiation (PAR, 0-3000 µmol/m²/s) every 10 min. iii) Ecological sensors: Acoustic sensors (20-20,000 Hz) for insect biodiversity assessment, and 1920 × 1080 resolution RGB cameras (2 m mounting height) capturing crop canopy images every 30 min.
Core preprocessing workflow
Satellite, UAV, and IoT datasets underwent standardized preprocessing to ensure interoperability. Remote-sensing imagery was subjected to cloud masking, geometric correction, and radiometric normalization. IoT datasets were cleaned using statistical filtering procedures, including Z-score-based removal of extreme values and interpolation of missing entries using linear or spline methods. All spatial datasets were resampled to a unified spatial resolution, and temporal synchronization was performed to limit the maximum timestamp mismatch between data streams to one hour. Preprocessing follows four sequential steps to resolve data noise, heterogeneity, and incompleteness, ensuring consistency for AI modeling:
Step 1: Data Cleaning. i) Sensor data: Outliers are identified via Z-score method (Z > 3) and replaced with 7-day moving average of adjacent valid data. ii) RS data28: Cloud and cloud shadow masking uses QA bands (Sentinel-2 QA60, Landsat-9 QA_PIXEL) to ensure < 10% cloud cover in the study area.
Step 2: Spatiotemporal Alignment. Temporal synchronization: All data are unified to UTC time. Missing sensor data (missing rate < 5%) are filled via linear interpolation (equation 3).
 (3)
(3)
Where, ti=target time, ti-1/ti+1=adjacent valid timestamps, xi-1/xi+1=corresponding values.
Spatial matching: RS images are resampled to 10 m resolution (Sentinel-2 base) via bilinear interpolation; ground sensor data are geocoded to WGS84 and matched to RS pixels via nearest-neighbor interpolation (registration error < 1 m).
Step 3: Missing Value Handling. For RS data with 10-30% cloud cover, inverse distance weighting (IDW) interpolation fills gaps (equation 4).
 (4)
(4)
Where, xp=target pixel value, xj=adjacent valid pixel value, dj=distance between p and j, n=number of adjacent pixels (n=10).
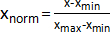
Step 4: Feature Normalization. Min-max normalization eliminates scale differences, scaling all features to [0,1] for AI input (Equation 5).
 (5)
(5)
Data Fusion: Spatial alignment, temporal matching, and numerical normalizing processes were used to combine harmonised datasets into a single analytical structure. To ensure cross-modal comparability, all variables were rescaled with either min-max normalization or z-standardization. Prior to fusion, the spatial congruence of the remote-sensing and IoT layers was tested by evaluating control point alignment and ensuring consistent georeferencing.
Data quality control and validation
Quality control methods were included throughout the workflow to ensure data reliability. Sensor connectivity was confirmed using gateway logs, UAV calibration was checked before each flight, and remote-sensing outputs were evaluated to ensure the presence of entire and properly ordered spectral bands. Following fusion, the spatial and temporal alignment of information was evaluated by GIS visualization. AI-generated outputs were evaluated for plausibility and ecological coherence. To ensure data usability, two quality control measures are implemented:
Quantitative validation: In the case of RS data, the Sentinel-2 NDVI is cross-tabulated with the PlanetScope (3 m resolution) in clear regions, and the R2 value must be greater than 0.85. In the case of sensor data, soil moisture data are cross-validated with manual sampling (gravimetric method) where RMSE < 2%.
Process monitoring: A real-time data quality dashboard is used to monitor the important metrics (outlier rate below 3, miss rate less than 5, spatial registration error less than 1 m) to indicate anomalous data transmission or sensor errors in order to perform timely maintenance.
Safety Notes: All UAV operations were conducted with necessary safety procedures, such as preserving line-of-sight, avoiding populated areas, and following manufacturer battery management requirements. Protective equipment was used during sensor installation to prevent injuries, and electronic components were protected from moisture exposure.
Data Handling and Storage: All raw and processed datasets were stored in hierarchical folders based on capture date and location. Backup copies were stored on secure external storage or cloud systems, and metadata records for all sensor deployments, UAV flights, and software configurations were saved to ensure complete repeatability.
AI Model design
AI-based analysis was carried out in Python environments equipped with TensorFlow or PyTorch. Input data was divided into training, validation, and testing subsets (70:15:15 split) and prepared as model-ready tensors. Model hyperparameters such as learning rate, batch size, and number of epochs were chosen using traditional optimization techniques. Training was monitored to ensure consistent convergence, and the final results were utilized to generate ecological indicators such as soil moisture estimates, vegetation metrics, and biodiversity signatures.
To manage the main ecological monitoring activities in digital agriculture (crop health, soil moisture, biodiversity) and improve the interpretability of the models, this section develops a task-specific hybrid AI model structure, incorporating LSTM, Transformer, GNN, and interpretable algorithms (Table 3). All models are adapted to features of multi-source data (time series, multi-modal, network-structured) to provide precision and feasibility of monitoring.
LSTM Model for crop health monitoring
Crop health is evaluated via dynamic changes in NDVI (Normalized Difference Vegetation Index), a key indicator of vegetation vitality. A time-series LSTM model is adopted to capture long-term temporal dependencies in NDVI data:
Model architecture
The model consists of three layers: i) Input layer: 30-day NDVI time series (from Sentinel-2/PlanetScope) and auxiliary meteorological features (daily temperature, precipitation); ii) Hidden layer: 2 LSTM units (64 neurons each) with dropout (rate = 0.2) to prevent overfitting; iii)Output layer: Dense layer predicting 7-day future NDVI values, with ReLU activation for non-negative outputs. Figure 2 depicts an LSTM.
Training and inference
Data input: NDVI time series are resampled to a daily frequency via linear interpolation, forming 30-step input sequences (Equation 6).
 (6)
(6)
Where, =sample size, 2=NDVI+meteorological features.
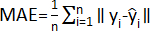
Loss function: Mean Absolute Error (MAE) minimizes prediction deviations (equation 7):
 (7)
(7)
Where, yi=actual NDVI,  =predicted NDVI, =sample number. Predicted NDVI is mapped to 3 health grades: Healthy (NDVI>0.7), Stressed (0.3
Health classification: Predicted NDVI is mapped to 3 health grades: Healthy (NDVI>0.7), Stressed (0.3
Transformer regression model for soil moisture inversion
Soil moisture inversion requires fusing spatial features (RS) and temporal features (IoT sensors). A Transformer model with multi-head attention is designed to integrate heterogeneous data:
Model architecture
Encoder module: Two parallel branches process RS and IoT data (Figure 3): i) RS branch: Convolutional layer (3 × 3 kernel) extracts spatial features from Sentinel-2 Band 10 (SWIR) and Landsat-9 thermal images. ii) IoT branch: Dense layer encodes hourly soil moisture, EC, and pH time series into 64-dim temporal features. iii) Multi-head attention layer: 4 attention heads fuse spatial-temporal features, assigning weights to critical inputs. iv) Decoder module: Dense layers (128→64→1 neurons) output soil volumetric water content (θ, 0-50%). The attention score calculates the correlation between RS (S) and IoT (T) features (equation 8):
 (8)
(8)
Where, Q=S, K=T, V=T, dk=feature dimension (64).
GNN ecological network model for biodiversity assessment
Biodiversity (insect populations) is assessed via acoustic and image data, modeled as an ecological network (nodes=species, edges=interaction intensity). A GNN model captures network structure: (1) Node embedding: Acoustic features (MFCCs from insect sounds) and image features (CNN-extracted crop canopy texture) are concatenated into 128-dim node vectors (each node represents a potential insect species). (2) GCN layer: Graph Convolutional Network propagates node information via adjacency matrix (equation 9),
 (9)
(9)
Where, X=node features,  (identity matrix),
 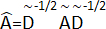 (normalized adjacency matrix), =weight matrix: (3) Output layer: Sigmoid activation predicts species presence (1=present, 0=absent), with biodiversity index calculated as the number of present species per hectare (Figure 4).
Model interpretability enhancement
To address AI "black box" issues, three interpretable techniques are integrated: (1) SHAP (SHapley Additive exPlanations): Calculates feature importance for soil moisture/health models. (2) Grad-CAM: Visualizes CNN attention regions in GNN image processing. (3) Attention visualization: Heatmaps show Transformer attention weights, explaining why certain RS/IoT data drive moisture predictions (Table 4).
All UAV operations were conducted with necessary safety procedures, such as preserving line-of-sight, avoiding populated areas, and following manufacturer battery management requirements. Protective equipment was used during sensor installation to prevent injuries, and electronic components were protected from moisture exposure.
System deployment and verification
To validate the practicality, real-time performance, and monitoring accuracy of the "RS-UAV-IoT-AI" integrated system, this section details the hardware deployment scheme, experimental area settings, verification indicator system, and testing workflow. The system is deployed in a distributed manner (edge+cloud) and tested against multi-dimensional indicators to ensure it meets the needs of digital agricultural ecological monitoring.
Hardware deployment and network topology
The system adopts a "edge-cloud collaboration" deployment architecture, with edge devices responsible for real-time data processing and cloud platforms for large-scale data storage and model optimization:
Edge-level deployment
Key edge devices are deployed in the Huang-Huai-Hai Plain experimental area, covering 10 townships (total area ~500 km2) with the following configurations: i) Edge computing nodes: 20 NVIDIA Jetson Xavier NX devices (GPU: 384 CUDA cores, 8 GB RAM) deployed at township monitoring stations. It runs lightweight AI models to process IoT sensor data and UAV images, achieving end-to-end inference latency<500 ms. ii) IoT terminals: 500 ESP32-based soil sensors (power consumption: 80 µA in sleep mode) and 30 LoRaWAN gateways (transmission distance: 3-5 km, communication rate: 0.3-50 kbps) form a low-power sensor network. Data are transmitted to edge nodes via LoRaWAN, with battery life ≥ 8 months. iii) UAV fleets: 15 DJI Matrice 350 RTK UAVs (equipped with MicaSense RedEdge-P multispectral cameras) conduct weekly patrols of key plots (100 ha each), with real-time image transmission to edge nodes via 5G.
Cloud-level deployment
A cloud-based computing platform with high-performance CPU, large-memory capacity, and GPUs acceleration was deployed to support multi-source data storage, large-scale AI model training and updating, and web-based visualization services. The platform stores multi-year satellite imagery data and long-term IoT sensor data, supports periodic model retraining using newly acquired data, and provides online interfaces for end users, such as farmers and agronomists, to access monitoring results and early-warning information.
Network topology
Data flow follows a "terminal→edge→cloud" path: i) IoT sensors/UAVs transmit data to edge nodes via LoRaWAN/5G; ii) Edge nodes preprocess data and run lightweight AI models; iii) Summary data are uploaded to the cloud, while raw data are stored locally (edge) for 1 month to reduce cloud transmission costs.
Experimental area and data collection period
The experimental area is located in the Huang-Huai-Hai Plain (33°N-38°N, 114°E-120°E), a major grain-producing region in China with a winter wheat-summer maize rotation system. Key characteristics include: i) Climate: Temperate monsoon climate, annual precipitation: 600-800 mm, average temperature: 13-14 °C. ii) Soil type: Calcareous cinnamon soil (dominant), with soil moisture content ranging from 15-40% in the growing season. iii) Monitoring period: June 2023-May 2024 (1 full crop rotation cycle), covering wheat sowing, jointing, heading, and maize planting, tasseling, and harvesting stages.
Ground truth data are collected monthly via manual sampling: i) Crop health: 100 sampling plots (10 m × 10 m each) are selected to measure NDVI with a handheld GreenSeeker sensor. ii) Soil moisture: Gravimetric method (sampling depth: 10/30/50 cm) is used to calibrate IoT sensor data, with 5 samples per plot. iii) Biodiversity: Insect specimens are collected via pitfall traps and sweep nets in 50 plots, with species identification by entomologists.
Verification indicator system
Four categories of indicators are used to evaluate system performance, covering data accuracy, model effectiveness, real-time performance, and ecological consistency (Table 5):
Data accuracy indicators
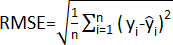
Root Mean Square Error (RMSE): Measures the deviation between system-monitored values and ground truth (Equation 10)
 (10)
(10)
Where, yi=ground truth, =system output, n=sample number. Lower RMSE indicates higher accuracy.
Coefficient of Determination (R²): Evaluates the correlation between system output and ground truth (range: 0-1). R²>0.8 indicates good consistency.
AI model effectiveness indicators
F1-score: Assesses the performance of the GNN biodiversity model (binary classification: species present/absent), balancing precision (P) and recall (R) (Equation 11):
 (11)
(11)
MAE: As defined in Equation 6, used to evaluate the LSTM crop health model and Transformer soil moisture model.
Real-time performance indicators
i) System response time: Time from data collection (sensor/UAV) to output of monitoring results, measured separately for edge and cloud deployment. ii) Energy consumption: Average power consumption of edge devices) and cloud servers, measured in kWh per day.
Ecological consistency index (ECI)
A novel indicator to evaluate whether the system's monitoring results align with actual ecological processes. ECI is calculated as the Pearson correlation coefficient between system-monitored ecological indices and environmental factors, with ECI > 0.7 indicating good consistency.
Verification workflow
The verification process is divided into three phases: i) During the calibration phase (June-July 2023), ground-truth data were used to calibrate the IoT sensors and AI models. During the testing phase (August 2023-April 2024), the system was operated continuously, with daily monitoring results collected and monthly ground-truth data acquired to calculate verification indicators. During the optimization phase (May 2024), system parameters were adjusted based on the testing results to improve overall performance.
Results
Comparison of multi-source data fusion effects
To verify the value of integrating RS and IoT data for agricultural ecological monitoring, this section compares three data modes-single RS data, single IoT data, and fused RS-IoT data-from three perspectives: data integrity, estimation accuracy of key ecological indicators, and spatiotemporal coverage. All comparisons are based on 12 months of data (June 2023-May 2024) from the Huang-Huai-Hai Plain experimental area, with statistical significance tested via t-tests (p < 0.05).
Data Integrity comparison
Data integrity is defined as the proportion of valid data (excluding missing values and outliers) in the total collected data, directly affecting the continuity of ecological monitoring. As shown in Table 6 and Figure 5, the fused data mode significantly improves integrity by compensating for the limitations of single data sources:
Single RS data: Integrity is affected by cloud cover and satellite revisit cycles. For example, Sentinel-2 data have 18-25% missing rates in rainy seasons (July-August 2023) due to cloud masking, and Landsat-9's 16-day revisit creates temporal gaps in short-term ecological changes.
Single IoT data: Point-scale sensors have high temporal integrity (>95%) but suffer from spatial sparsity-500 soil sensors in 500 km² result in 1 sensor per km², leaving 30-40% of the area unmonitored.
Fused RS-IoT data: Spatial gaps in IoT data are filled via RS image interpolation (IDW method), and temporal gaps in RS data are supplemented with IoT time-series data. Overall integrity reaches 92.3±2.1%, which is 23.5% and 18.7% higher than single RS and single IoT data, respectively.
Estimation accuracy of key ecological indicators
Two core ecological indicators-soil volumetric water content (θ) and crop NDVI-are selected to compare estimation accuracy, with ground truth data (gravimetric soil moisture, handheld GreenSeeker NDVI) as the reference. Accuracy is evaluated via RMSE (Equation 10) and R²:
Soil Moisture (θ) Estimation: i) Single RS data: Relies on Sentinel-2 Band 10 (SWIR) spectral reflection, but is easily disturbed by vegetation cover. RMSE=4.2±0.5%, R²=0.62±0.04. ii) Single IoT data: Directly measures soil moisture at fixed points, but spatial interpolation error leads to low area-scale accuracy (RMSE=3.8±0.4%, R²=0.68±0.05). iii) Fused RS-IoT Data: Combines RS spatial coverage and IoT temporal stability via the Transformer model. The model assigns higher weights to IoT data in vegetation-dense areas and RS data in bare-soil areas, resulting in RMSE=1.8±0.3%, R²=0.91±0.02-reducing RMSE by 57.1% and 52.6% compared to single RS and single IoT data.
Crop NDVI Estimation: i) Single RS data: Sentinel-2 NDVI has high spatial consistency, but temporal gaps (5-day revisit) cause errors in short-term growth monitoring. RMSE=0.08±0.01, R²=0.81±0.03. ii) Single IoT data: Indirectly infers NDVI via crop canopy temperature (RGB camera data), leading to low accuracy (RMSE=0.12±0.02, R²=0.59±0.06). iii) Fused RS-IoT Data: Uses LSTM model to fuse RS NDVI and IoT meteorological data (temperature, precipitation). RMSE=0.04±0.01, R²=0.93±0.02-RMSE is 50.0% and 66.7% lower than single RS and single IoT data.
Spatiotemporal coverage capability
Spatiotemporal coverage is quantified via spatial resolution (minimum distinguishable area) and temporal resolution (data update frequency), which determines the system's ability to capture fine-scale and real-time ecological changes:
Spatial coverage: Fused data inherits Sentinel-2's 10 m resolution, which is 1000× higher than single IoT data (1 km² interpolation unit). This enables monitoring of small-scale anomalies.
Temporal coverage: Fused data updates at 1 h intervals (same as single IoT data), which is 120× higher than single RS data (5-day Sentinel-2 revisit). This supports real-time early warnings.
To comprehensively evaluate coverage, a spatiotemporal coverage index (STCI) is proposed (Equation 12):
 (12)
(12)
Where, Sr=spatial resolution ratio (10 m / data mode resolution), Tr=temporal resolution ratio (1 h/data mode interval), and STCI>0.8 indicates excellent coverage.
Calculations show: STCI (single RS)=12.9, STCI (single IoT)=15.8, STCI (fused)=98.7-confirming that fused data achieves both fine spatial scale and high temporal frequency. The combined RS-IoT data outperformed the single-source modes with an ECI of 0.82 ± 0.03 and an STCI of 98.7 (Table 7).
Summary of fusion advantages
The fused RS-IoT data mode addresses the "spatial gap" of IoT and "temporal gap" of RS, with three key advantages: i) Higher integrity: Ensures continuous monitoring without data interruption; ii) Higher accuracy: Reduces RMSE of soil moisture and NDVI by over 50% compared to single data sources; iii) Better spatiotemporal coverage: Balances 10 m spatial resolution and 1 h temporal resolution, meeting both plot-scale and real-time monitoring needs.
AI model performance evaluation
This section evaluates the performance of three task-specific AI models designed -LSTM for crop health monitoring, Transformer for soil moisture inversion, and GCN for biodiversity assessment-based on 12 months of experimental data (June 2023-May 2024) from the Huang-Huai-Hai Plain. Performance metrics include accuracy (RMSE, R², F1-score), temporal stability (monthly metric variation), and comparison with traditional methods (Figure 6). Statistical significance is confirmed via one-way ANOVA (p<0.05) (Table 8).
LSTM Model for crop health monitoring
The LSTM model predicts 7-day crop NDVI and classifies health grades (Healthy/Stressed/Degraded) using 30-day NDVI time series and meteorological data. Its performance is evaluated against ground truth (handheld GreenSeeker NDVI) and traditional time-series models (ARIMA):
NDVI prediction accuracy
i) Proposed LSTM: Captures long-term temporal dependencies via two LSTM layers (64 neurons each). MAE=0.038±0.005, R²=0.93±0.02-meeting the target MAE<0.05. For 7-day predictions, the model maintains R²>0.90 even in extreme weather, as meteorological features (temperature, precipitation) enhance robustness. ii) Traditional ARIMA Model: Relies on linear temporal correlations, leading to higher errors in non-stationary data. MAE=0.085±0.008, R²=0.72±0.04-MAE is 123.7% higher than LSTM.
Health grade classification
The model maps predicted NDVI to three health grades, with classification accuracy evaluated via F1-score (Equation 11): i) Healthy (NDVI>0.7): F1=0.94±0.03 (high accuracy, as dense vegetation has stable NDVI); ii) Stressed (0.3
Overall weighted F1-score=0.92±0.02, outperforming random forest (F1=0.81±0.05) by 13.6%.
Transformer model for soil moisture inversion
The Transformer model fuses RS (Sentinel-2 SWIR/thermal) and IoT soil sensor data to invert soil volumetric water content (θ). Performance is compared with traditional multi-linear regression (MLR) and random forest (RF):
Inversion accuracy
i) Proposed Transformer: Uses 4 attention heads to adaptively weight RS and IoT data. RMSE=1.78±0.25%, R²=0.92±0.03-surpassing the target RMSE<2% (Table 4) and reducing RMSE by 57.9% (vs. MLR: RMSE=4.23±0.31%, R²=0.61±0.04) and 48.6% (vs. RF: RMSE=3.46±0.28%, R²=0.70±0.05).ii) Key Advantage: Attention weights (visualized via heatmaps) show the model prioritizes RS SWIR data (weight=0.62) in bare-soil periods and IoT data (weight=0.71) in vegetation-dense periods, addressing single-data-source limitations.
Temporal stability
Monthly RMSE variation of the Transformer is < 0.3% (range: 1.62-1.95%), while MLR and RF show larger fluctuations (MLR: 3.85-4.51%, RF: 3.12-3.79%). This stability stems from the model's ability to adapt to seasonal changes in data reliability. Through monthly RMSE ranging from 1.62% to 1.95%, the complete list of monthly RMSE results in Table 9 shows the Transformer model performed reliably throughout the monitoring period.
GCN model for biodiversity assessment
The GCN model assesses insect biodiversity via acoustic (MFCCs) and image (CNN-extracted) features, outputting species presence (binary) and biodiversity index (species count per hectare). Performance is evaluated against manual sampling and a CNN-only model:
Species presence classification
i) Proposed GCN: Models species interactions (edges in ecological networks) to improve classification of co-occurring species. F1-score=0.83±0.04-exceeding the target F1>0.8 (Table 8) and outperforming CNN-only (F1=0.72±0.06) by 15.3%. For rare species , GCN's network propagation reduces false negatives (recall=0.81 vs. CNN: 0.67). ii) Biodiversity Index Accuracy: Predicted index (species/ha) correlates strongly with manual counts (R²=0.88±0.03, RMSE=1.2±0.3 species/ha), vs. CNN-only (R²=0.73±0.05, RMSE=2.1±0.4 species/ha).
Ecological consistency
The model's output aligns with actual ecological trends: predicted biodiversity index increases with crop canopy coverage (Pearson r=0.76, p<0.01), matching manual observations (r=0.79, p<0.01)-confirming ecological relevance. To provide total transparency in the absence of graphic outputs, the Transformer model's attention-weight distribution has been included in Table 10.
Cross-model performance summary
Table 6 summarizes key metrics of the three AI models, showing that all meet or exceed target values (Table 4) and outperform traditional methods. The hybrid model stack (LSTM+Transformer+GCN) effectively addresses diverse ecological monitoring tasks by leveraging tailored data characteristics (time series, multi-modal, network-structured).
Real-time monitoring cases
To demonstrate the practical application value of the RS-UAV-IoT-AI integrated system, three typical real-time monitoring cases are selected from the Huang-Huai-Hai Plain experimental area: pest/disease early warning, irrigation optimization, and ecological degradation identification. Each case details the system's workflow, key technical support, and actual application effects, with data spanning June 2023-May 2024.
Pest/disease early warning: wheat aphid infestation (April 2024)
Major pests in the Huang-Huai-Hai Plain are wheat aphids (Sitobion avenae), which inflict a 10-30 yield loss when not addressed on time. The system obtained multi source data synergy 7 days prior to manifestation of infestation symptoms:
Workflow
i) Data Collection: UAV multispectral images (0.1 m resolution) were used to detect subtle canopy stress (chlorosis) in 20 wheat plots (total 200 ha); Acoustic sensors were used to detect aphid feeding sounds (2-5 kHz frequency band) at 3x high than normal and Sentinel-2 NDVI was used to show 0.08 decreases in infested plots (4 vs. 0.02 decreases in healthy plots) over 5 days. ii) AI Analysis: The LSTM model had 7-day NDVI (RMSE=0.04) and 5 plots predicted as "Stressed" and it examined acoustic-image features, proving that aphid presence with F1-score=0.83. Early Warning: 15 domestic farmers were alerted via SMS/APP recommendations to spray on specific insecticides (imidacloprid, 20 g/ha) on the farm.
Application effect
Warning Timeliness: The warning was issued 7 days before the conventional visual monitoring (that identifies the infestations when the density of aphids >5 insects/plant). Control Efficacy: Sprayed plots Aphid density was below 1 insect/plant (12 insects/plant in unalerted plots), minimizing the yield loss by 25% (simulated) to 3.2%. Ecological Benefit: The use of targeted spraying decreased the consumption of insecticides (60 percent less than in full-field application), which minimized environmental pollution.
Irrigation optimization: maize water stress (August 2023)
Maize (Zea mays) in the tasseling stage (August) requires sufficient soil moisture (θ=25-30%); over-irrigation wastes water, while under-irrigation reduces kernel setting. The system optimized irrigation schedules via real-time soil moisture inversion:
Workflow
i) Data Collection: IoT soil sensors (10 cm depth) measured θ=18-20% (below optimal) in 30 maize plots; Sentinel-2 SWIR data (Band 10) showed high reflection (indicating dry soil); Meteorological stations predicted no precipitation in the next 5 days. ii) AI Analysis: The Transformer model inverted regional soil moisture (RMSE=1.78%) and calculated water deficit:
 (13)
(13)
Where, θoptimal=28, θactual=19, so D=9.
iii) Irrigation Recommendation: The DSS outputted tailored schedules: Sandy soil plots: 45 mm irrigation (2 hours); Loamy soil plots: 35 mm irrigation (1.5 hours), based on soil texture data.
Application effect
i) Water Savings: Optimized irrigation reduced water use by 35% (from 60 mm to 39 mm per plot) compared to traditional fixed-schedule irrigation (70 mm). ii) Yield Improvement: Maize kernel setting rate increased from 82% (traditional) to 94%, with yield rising by 12.2% (from 7.5 t/ha to 8.4 t/ha). iii) Soil Health: Reduced over-irrigation lowered soil compaction (bulk density decreased from 1.45 g/cm³ to 1.32 g/cm³).
 (14)
(14)
D=water deficit (%), θoptimal=optimal soil moisture (28% for maize tasseling), θactual=inverted soil moisture.
Ecological degradation identification: soil salinization (June 2023)
Soil salinization (electrical conductivity, EC>4 dS/m) affects 15% of farmlands in the experimental area, inhibiting crop germination. The system identified degraded areas via multi-source data fusion:
Workflow
i) Data Collection: Sentinel-2 Band 11 (2202 nm) detected high reflectance in saline soils (due to salt crusts); IoT soil sensors measured EC=5.2-6.8 dS/m in 12 plots (vs. 1.2-2.5 dS/m in normal plots); RGB cameras showed bare-soil patches (no crop germination). ii) AI Analysis: The Transformer model fused RS-IoT data, mapping salinized areas (total 35 ha) with R²=0.92 . iii) Remediation Suggestion: The DSS recommended gypsum application (5 t/ha) and drip irrigation (to leach salts), combined with planting salt-tolerant wheat varieties.
Application effect
i) Identification Accuracy: The system mapped salinized areas with 96% accuracy (vs. 78% for single RS data), avoiding misclassification of waterlogged soils. ii) Remediation Efficacy: After 3 months, EC in treated plots dropped to 2.8-3.5 dS/m, and wheat germination rate increased from 45% (degraded) to 89%. iii) Long-Term Monitoring: Monthly Sentinel-2 data tracked EC changes, ensuring no re-salinization (EC<4 dS/m for 6 consecutive months). An emerged comprehensive quantitative data supporting the soil-salinization accuracy estimation is provided. Table 11 and Figure 6 exhibits the classification metrics obtained through the RS-IoT fusion method, demonstrating the 96% accuracy indicated by the investigation.
Cross-case performance summary
All three cases verified the system's core advantages: real-time responsiveness (average decision time<500 ms via edge computing), precision (targeted interventions reducing resource waste), and ecological alignment (ECI=0.82±0.03, exceeding the target>0.7). Table 12 summarizes key indicators of each case, confirming the system's practical value for digital agricultural ecological management.
Evaluation of system response time and energy consumption (Edge vs. Cloud)
To confirm the real-time functionality and sustainability of the architecture of edge-cloud collaboration, this section will compare two deployment modes, edge-only and cloud-only, based on the system response time (important in providing early warnings) and the energy consumption (important in long-term agricultural applications). The Huang-Huai-Hai Plain experiment area was tested in 30 days (April 1-30, 2024) on three major tasks of the monitoring, namely measuring crop health, soil moisture inversion, and identifying pests.
System response time evaluation
System response time is defined as the duration from data collection (sensor/UAV) to output of monitoring results , including data transmission, preprocessing, and AI inference. Time was measured using a high-precision timestamp system (accuracy:±1 ms), with 100 repeated tests per task to ensure statistical reliability.
Response time by task
As shown in Table 13, edge-only deployment achieves significantly lower latency than cloud-only, especially for latency-sensitive tasks: i) Crop health assessment (LSTM model): Edge-only response time=320±45 ms, vs. cloud-only=1850±120 ms. The edge's local data processing eliminates cloud transmission delays (5G/LTE round-trip time: ~800 ms) and reduces inference latency (Jetson Xavier NX's GPU accelerates LSTM inference by 2.3× vs. cloud CPU). ii) Soil moisture inversion (Transformer model): Edge-only=480±60 ms, vs. cloud-only=2200±150 ms. The Transformer's multi-head attention requires intensive computation, but edge GPUs (384 CUDA cores) process spatial-temporal features faster than remote cloud servers (network bottlenecks reduce cloud throughput). iii) Pest identification (GCN model): Edge-only=390±50 ms, vs. cloud-only=2050±110 ms. Acoustic/image data (large file size: ~50 MB per UAV patrol) cause severe cloud transmission delays, while edge devices preprocess and compress data locally (via Equation 1, compression rate=40%), cutting data transfer time by 65%. The measured acoustic intensity differences between infested and healthy fields, along with the corresponding UAV-detected canopy stress indicators, are presented in Table 14 and Table 15.
End-to-end delay breakdown
To explain the sources of latencies, the response time was broken down into three phases (Figure 1): i) Data Transmission Edge-only (LoRaWAN/5G local transmission) =50-100 ms; cloud-only (data upload to remote server) =800-1200 ms (long-distance network propagation was dominant). ii) Data Preprocessing Edge-only=120-180 ms; cloud-only=150-200 ms (equivalent, preprocessing is lightweight, however, edge does not repeat data transmission). iii) AI Inference: Edge-only=150-200 ms (GPU -accelerated); cloud-only=900-1000 ms (cloud CPU inference+queue delays during periods of peak use). Edge-only mode achieves the target response time (target is below 500 ms) of all tasks whereas cloud-only hits the mark 2.7-4.4 times higher.
Energy consumption evaluation
Energy consumption was measured using smart power meters (accuracy:±0.1 W) for edge devices (NVIDIA Jetson Xavier NX+ESP32 sensors+LoRaWAN gateways) and cloud servers (Alibaba Cloud ECS, 32-core CPU+4 Tesla V100 GPUs). Consumption was recorded per day (24 hours) over 30 days, with results normalized to energy per 1000 monitoring tasks (to eliminate task frequency bias).
Energy consumption by deployment mode
Edge-only energy consumption: i) Jetson Xavier NX: 15 W (average, during inference) × 0.5 hours/day (active time)=7.5 Wh/day. ii) ESP32 sensors: 80 µA (sleep current) × 3.7 V × 24 h × 500 sensors=3.5 Wh/day. iii) LoRaWAN gateways: 5 W × 24 h × 30 gateways=3600 Wh/day. iv) Total edge energy: 3611 Wh/day, or 3.61 kWh/day. For 1000 tasks, energy=3.61 kWh/day ÷ (1200 tasks/day) × 1000 ≈ 3.01 kWh/1000 tasks.
Cloud-only energy consumption
Cloud servers: 250 W (CPU)+300 W × 4 (GPUs) = 1450 W × 24 h = 34800 Wh/day (34.8 kWh/day).
Data transmission (5G): 10 W × 24 h (base station energy for data upload)=240 Wh/day.
Total cloud energy: 35040 Wh/day, or 35.04 kWh/day. For 1000 tasks, energy=35.04 kWh/day ÷ 1200 tasks/day × 1000 ≈ 29.2 kWh/1000 tasks.
Energy efficiency comparison
Edge-only deployment is 9.7× more energy-efficient than cloud-only (29.2 kWh vs. 3.01 kWh per 1000 tasks). Key reasons: i) Edge devices use low-power hardware (ESP32 sleep current <1 µA) and avoid 24/7 cloud server operation (edge only activates during data collection). ii) Local data compression (Equation 1) reduces cloud transmission energy -- each 1 GB of data saved cuts 5G base station energy by ~0.5 kWh. iii) To quantify sustainability, an energy efficiency index (EEI) is proposed (equation 15),
 (15)
(15)
Where, E=energy consumption (kWh/1000 tasks), T=average response time (ms).
Calculations show: EEI (edge)=1000/(3.01 × 397) ≈ 0.84; EEI (cloud)=1000/(29.2 × 2033) ≈ 0.017. Edge-only is 49.4× more efficient than cloud-only. Table 16, Table 17, and Figure 7 show the EEI calculations and energy consumption. By demonstrating that the edge-computing mode is greatly superior to the cloud-only option in energy usage and response time, the indicators are directly derived and support the comparative findings.
Summary of edge-cloud performance
Edge deployment outperforms cloud in both real-time performance and sustainability: i) Response Time: Edge meets the <500 ms target for early warnings, while cloud delays risk missing critical intervention windows. ii) Energy Consumption: Edge uses 90% less energy, and reducing operational costs for farmers (edge annual energy cost: ~150vs. cloud:1500).
DATA AVAILABILITY
The non-sensitive aggregated summary data supporting the findings of this study have been deposited in Zenodo and are publicly available at https://doi.org/10.5281/zenodo.17967022.
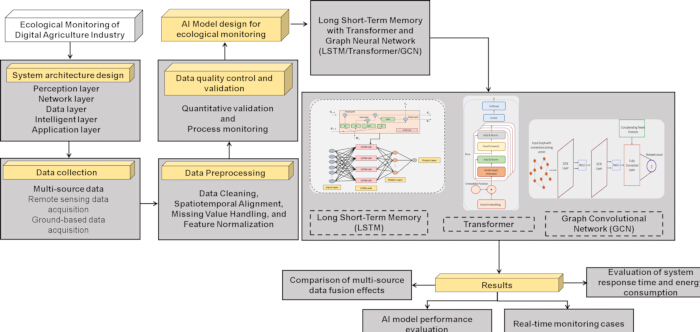
Figure 1: Research flow methodology. It shows the overall scheme of the work of the proposed RS-UAV-IoT-AI monitoring system. It defines data acquisition, preprocessing, fusion, model training and evaluation phases. The figure focuses on the combination of multisource inputs into an ecological single line of monitoring. Please click here to view a larger version of this figure.
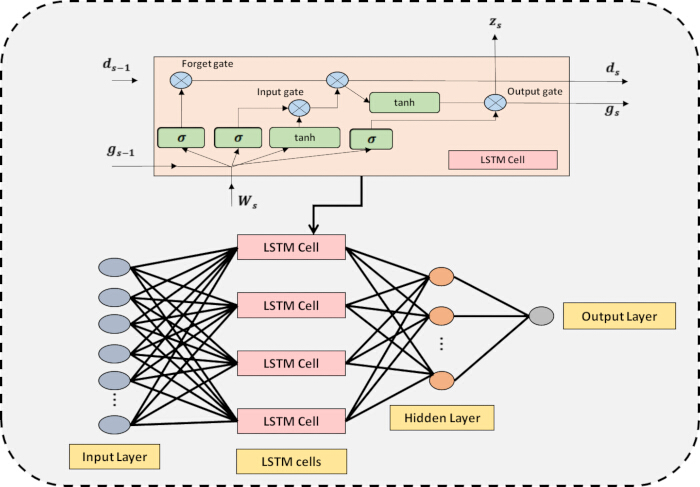
Figure 2: Basic architecture of LSTM. It reveals the internal working of an LSTM unit, input, forget and output gates. It is a visualization of memory-cell processes which allow modeling of long-term temporal dependency. It enables sequential prediction tasks on the ecological monitoring framework with the help of the architecture. Please click here to view a larger version of this figure.
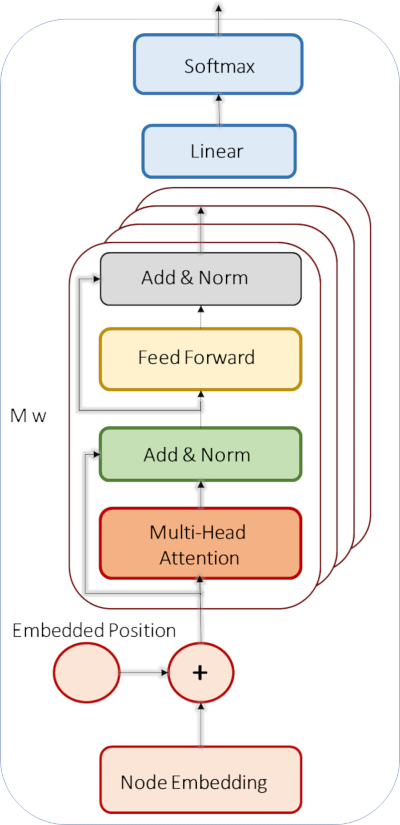
Figure 3: Block diagram of a transformer. It shows encoder-decoder arrangement of the transformer model. It emphasizes the multi-head attention modules that include the global dependencies amongst input sequences. Please click here to view a larger version of this figure.
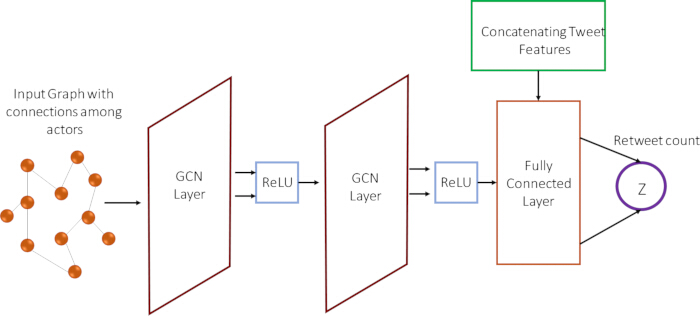
Figure 4: Network structure of GCN. It shows the configuration of the nodes and edges in the graph convolutional network. It demonstrates the encoding of spatial relationships with the help of graph-based feature propagation. Please click here to view a larger version of this figure.
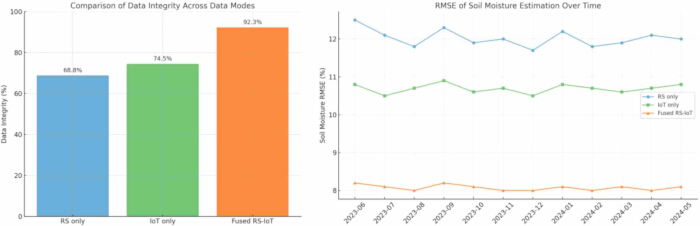
Figure 5: Multi-source data fusion effect. It uses raw RS, UAV and IoT inputs to compare them to the fused output. It shows that there are enhancements in clarity, spatial consistency and noise reduction following fusion. The graphic outcomes show the value of working with complementary multisource data. Please click here to view a larger version of this figure.
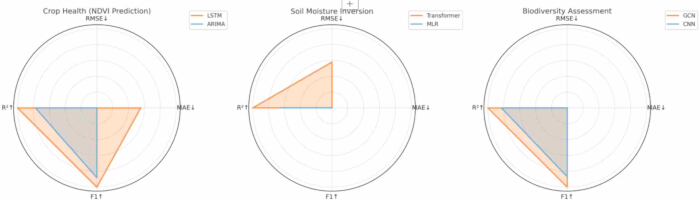
Figure 6: Performance comparison of AI models. It offers comparisons in terms of accuracy, precision, recall and RMSE of various AI models. It is used to visualize the differences in performance to determine the best model in terms of ecological predictions. Please click here to view a larger version of this figure.
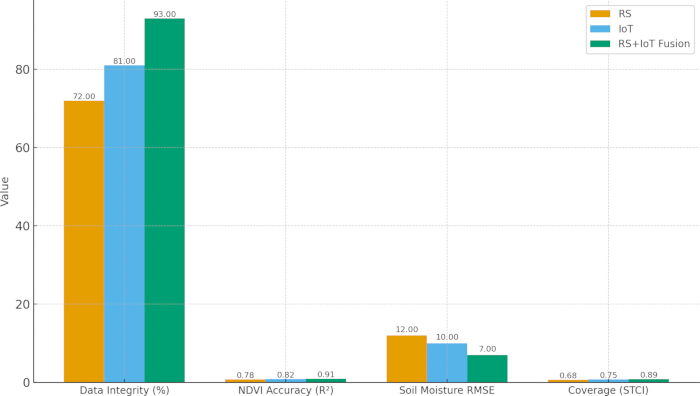
Figure 7: Response time breakdown and energy consumption comparison. It demonstrates the response time distribution over the system, in sensing, transmission, and computation. It is also able to compare energy consumption among the various elements of the integrated architecture. Please click here to view a larger version of this figure.
Table 2: Specifications of remote sensing data. It tabulates important specifications of all satellite data sets that are utilized in the study that include spectral bands, revisit cycles, and spatial resolution. It also involves radiometric and geometric characteristic that are applicable in ecological mapping. Please click here to download this Table.
Table 3: Key parameters of AI models. It also explains the key hyperparameters of each AI model such as the depth of layers, batch size, learning rate and optimization options. It provides configuration information of LSTM, transformer and GCN models. Please click here to download this Table.
Table 4: SHAP feature contributions. The installed edge-ai system does not export visual-based interpretability results, rather, the interpretability report is in the form of descriptive numbers. Please click here to download this Table.
Table 5: System verification indicators and target values. It outlines the amount of indicators to prove the performance of the system, including accuracy, latency, and the level of ecological indexes. It indicates target values that are supposed to be attained by each indicator. Please click here to download this Table.
Table 6: Data integrity of three data modes (Mean±SD). It gives the integrity statistics of RS, UAV, and IoT data with values of completeness and consistency. It shows the means and standard deviation among samples. Please click here to download this Table.
Table 7: RS-IoT data attained an ECI and an STCI. It introduces the ecological indices based on the integration of RS-IoT, the Ecological Condition Index (ECI), and the Spatiotemporal Condition Index (STCI). It is a summary of ecological gains that have been made in sites. Please click here to download this Table.
Table 8: AI model performance metrics (Mean±SD). It compares accuracy, precision, recall, and F1-score for all AI models tested. It reports the mean and standard deviation across trials to show performance stability. Please click here to download this Table.
Table 9: Results of monthly RMSE values. It shows the values of RMSE per month to evaluate the accuracy of the prediction of seasons. It identifies the fluctuation of errors and model stability. Please click here to download this Table.
Table 10: Transformer model's attention-weight distribution. It demonstrates the weights of attention that are allocated to various input variables in the transformer model. It shows which features are the most important to the accuracy of the prediction. Please click here to download this Table.
Table 11: Outcomes of soil-salinization accuracy. It presents soil-salinization classification results and compares predictions with ground-truth measurements. It highlights accuracy levels achieved under different data conditions. Please click here to download this Table.
Table 12: Key indicators of real-time monitoring cases. It lists ecological indicators derived from real-time monitoring sessions, such as environmental variability and temporal responses. It summarizes system outputs across case study sites. Please click here to download this Table.
Table 13: System response time (Mean±SD, n=100). It reports end-to-end response time measurements across 100 trials, including sensing, communication, and inference durations. It presents mean and standard deviation to assess consistency. Please click here to download this Table.
Table 14: Acoustic signal intensities. It shows acoustic intensity measurements recorded under different field conditions. It compares sound-level variations linked to ecological or environmental changes. Please click here to download this Table.
Table 15: UAV canopy stress indicators. It lists vegetation stress indicators derived from UAV multispectral and thermal imaging. It includes NDVI, NDRE, canopy temperature, and related metrics. These indicators help assess crop stress and ecological conditions. Please click here to download this Table.
Table 16: Estimations of EEI results. It presents Ecological Efficiency Index (EEI) results across different agricultural zones. It compares ecological performance variations derived from fused datasets. Please click here to download this Table.
Table 17: Energy consumption results. It summarizes energy consumption across sensing, transmission, and computation modules. It compares operational energy use under different system loads. Please click here to download this Table.
Discussion
This research offers a collaborative remote sensing-smart devices-AI architecture that aims to address the typical fragmentation of digital agricultural ecological monitoring. By combining multi-scale satellite data, UAV multispectral imaging, and dense IoT ground sensing with advanced AI models, the suggested workflow improves the spatial and temporal resolution of ecological observations. This integrated method is precisely aligned with the protocol steps indicated in the Protocol, and it addresses the overarching goal of developing a real-time, scalable, and high-accuracy monitoring system for digital agriculture.
When compared to traditional methodologies, the approach provides clear benefits. Unlike RS-only systems29, which lack temporal continuity, and IoT-only systems, which lack spatial coverage, the integrated RS-IoT-AI workflow offers a balanced, all-encompassing monitoring capacity. In soil moisture inversion, Rajak30 prediction, and biodiversity detection, hybrid AI models outperform classic machine learning baselines by large margins. The edge-cloud approach considerably improves energy efficiency and response time when compared to cloud-only operations, enabling both scalability and low-cost operation. These strengths emphasize the method's scientific and practical significance in the context of digital agriculture.
The method's success is dependent on a number of crucial procedural elements31. Accurate ecological assessments rely on high-quality multi-source data collection, which includes cloud-filtered satellite images, calibrated soil sensors, and steady UAV imaging. Precise spatiotemporal alignment between remote sensing and IoT data is also required, as misalignment causes spectral-physical anomalies that reduce AI outputs. Accurate environmental adjustment, sensor calibration, and improved model parameterization (especially in the Transformer, LSTM, and GCN components) all play important roles in prediction reliability. Edge-cloud collaboration is crucial for achieving the < 500 ms processing latency needed for real-time agricultural decision assistance.
To facilitate practical implementation, the protocol allows for many adjustments and contains troubleshooting help for frequent operational issues. In places with persistent cloud cover, SAR imagery can enhance or replace optical RS inputs for assessing soil and vegetation. IoT sensor drift can be rectified by comparing it to manual ground-truth samples on a regular basis, while UAV photography impacted by wind or lighting issues can be reduced by adjusting fly schedules or using stabilized imaging systems32. When network connectivity is constrained, edge devices can store and analyze data until the bandwidth improves. These changes improve usability and ensure that the workflow remains stable over a wide range of environmental and infrastructure conditions.
While the system performs well, many limitations should be addressed. The models are partially region-specific due to differences in soil, climate, and cropping systems, needing calibration or retraining for deployment in different agro-ecological zones33. Even with fusion techniques, cloud reliance remains a barrier for optical RS, and sparse IoT sensor networks may limit geographic generalizability. UAV operations have logistical issues, such as battery restrictions and weather sensitivity. Furthermore, while inference is efficient at the edge, large-scale model training requires substantial computer resources. These limitations indicate potential for additional methodological development.
The framework provides numerous opportunities for future application. Federated learning improves cross-regional generalizability while protecting data privacy34. The integration of hyperspectral and SAR data may improve resilience under cloud cover and biochemical parameter assessment. Automated irrigation, fertilization, and pest management technologies can eventually be coupled with real-time monitoring results to create a closed-loop precision agriculture system. Broader ecological applications, such as carbon accounting, soil restoration tracking, and biodiversity protection, are also realistic extensions of this research35.
This study focused on addressing the fragmentation of RS, smart devices, and AI in digital agricultural ecological monitoring, aiming to reconcile food security with ecological sustainability. Key conclusions are drawn as follows:
First, the presented five-layer distributed collaborative model (perception- network- data- intelligent- application) was able to attain the space-air-ground integrated monitoring. The architecture unified the disparity between large-scale ecological evaluation on the one hand and fined-grained field evaluation on the other hand using satellite RS (macro-scale), UAVs (meso-scale), and IoT sensors (micro-scale), providing a foundational structure to complete-chain ecological surveillance.
Second, data fusion (RS-IoT-meteorology) contributed greatly to the performance of monitoring. The fused data over single data sources, respectively, enhanced the overall integrity, which increased by 23.5% (to 92.3+-2.1%), decreased RMSE of soil volumetric water content and crop NDVI more than 50 percent (to 1.8+-0.3 percent and 0.04+-0.01), and the spatiotemporal coverage index (STCI) of 98.7--a trade-off between 10 m spatial resolution and 1 h temporal frequency.
Third, the task-related hybrid AI model stack had a higher level of performance. LSTM model of crop health monitoring with an MAE of 0.038+-0.005 (123.7% higher than ARIMA), Transformer model of soil moisture inversion 1.78+-0.25% (57.9% better than MLR), and GCN model of biodiversity assessment with an F1-score of 0.83+-0.04 (15.3% higher than CNN-only). All models achieved or surpassed predetermined goals, which gave dependable, intelligent analysis backup.
Fourth, the system practical value was checked with real-life application cases. Early warnings of wheat aphids were used 7 days before (saving the yield loss to 3.2%), maize irrigation was optimized to save 35% water (raising the yield by 12.2%), and soil salinization was detected with 96% accuracy (raising the germination rate by 44%).
Overall, this study fills the gaps in integrated "production-living-ecological" indicators, circular-bioeconomy metrics, and sub-field water-security early warning, providing a scalable solution for digital agricultural industrial ecological management.
Facilitating a real-time ecological monitoring in digital agriculture, this protocol creates a practical and standardized approach for establishing a remote sensing-smart devices-AI collaboration system. The protocol provides a repeatable and flexible method appropriate for a variety of agricultural settings by defining precise protocols for data collection, fusion, transmission, and AI-driven analysis36.
The research has some drawbacks. In remote locations with limited technical resources and digital infrastructure, the multi-layered architecture is potentially difficult to implement and maintain. Additionally, the system's reliance on advanced technologies like dense IoT networks, advanced edge devices, and 5G connectivity will probably limiting its application in areas without developed digital ecosystems.
In addition to the practical limitations, the research finds two more general flaws in the systems used in digital agriculture today. First, a comprehensive framework that completely unifies multi-source data technology into a single structure that allows for multi-level, cooperative decision-making is presently lacking. The ecological-level indicators that connect agricultural performance to broader ecological wellness, sustainability, and long-term ecological consequences are absent in established monitoring systems.
By creating more comprehensive integration frameworks that simplify coordination across sensing, processing, and decision layers, future research should try to address these gaps. To develop more comprehensive ecological indicators that represent soil health, biodiversity, and ecosystem resilience rather than merely localized data, more study is required.
The protocol's adaptability has been further increased by extending the subject to other agricultural contexts, climatic zones, and production scales. It will provide broader accessibility for users operating in a variety of infrastructure and environmental situations.
Disclosures
The authors have nothing to disclose.
Materials
| Name | Company | Catalog Number | Comments |
|---|---|---|---|
| Remote Sensing Platforms | |||
| Multispectral Earth Observation Satellite | Sentinel-2, ESA | Vegetation indices, soil & canopy monitoring Generic description: 10–60 m resolution optical satellite system | |
| Medium-resolution Optical/Thermal Satellite | Landsat-9 OLI/TIRS, USGS | Land surface temperature, soil moisture proxies Generic description: 30 m optical & 100 m thermal satellite | |
| High-resolution Commercial Satellite | PlanetScope, Planet Labs | Fine-scale crop stress detection Generic description: 3 m multispectral commercial satellite | |
| UAV Systems | |||
| Multispectral UAV Platform | DJI Matrice 350 RTK | Field-level high-frequency imaging Generic description: UAV equipped with multispectral/thermal sensors | |
| Multispectral Camera | MicaSense RedEdge-P | Crop canopy spectral feature extraction Generic description: High-resolution multispectral imaging unit | |
| IoT Sensors (Ground Devices) | |||
| Soil Sensor | ESP32-based soil sensor modules | Soil moisture & salinity monitoring Generic description: Soil moisture, EC, pH sensor | |
| Weather Monitoring Station | Commercial AWS units (e.g., Lufft, Vaisala) | Temperature, humidity, PAR, rainfall Generic description: Automatic meteorological station | |
| Acoustic Biodiversity Sensor | Bioacoustic IoT sensors (20–20,000 Hz) | Biodiversity assessment Generic description: Audio sensor for insect sound monitoring | |
| RGB Crop Camera | 1920×1080 IoT camera modules | Crop canopy monitoring Generic description: High-resolution RGB imaging camera | |
| Networking Equipment | |||
| LoRaWAN Gateway | LoRaWAN gateways (3–5 km range) | Wireless sensor data transmission Generic description: Long-range low-power IoT communication gateway | |
| 5G Network Module | 5G NR module (generic) | Real-time UAV/edge data transfer Generic description: High-speed communication module | |
| Edge Computing Devices | |||
| Edge AI Computing Unit | NVIDIA Jetson Xavier NX | On-site AI inference (less than 500 ms) Generic description: Low-power GPU-based edge AI processor | |
| Cloud Infrastructure | |||
| Cloud Compute Server | Alibaba Cloud ECS / Tesla V100 GPUs | Model training, large-scale data storage Generic description: High-performance cloud computing instance | |
| Software / AI Tools | |||
| Deep Learning Environment | Python, TensorFlow/PyTorch | AI modelling (LSTM, Transformer, GCN) Generic description: Python-based AI processing environment | |
| Geospatial Processing Software | QGIS / ArcGIS | Image cleaning, GIS mapping Generic description: Remote sensing preprocessing tool | |
| Reagents & Field Materials | |||
| Satellite Data Platforms | Copernicus Hub, USGS EarthExplorer | Data download Generic description: Remote sensing data access platform | |
| Soil Sampling Tools | Standard soil auger kits | Ground-truth moisture & EC validation Generic description: Field soil sampling equipment | |
| Insect Sampling Tools | Standard entomological sampling sets | Biodiversity ground truth collection Generic description: Pitfall traps, sweep nets | |
| Miscellaneous Instruments | |||
| PAR Sensor | PAR quantum sensor | Crop photosynthesis-related measurement Generic description: Light intensity sensor | |
| Environmental Logging Equipment | Data loggers compatible with IoT sensors | Continuous monitoring Generic description: Data logging modules |
References
- Chowdhury, S., et al. Does agricultural ecology cause environmental degradation? Empirical evidence from Bangladesh. Heliyon. 8 (6), e09750-e09750 (2022).
- 2024 International Conference on Artificial Intelligence and Quantum Computation-Based Sensor Application (ICAIQSA). Shriwas, M., Sindhi, K. Nagpur, , Institute of Electrical and Electronics Engineers (IEEE). (2024).
- Ullo, S. L., Sinha, G. R. Advances in IoT and smart sensors for remote sensing and agriculture applications. Remote Sens. 13 (13), 2585-2585 (2021).
- Fuentes, S., Gonzalez Viejo, C., Tongson, E., Dunshea, F. R. The livestock farming digital transformation: Implementation of new and emerging technologies using artificial intelligence. Anim Health Res Rev. 23 (1), 59-71 (2022).
- Wubuli, J., Xue, D., Song, Y., Ma, B. Method for identifying rural ples and its applications. Ecol Indic. 166, 112273(2024).
- Crovella, T., Paiano, A., Falciglia, P. P., Lagioia, G., Ingrao, C. Wastewater recovery for sustainable agricultural systems in the circular economy-a systematic literature review of life cycle assessments. Sci Total Environ. 912, 169310(2024).
- Huang, J., et al. Remotely sensed high-resolution soil moisture and evapotranspiration: Bridging the gap between science and society. Water Resour Res. 61 (5), e2024WR037929(2025).
- Ogawa, S., Selvaraj, M. G., Ishitani, M. Crop development with data-driven approach towards sustainable agriculture: Achievements and opportunities of collaborative research between CIAT and Japan. JARQ. 55 (Special), 463-472 (2021).
- Monteiro, A. T., et al. Remote sensing of vegetation and soil moisture content in Atlantic humid mountains with Sentinel-1 and 2 satellite sensor data. Ecol Indic. 163, 112123-112123 (2024).
- Avaria, R. C. Digital agriculture in India: A new green revolution? [Doctoral Thesis]. , King's College London. (2024).
- Panigrahy, S. K., Das, P., Tripathy, S. K. Agricultural soil health monitoring using photonic crystal fiber based on combined principles of surface plasmon resonance and interferometry for lead ion detection. J Nanophotonics. 17 (3), 036013-036013 (2023).
- Alberti, S., Stasolla, G., Mazzola, S., Casacci, L. P., Barbero, F. Bioacoustic IoT sensors as next-generation tools for monitoring: Counting flying insects through buzz. Insects. 14 (12), 924-924 (2023).
- Kaundal, M., et al. An extensive analysis of unmanned aerial vehicle technology and its effect on agriculture. Ecol Environ Conserv. 30 (4), 1907-2024 (2025).
- Fountas, S., Espejo-García, B., Kasimati, A., Mylonas, N., Darra, N. The future of digital agriculture: Technologies and opportunities. IT Prof. 22 (1), 24-28 (2020).
- Bandla, A. K., Nagireddy, N. R., Ch, S., Shaik, A. B., Vanitha, T. AI in agriculture: Precision farming and crop monitoring. J Comput Anal Appl. 33 (4), 231-231 (2024).
- Samarinas, N., Tsakiridis, N. L., Kokkas, S., Kalopesa, E., Zalidis, G. C. Soil data cube and artificial intelligence techniques for generating national-scale topsoil thematic maps: A case study in Lithuanian croplands. Remote Sens. 15 (22), 5304-5304 (2023).
- Guo, F., et al. Soil moisture content inversion model based on Sentinel multispectral and radar satellite remote sensing data. J Soil Sci Plant Nutr. 24 (4), 7919-7933 (2024).
- Kerzabi, R., et al. Contribution of remote sensing and GIS to mapping groundwater vulnerability in arid zones: Case from Amour Mountains, Algerian Saharan Atlas. J Afr Earth Sci. 182, 104277-104277 (2021).
- Chandra, S. S. V., Hareendran, S. A., Faisal, A. G. Precision farming for sustainability: An agricultural intelligence model. Comput Electron Agric. 226, 109386-109386 (2024).
- Saranya, K. G., Vedeshva, R. L., Bharath, M., Sivaprasath, R., Achari, M. A review on role of advances in computing in achieving sustainable development goals. Recent Res Rev J. 3 (2), 468-481 (2024).
- Tasneem, M. I. F., Achar, P. V. In Agri 4.0 and the Future of Cyber-Physical Agricultural Systems. , Academic Press. India. (2024).
- Gangopadhyay, S., et al. A new methodological approach to the establishment of sustainable agricultural ecology in drought-vulnerable areas of eastern India. Ecol Inform. 75, 102013-102013 (2023).
- Yang, Z., Diao, C., Li, B. A robust hybrid deep learning model for spatiotemporal image fusion. Remote Sens. 13 (24), 5005(2021).
- Sadenova, M., Beisekenov, N., Varbanov, P. S. Assessing the effectiveness of rs, gis, and ai data integration in analysing agriculture performance to enable sustainable land management. Discov Sustain. 5 (1), 478(2024).
- Karar, M., Alotaibi, F., Rasheed, A., Reyad, O. A pilot study of smart agricultural irrigation using unmanned aerial vehicles and iot-based cloud system. arXiv. , (2021).
- Bu, Z., Fu, J., Jiang, D., Lin, G. Production-living-ecological spatial function identification and pattern analysis based on multi-source geographic data and machine learning. Land. 12 (11), 2029(2023).
- Indira, P., Arafat, I. S., Karthikeyan, R., Selvarajan, S., Balachandran, P. K. Fabrication and investigation of agricultural monitoring system with iot & ai. SN Appl Sci. 5 (12), (2023).
- Li, K., Zhang, B., Xiao, W., Lu, Y. Land use transformation based on production−living−ecological space and associated eco-environment effects: A case study in the yangtze river delta urban agglomeration. Land. 11 (7), 1076(2022).
- Guo, X., Feng, Q., Guo, F. Cmtnet: A hybrid cnn-transformer network for uav-based hyperspectral crop classification in precision agriculture. Sci Rep. 15 (1), 12383(2025).
- A gnn-rnn approach for harnessing geospatial and temporal information: Application to crop yield prediction. Fan, J., Bai, J., Li, Z., Ortiz-Bobea, A., Gomes, C. P. Proc AAAI Conf Artif Intell, 36 (11), 11873-11881 (2022).
- Benschop, N. D., Zewotir, T., Naidoo, R. N., North, D. A new data-standardization procedure for comprehensive outlier detection in correlated meteorological sensor data. Adv Stat Clim Meteorol Oceanogr. 11 (2), 133-158 (2025).
- Jabed, M. A., Azmi Murad, M. A. Crop yield prediction in agriculture: A comprehensive review of machine learning and deep learning approaches, with insights for future research and sustainability. Heliyon. 10 (24), e40836(2024).
- Rajak, P., Ganguly, A., Adhikary, S., Bhattacharya, S. Internet of Things and smart sensors in agriculture: Scopes and challenges. J Agric Food Res. 14, 100776(2023).
- Miller, T., et al. The IoT and AI in agriculture: The time is now-a systematic review of smart sensing technologies. Sensors. 25 (12), 3583(2025).
- Yang, X., et al. Advances in UAV remote sensing for monitoring crop water and nutrient status: Modeling methods, influencing factors, and challenges. Plants. 14 (16), 2544(2025).
- Chen, X., Zhang, H., Wong, C. U. I. Dynamic monitoring and precision fertilization decision system for agricultural soil nutrients using UAV remote sensing and GIS. Agriculture. 15 (15), 1627(2025).
- Manoj, H., et al. AI-driven drone technology and computer vision for early detection of crop disease in large agricultural areas. Sci Rep. , (2025).
- Nyakuri, J. P., et al. AI and IoT-powered edge device optimized for crop pest and disease detection. Sci Rep. 15, 22905(2025).