This study aims to analyze the underlying mechanisms of inflammatory factors associated with atherosclerotic plaques (AP) using RNA-sequencing. The results identified CCL3, CCL4, and CXCL1 key inflammatory hub genes in AP. These chemokines may drive atherosclerosis by promoting M0 macrophage accumulation while suppressing protective immune cells, revealing potential therapeutic targets.
Research Article
Transcriptome Sequencing Identified Hub Pathogenic Chemokines In Atherosclerotic Plaques
* These authors contributed equally
In This Article
Summary
Abstract
Atherosclerotic plaque (AP) is a kind of inflammatory fibrous tissue proliferative disease after the injury of endothelial cells and smooth muscle cells in the artery wall, which can lead to different degrees of cardiovascular and cerebrovascular blood flow obstruction. However, effective therapeutic approaches targeting inflammation have largely failed to date, suggesting that additional insights remain needed. In this study aimed to analyze inflammatory factor-related transcriptomic changes in AP using RNA-sequencing (RNA-seq). RNA-seq was performed on samples from AP patients (n = 11) and control individuals (n = 3). Differentially expressed genes (DEGs) were identified using Metascape, followed by KEGG pathway enrichment analysis using clusterProfiler package in R software, immune infiltration analysis using CIBERSORT, and protein-protein interaction (PPI) network using STRING database. Hub genes within the PPI network were identified using the CytoHubba plugin. A total of 3713 DEGs were identified in AP group, including 2097 up-regulated and 1616 down-regulated genes. The results showed that DEGs were mainly enriched in immune- and inflammation-related pathways. Three inflammation-related factors CCL3, CCL4, and CXCL1 were considered as major hub genes in the pathological process of AP. Immune infiltration analysis revealed a distinct microenvironment in AP, characterized by a significant increase in M0 macrophages alongside reductions in CD8⁺ T cells, activated NK cells, and resting mast cells within AP. In conclusion, these procedural findings describe the differenrial expression of CCL3, CCL4, and CXCL1 and their association with an altered immune cell composition in AP, highlighting the three chemokines as potential candidates for further mechanistic investigation.
Introduction
Cardiovascular disease (CVD) has been a serious threat to human health worldwide1. As the global population aging trend intensifies, the incidence of CVD is also on the rise2. Among them, atherosclerotic plaque (AP) is one of the main causes of CVD3. AP is a chronic inflammatory disease, which is characterized by the gradual accumulation of lipids in the intima of arteries and the formation of plaques4. AP is the common basis for cardiovascular and cerebrovascular events and mainly involves large and medium-sized arteries, leading to ischemia and injury, and is a major factor causing cardiovascular and cerebrovascular diseases and death5. Due to the lack of obvious symptoms in the early stages, AP is usually advanced by the time it is diagnosed, resulting in a high fatality rate6. Treatment for AP focuses on its risk factors, including modifiable factors such as low physical activity, sedentary behavior, smoking, mental health issues7, and obesity and type 2 diabetes due to a high-fat diet, as well as non-modifiable factors including genes, age, and sex8. Recent studies have found that metabolic syndrome, homocysteinemia, hyperuricemia, and pancreatic resistance are important risk factors for the occurrence and development of atherosclerosis9,10.
Theories related to the pathogenesis of AP mainly include the theories of lipid infiltration, inflammation, oxidative stress response, infection, and interaction between genetic and environmental factors11,12. Among them, inflammation and oxidative stress are recognized as the core pathogenesis of AP and participate in all the processes from occurrence to development and deterioration of AP13. Sudden damage of AP unstable plaque, platelet activation and thrombosis are important pathogenesis of myocardial infarction and hemorrhagic stroke14. With continuous research, it has been found that AP contain not only lipids but also many inflammatory cells15. Smoking, hypertension, lipid disorders, hyperinsulinemia, hyperglycemia, high uric acid and other harmful stimuli induce white blood cells and endothelial cells to continuously release soluble adhesion molecules and various cytokines and promote monocytes to adhere to vascular endothelial cells. The accumulated chemokines further lead to the migration of monocytes to the subendothelial space and their differentiate into macrophages, which then phagocytose the cholesterol-rich oxidized low-density lipoprotein (LDL) within the tissue, thereby transforming into foam cells and initiating the formation of lipid streaks16. The early pathological damage of AS, namely lipid streaks, is mainly composed of macrophages and T lymphocyte, which is a typical inflammatory lesion17. Therefore, various inflammatory cells and their products are involved in the initiation and progression of AP18. However, the inflammatory landscape of AP is complex and involves multiple known and potentially unknown factors. Traditional candidate‑gene approaches may fail to capture this full spectrum of inflammatory drivers.
To address this limitation, we employed RNA‑sequencing (RNA-seq), an unbiased high‑throughput transcriptomic method. This approach is particularly appropriate for hypothesis‑generating studies where the key molecular drivers are not predefined. Unlike candidate‑gene or microarray‑based methods, RNA‑seq offers a wider dynamic range, higher sensitivity, and the ability to detect novel transcripts without prior probe design19,20. These features make it especially suitable for discovering inflammation‑related signatures in AP, where the molecular basis remains incompletely characterized.
In this study, RNA-seq was performed to analyze the underlying mechanisms of inflammatory factors associated with AP. Bioinformatics tools employing different algorithms were used to screen for a series of DEGs. Subsequently, enrichment analysis (WGCNA, KEGG pathway, mcode, GSEA, hub gene analysis), and protein-protein interaction (PPI) network analysis were conducted. The results of this study contribute to a better understanding of the molecular pathological mechanism underlying inflammation-driven AP and play an important role in searching for novel biomarkers.
Protocol
This study was approved by the Ethics Committee of Liaocheng People's Hospital (Approval number: 2023014) and adhered to the principles of the Declaration of Helsinki. Informed consent was obtained from all participants. Informed consent forms were signed by all patients or their families.
Patients and samples
This study retrospectively analyzed 11 patients with severe carotid artery stenosis who underwent carotid endarterectomy at the Department of Vascular Neurosurgery, Liaocheng People's Hospital, Shandong Province, China, from January 2023 to December 2023. These patients were enrolled as the AP group. The diagnosis of carotid artery stenosis was based on imaging data such as CTA or cerebral angiography. The inclusion criteria for the AP group were: (1) age between 50 and 80 years; (2) computed tomography angiography/digital subtraction angiography confirmed intracranial internal carotid artery stenosis ≥70%; (3) pre‑onset modified Rankin Scale score ≤ 1; (4) informed consent obtained from the patient or their legal representative. The exclusion criteria were: (1) inflammatory or immune diseases; (2) presence of psychiatric disorders; (3) presence of malignant tumors; (4) pregnancy, lactation, or childbearing potential. Age matched Patients with severe traumatic brain injury who underwent organ donation at the same hospital during the same period were selected as the control group (NA; Normal Control, n = 3). Subjects in the two groups were matched for age, sex, and body mass index to eliminate confounding factors. The inclusion criteria for the control group were: (1) age between 50 and 80 years; (2) no history of coronary artery disease, carotid artery stenosis, or other systemic vascular diseases; (3) informed consent obtained from the patient's legal representative. Carotid artery intima and plaque samples were collected from the AP group during carotid endarterectomy, while aortic intima samples were collected from the control group after organ donation. The vascular and plaque tissues were stored in liquid nitrogen tanks for subsequent testing. The Baseline characteristics of AP patients are shown in Table 1.
Sample preparation
Total RNA extraction was extracted using TRIzol reagent in accordance with the manufacturer's instructions. RNA concentration and purity were assessed using a Nanodrop ND-2000 spectrophotometer at 260 nm and 280 nm (A260/A280 ratio between 1.8 and 2.0). RNA integrity was assessed using 2% agarose gel electrophoresis at 100 V for 30 min. RNA integrity values (RINs) were obtained using the Agilent 2100 bioanalyzer (samples with RIN ≥ 7.0 were used for downstream analysis). All sample handling and RNA extraction procedures were performed at room temperature unless otherwise specified. Waste TRIzol reagent was disposed of according to institutional hazardous chemical waste guidelines.
RNA sequencing
After DNase I treatment of total RNA with, mRNA was enriched using Oligo D (T) magnetic beads and then fragmented into short pieces at 94 °C for 5 min. The resulting mRNA fragments served as template, with random oligonucleotide as primer. First-strand cDNA was synthesized via the M-MuLV reverse transcriptase system at 42 °C for 50 min, followed by RNase H-mediated degradation of RNA strands. Second-strand synthesis was carried out using dNTPs within the DNA polymerase I system. The double-stranded cDNA was purified, ends repaired, and tailed with an “A” overhang to facilitate adapter ligation. AMPure XP beads were utilized to select cDNA fragments of 250-300 bp, which were then amplified via PCR. Thereafter, the amplified products were purified to generate the final library. Library sequencing was performed on the Illumina HiSeq platform with paired-end 150 bp read length. For data quality control (QC), raw data containing adaptor sequences or low-quality bases were filtered out using in-house scripts. Due to sequencing errors that may arise from the instrument, data quality was assessed by analyzing the distribution of sequencing error rates (error rate < 1% was considered acceptable). Additionally, the GC content distribution was determined. All sequencing procedures were performed at ambient temperature unless otherwise noted. Reagents containing hazardous chemicals (e.g., DNase I buffers) were disposed of according to institutional biosafety guidelines.
QC thresholds and troubleshooting
Only samples with RIN ≥ 7.0 and libraries with fragment size 250–300 bp were used. A minimum of 14 million raw reads per sample with Q30 ≥ 98% was required. Low library yield was resolved by increasing PCR cycles to 18, but 15 cycles were preferred to keep duplicate rates below 15%.
Screening of DEGs
We evaluated the distribution of gene expression levels across different samples. Inter-sample correlation of gene expression levels was used to verify experimental reliability and the appropriateness of sample selection. Principal component analysis (PCA) was applied to evaluate inter-group differences and intra - group reproducibility. DEGs were identified using Metascape online database (http://metascape.org/gp/index.html#/main/step1). DEGs were defined as those with |log₂(fold change) | > 1 and a p.‑value < 0.05, which were considered statistically significant. All bioinformatic analyses were performed using default parameters unless otherwise specified. As an intermediate reproducibility checkpoint, PCA plots were generated to confirm that samples clustered by group rather than by batch.
Kyoto Encyclopedia of Genes and Genomes (KEGG) enrichment analysis
KEGG (http://www.genome.jp/) analysis is a systematic approach to evaluating gene function for the discovery of biological regulatory pathways. This paper first obtained the official symbol conversion gene ID of the differential gene from org.Hs.eg (version 3.12.0). KEGG path analysis was performed using clusterProfiler package in R software (version 4.2.0). A p. < 0.05 was considered statistically significant. An intermediate outcome was the generation of a ranked list of enriched pathways with corresponding gene counts and adjusted p-values.
PPI network analysis
To construct the PPI network and screen key gene, the STRING database (version 11.0, https://string-db.org/) was employed. Only interactions with a composite score exceeding 0.9 were retained as statistically significant. The network was visualized and analyzed using Cytoscape (version 3.10.1), an open-source bioinformatics tool designed for exploring molecular interaction networks. Hub genes within the PPI network were identified using the CytoHubba plugin (version 0.1).
Hub gene
The top 20 key genes were selected by CytoHubba Plugin. Red indicates high levels of the gene. The bioinformatics analysis of the hub genes by metascape online database (version 3.5, http://metascape.org/gp/index) to analyze 20 hub genes before. Gene enrichment was identified in the following ontology classes: WGCNA, PCA, mcode, GSEA. All the genes in the genome serve as enrichment background. Items with p. < 0.05, minimum count 3 and enrichment factor > 1.5 were screened.
Statistical analysis method
SPSS 25.0 statistical software was used to analyze the data. The counting data were expressed as frequency or percentage, and the comparison between groups was tested by Chi-square test. The measurement data were consistent with the mean ± standard deviation of normal distribution, and T-test was used for comparison between groups. p. < 0.05 was considered as a significant difference.
Results
RNA-seq data analysis of differential genes in atherosclerotic plaques
Only samples with RIN ≥ 7.0 were used for library preparation. All 14 samples (11 AP, 3 control) passed this threshold. All samples were sequenced in a single batch; therefore, no batch effect adjustment was necessary. An average of 16.8 million raw reads per sample were generated; after quality filtering, 16.5 million clean reads (98%) were retained, with 91% uniquely mapped to the human reference genome (hg38). DEGs analysis showed that there were 2097 up-regulated and 1616 down-regulated genes (|log2FC| >1, P <0.05) in patients with plaques of atherosclerosis compared with healthy controls (Figure. 1A). Heatmap of the top 20 upregulated and downregulated differentially expressed genes were shown in Figure 1B. Transcriptome RNAseq sequencing revealed sample correlations (Figure 1C). The correlation between co-expressed gene modules and phenotypes was analyzed by WGCNA (Figure 1D). PCA analysis showed that there was a significant difference between NA group and AP group (P .< 0.05) (Figure 1E).
KEGG enrichment analysis of differential genes
KEGG pathway enrichment analysis using clusterProfiler package in R software (version 4.2.0) was performed separately on the upregulated and downregulated differentially expressed genes in the disease group (Figure 2A,B). The results showed that these genes were significantly enriched in pathways related to immunity and inflammation such as hematopoietic cell lineage, rheumatoid arthritis, focal adhesion, integrin signaling, and chemokine signaling pathway.
GSEA analysis
GSEA analysis showed that the core genes in the experimental group were mainly enriched at the top, showing an up-regulation trend (Figure 3A). Core genes in the control group were mainly enriched at the bottom, showing a downward trend (Figure 3B). In summary, inflammatory genes were up-regulated in the experimental group (ASA) and down-regulated in the control group (NA).
PPI Networks analysis
In the PPI network analyzed using STRING database (version 11.0), nodes sharing the same cluster ID tend to be positioned close to one another. As shown in Figure 4A, this clustering revealed that the corresponding genes are primarily involved in the regulation of cell activation, inflammatory response, and cell activation. Figure 4B presented the same network colored by p-values, where clusters containing more genes exhibit more significant p.-values.
Hub genes identification and immune cell infiltration analysis
DEGs were selected for mcode analysis and analysis results displayed that are mainly related to acetylcholine receptors (Figure 5 and Table 2). Hub gene analysis using the CytoHubba plugin in Cytoscape identified the top 20 hub genes, most of which were associated with immunity and inflammation (Figure 6A, left panel). The top 10 hub genes consisted of CXCR4, CCL4, CCL3, CCL20, CXCL1, CCL5, CXCL8, CD4, CCR2, and CCR5 (Figure 6A, right panel). The intersection of hub genes with the olink inflammatory panel 92 genes revealed 5 common genes including CXCL1, CCL20, TNF, CCL3, and CCL4 (Figure 6B). The CIBERSORT analysis revealed significant differences in immune cell infiltration between the disease group and healthy controls. Compared with the control group, the disease group exhibited a significantly higher proportion of M0 macrophages (p < 0.05) (Figure 6C). Conversely, the proportions of CD8 T cells, activated NK cells, and most resting cells were significantly lower in the disease group (p. < 0.05 for all) (Figure 6C).
Functional analysis of hub genes
We further analyzed the biological function of Hub gene using metascape database revealing that these genes are mainly associated with cytokine-mediated signaling pathway and calcium-mediated signaling (Figure 7A and Table 3). Cell Type Signatures were then used to enrich transcriptional regulatory factors of the hub gene, showing that hub genes were mainly related to gao large intestine 24W C11 paneth like cell, cui developing heart C8 macrophage, and manno midbrain neurotypes hmgl (Figure 7B). DisGeNET database disease enrichment analysis demonstrated that the hub genes were associated with skin lesion, epstein-barr virus infections, and tick-bome encephalitis (Figure 7C). PaGenBase database tissue characteristic enrichment analysis showed that hub genes were mainly enriched in the spleen, blood, and lung (Figure 7D). In addition, TRRUST database analysis uncovered RELA and NFKB1 to be the main transcription factors regulating the hub genes (Figure 7E).
DATA AVAILABILITY:
The processed count matrix is provided as supplementary files (Supplementary File 1 and Supplementary File 2). All other data are fully presented in the article. Raw sequencing data are available from the corresponding author upon reasonable request.
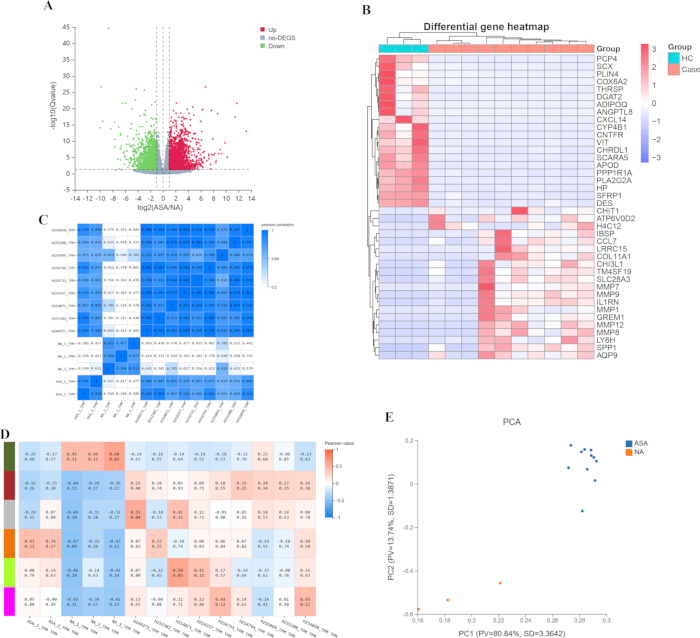
Figure 1: DEGs analysis. (A) Healthy plaques and atherosclerotic plaques, differential gene volcano map, up-regulated 2097, down-regulated 1616 (|log2FC| > 1, P .< 0.05). (B) Heatmap of the top 20 upregulated and downregulated differentially expressed genes. (C) Sample correlation analysis. (D) Correlation between co-expressed gene modules and phenotypes was analyzed by WGCNA. (E) PCA analysis (NA group was significantly different from AP group). Please click here to view a larger version of this figure.
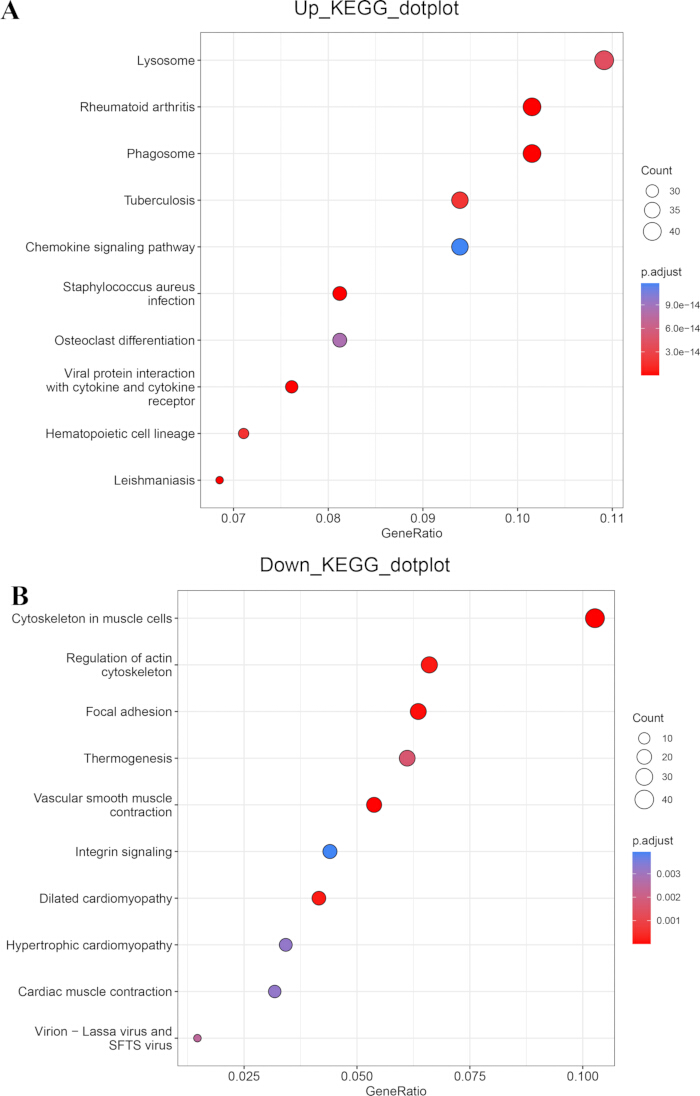
Figure 2: KEGG analysis. KEGG pathway enrichment analysis was performed separately on the upregulated (A) and downregulated (B) differentially expressed genes in the disease group. Please click here to view a larger version of this figure.
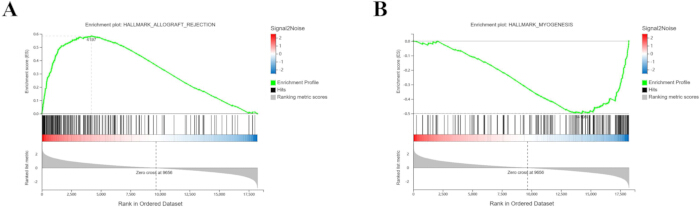
Figure 3: GSEA analysis. (A) GSEA analysis showed that the core genes in experimental group were mainly enriched at the top, showing an up-regulation trend. (B) In control group, the core genes were mainly enriched at the bottom and showed a downward trend. In conclusion, inflammatory genes were up-regulated in the experimental group (AP) and down-regulated in the control group (NA). Please click here to view a larger version of this figure.
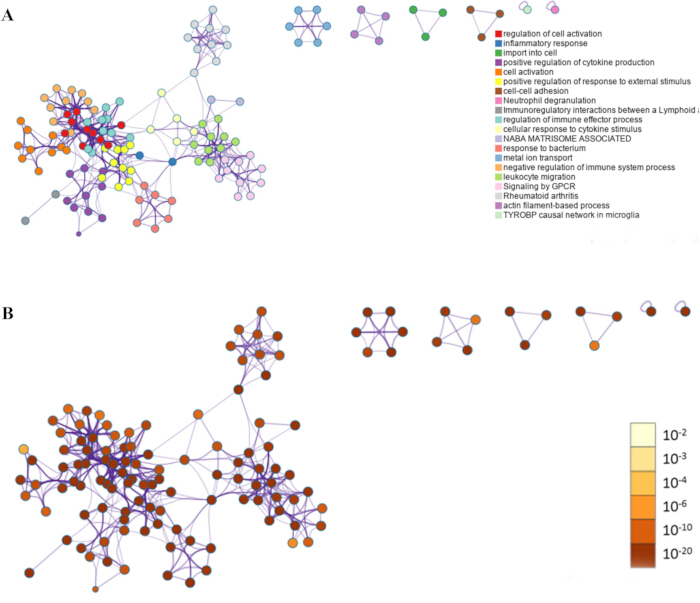
Figure 4: PPI network diagram. (A) Colored by cluster ID, where nodes that share the same cluster ID are usually close to each other. (B) Coloring with P-values, where items containing more genes have more significant P-values. Please click here to view a larger version of this figure.
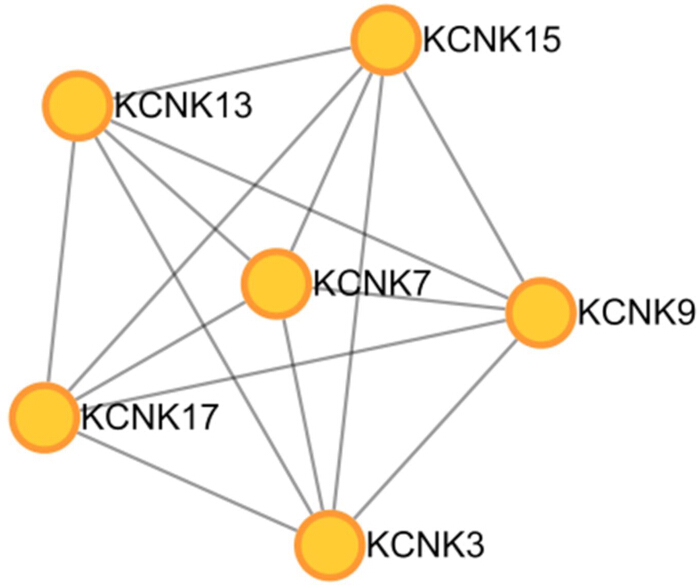
Figure 5: mcode analysis of DEGs. Please click here to view a larger version of this figure.
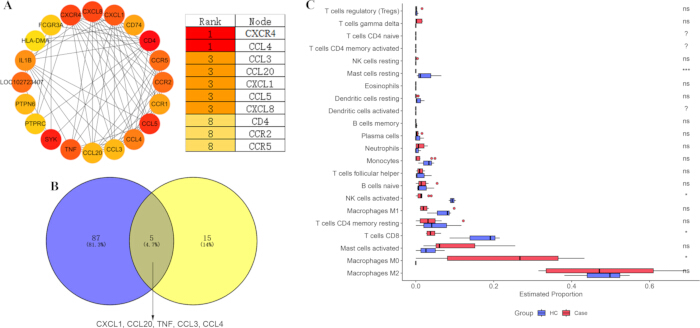
Figure 6: Hub gene analysis. (A) Top 20 hub genes (left panel) and top 10 hub gene (right panel) obtained by degrees calculation method via CytoHubba plugin in Cytoscape, which are mainly associated with immunity and inflammation. (B) Intersection of hub genes and olink inflammatory panel 92 genes identified 5 intersection genes. (C) The CIBERSORT algorithm was employed to compare the infiltration abundance of 22 immune cell subsets between AP and NA groups. Please click here to view a larger version of this figure.
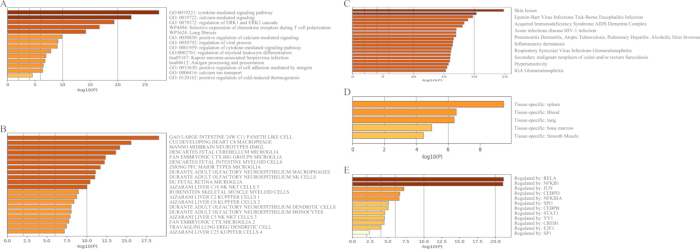
Figure 7: Bioinformatics analysis of hub genes. (A) Functional annotation of hub genes using the Metascape database. (B) Enrichment analysis of transcriptional regulators associated with hub genes based on Cell Type Signatures. (C) Disease enrichment analysis of hub genes performed with the DisGeNET database. (D) Tissue-specific expression patterns of hub genes identified via the PaGenBase database. (E) Transcriptional regulatory network of hub genes analyzed using the TRRUST database. Please click here to view a larger version of this figure.
| MCODE | GO | Description | Log10(P) |
| MCODE_1 | R-HSA-629597 | Highly calcium permeable nicotinic acetylcholine receptors | -10.7 |
| MCODE_1 | R-HSA-622323 | Presynaptic nicotinic acetylcholine receptors | -10.3 |
| MCODE_1 | R-HSA-629594 | Highly calcium permeable postsynaptic nicotinic acetylcholine receptors | -10.3 |
| MCODE_2 | R-HSA-1296346 | Tandem pore domain potassium channels | -10.3 |
| MCODE_2 | GO:0030322 | stabilization of membrane potential | -9.8 |
| MCODE_2 | R-HSA-5576886 | Phase 4 - resting membrane potential | -9.7 |
Table 1: The Baseline characteristics of AP patients
| MCODE | GO | Description | Log10(P) |
| MCODE_1 | GO:0030322 | Highly calcium permeable nicotinic acetylcholine receptors | -19.9 |
| MCODE_1 | R-HSA-5576886 | Presynaptic nicotinic acetylcholine receptors | -19.6 |
| MCODE_1 | R-HSA-1296346 | Highly calcium permeable postsynaptic nicotinic acetylcholine receptors | -16.7 |
Table 2: The MCODE enrichment analysis of DEGs.
| MCODE | GO | Description | Log10(P) |
| MCODE_1 | R-HSA-629597 | Highly calcium permeable nicotinic acetylcholine receptors | -10.7 |
| MCODE_1 | R-HSA-622323 | Presynaptic nicotinic acetylcholine receptors | -10.3 |
| MCODE_1 | R-HSA-629594 | Highly calcium permeable postsynaptic nicotinic acetylcholine receptors | -10.3 |
| MCODE_2 | R-HSA-1296346 | Tandem pore domain potassium channels | -10.3 |
| MCODE_2 | GO:0030322 | stabilization of membrane potential | -9.8 |
| MCODE_2 | R-HSA-5576886 | Phase 4 - resting membrane potential | -9.7 |
Table 3: The MCODE enrichment analysis of hub gene.
Supplementary File 1: Control (n=3) Gene expression.Please click here to download this file.
Supplementary File 2: Patients (n=10) Core table gene.Please click here to download this file.
Discussion
With the continuous deepening of the research on AP, new cytokines are constantly detected in AP, and inflammation has become an important factor in the genesis and development of AS21,22. The activation of albumin may sever the connection between endothelial cells and the vascular intimal matrix and promote endothelial cells to peel from the vascular intima. Induced vascular intimal injury23,24. Inflammation induces oxidative modification of LDL-C, and the modified LDL-C in turn leads to the inflammatory process within the intima of the artery, thereby accelerating AP formation25. Unstable plaques can eventually rupture and cause ACS under the use of internal and external causes26. During plaque rupture, macrophages, vascular smooth muscle cells (VSMC), and lymphocytes secrete inflammatory factors such as leukocyte interleukin-1 (IL-1), IL-6, intervascular adhesion factor-1, and intercellular adhesion factor-1. Concurrently, the expression of leukocyte integrin (CD11b/CD18), a receptor on monocytes and granulocytes, is increased27,28. However, the molecular mechanism of inflammation leading to the formation of AP remains to be further explored.
The occurrence and development of AP caused by inflammation is a complex course of multi-factor action, multi-gene change and multi-stage disease, especially closely related to the abnormal expression of many genes. In this study, RNA-Seq and bioinformatics analysis revealed that, between healthy control tissues and AP, the volcano plot of DEGs showed 2097 up-regulated and 1616 down-regulated genes. Further KEGG enrichment analysis of DEGs demonstrated that the DEGs were mainly enriched in immune- and inflammation-related pathways. Hub gene analysis identified the top 10 hub genes consisting of CXCR4, CCL4, CCL3, CCL20, CXCL1, CCL5, CXCL8, CD4, CCR2, and CCR5. The intersection of hub genes with the olink inflammatory panel 92 genes revealed 5 common genes including CXCL1, CCL20, TNF, CCL3, and CCL4. These results suggest that the inflammation-related factors CCL3, CCL4, and CXCL1 may play a crucial role in the pathological process of AP. Immune infiltration analysis revealed a distinct microenvironment characterized by a significant increase in M0 macrophages alongside reductions in CD8⁺ T cells, activated NK cells, and resting mast cells within plaques.
M0 macrophages represent an uncommitted pool that can readily internalize oxidized LDL and differentiate into foam cells, a hallmark event in early atherogenesis29. The elevated proportion of M0 macrophages observed in the disease group points to an accumulation of these precursor cells within the plaque microenvironment. CCL4, primarily produced by activated macrophages and T cells, serves as a persistent stimulus that sustains macrophage activation via the NFκB signaling pathway, promotes the expression of adhesion molecules, and induces matrix metalloproteinase-2 and -9, thereby facilitating the transition of M0 macrophages toward a pro-atherogenic state and directly compromising plaque stability30. The reduced proportion of CD8⁺ T cells may reflect CCL3-mediated suppression of atheroprotective T‑cell subsets. Komissarov et al. demonstrated that T‑cell migration into human atherosclerotic plaques occurs predominantly via the CCR5‑CCL3 axis31. Moreover, Döring et al.32 uncovered a non‑canonical pathway whereby CCL17 signals through CCR8 to induce CCL3 expression, which in turn suppresses regulatory T cell differentiation; genetic ablation of CCL3 in CD4⁺ T cells boosted FoxP3⁺ Treg numbers and limited atherosclerosis, whereas CCL3 administration exacerbated disease and restrained Treg differentiation. This shift likely diminishes atheroprotective CD8⁺ regulatory T cells while promoting pathogenic effector T cells, resulting in the net decrease in CD8⁺ T cell proportion observed in our analysis. The reductions in activated NK cells and resting mast cells likely reflect alterations in activation status rather than an absolute loss of these populations. Bonaccorsi et al.33 reported that symptomatic carotid plaques exhibit increased NK cell infiltration and IFN‑γ production, directly linking NK cell activation to clinical plaque instability. For mast cells, Wezel et al.34 demonstrated that chemokines released from activated mast cells, particularly CXCL1, induce neutrophil recruitment via the CXCL1/CXCR2 axis, thereby aggravating the ongoing inflammatory response and promoting plaque progression and destabilization. Thus, the decreased proportion of activated NK cells and resting mast cells likely reflects their activation, degranulation, or exhaustion within the inflammatory plaque milieu, rather than a true numerical depletion.
There are several limitations of this study. First, this study is based solely on transcriptome sequencing and are limited by the small sample size. Beyond the limited sample size, several technical limitations of the RNA‑seq protocol should be noted. Bulk RNA‑seq masks cellular heterogeneity; single‑cell approaches are needed to resolve cell‑type‑specific expression of CCL3, CCL4, and CXCL1. Computational immune deconvolution (CIBERSORT) provides estimates only, not direct measurements. RNA abundance does not always correlate with protein levels; orthogonal validation is required. Future studies should address these limitations by using single‑cell transcriptomics, larger and independent cohorts, orthogonal protein validation.
In conclusion, the present findings underscored the important role of inflammatory factors in the pathophysiological process of AP. Furthermore, we identified the hub genes CCL3, CCL4, and CXCL1, which may form a coordinated chemokine network that drives atherosclerosis by promoting M0 macrophage accumulation, suppressing protective T‑cell subsets, and altering the activation states of NK cells and mast cells. Overall, these findings highlight the three chemokines as critical regulators of the plaque immune microenvironment and potential therapeutic targets.
Disclosures
The authors declare that they have no competing interests.
Acknowledgements
This work was supported by Natural Science Foundation of Shandong Province [grant number ZR2022QH125]; Medical and Health Science and Technology Development Plan of Shandong Province [grant number 202104090566; 202304040921]; Project of Medical Staff Science and Technology Innovation Plan of Shandong Province [grant number SDYWZGKCJH2023021].
Materials
| Name | Company | Catalog Number | Comments |
|---|---|---|---|
| TRIzol | Invitrogen | 15596026CN | RNA extraction |
| Nanodrop ND-2000 spectrophotometer | Thermo Fisher Scientific | ND2000 | RNA concentration detection |
| Agilent 2100 bioanalyzer | Agilent | G2939BA | RNA quality control |
| Illumina HiSeq TM 2000 | Illumina | HiSeq 2000 | Transcriptome sequencing |
| Oligo D (T) magnetic beads | New England Biolabs | S1550S | RNA enrichment |