This protocol presents a reproducible AI-driven workflow that fine-tunes BERT for entity and relation extraction, employs graph neural networks for ontology alignment, constructs enterprise knowledge graphs from unstructured data, and systematically evaluates semantic retrieval performance and decision-support efficiency.
Method Article
An AI Workflow Combining Bidirectional Encoder Representations from Transformers (BERT) and Graph Neural Networks (GNNs) for Knowledge Retrieval in Digital Enterprises
Opens in a new tab
In This Article
Summary
Loading...
$$\rightleftharpoonup{xx}$$
$$\longleftharp{xx}$$,
$$\longrightharp{xx}$$,
Abstract
Loading...
$$\rightleftharpoonup{xx}$$
$$\longleftharp{xx}$$,
$$\longrightharp{xx}$$,
Large volumes of unstructured organizational data can make it difficult for enterprise knowledge management (KM) systems to extract correct and contextually relevant information, which can lead to inefficient knowledge sharing and delayed decision-making. This study suggests a unified artificial intelligence-driven framework to overcome this limitation. It combines Graph Neural Networks (GNNs) for ontology alignment and semantic reasoning with refined Bidirectional Encoder Representations from Transformers (BERT) for domain-specific entity and relation extraction. Systematic data collection, preprocessing enterprise text corpora, fine-tuning BERT to identify entities and relationships, converting extracted triples into structured knowledge graphs, and GNN-based ontology alignment to guarantee semantic consistency across heterogeneous knowledge sources, comprise the methodological pipeline. To evaluate system efficacy in real-world enterprise scenarios, the framework also integrates task-oriented assessment measures, such as retrieval precision, ontology alignment correctness, and decision latency. When compared to baseline methods, experimental validation across two industry applications shows a 35% decrease in decision-making latency and a 21% gain in knowledge retrieval precision.
Furthermore, user feedback indicates that the KM interface has boosted user satisfaction through its semantic search and contextual tagging features. The suggested architecture facilitates reproducible knowledge graph building from unstructured enterprise data by methodically fusing graph-based reasoning and alignment with deep learning-based information extraction. The findings demonstrate that both strategic and operational KM outcomes improved when organized knowledge representations are aligned with organizational procedures. All things considered, the suggested method increases retrieval accuracy, speeds up decision workflow reaction times, and offers a workable and scalable option for enterprise-level KM systems.
Introduction
Loading...
$$\rightleftharpoonup{xx}$$
$$\longleftharp{xx}$$,
$$\longrightharp{xx}$$,
Effective KM can be difficult to adopt in digital transformation programs due to disjointed data repositories, diverse organizational platforms, and fragmented knowledge spread across unstructured documents. A reproducible, technically implementable framework that methodically extracts, structures, aligns, and operationalizes enterprise knowledge has not been proposed by much research, despite earlier studies looking at AI adoption and digital transformation from organizational and sectoral perspectives1,2,3. Current methods focus mostly on managerial or strategic consequences, but they don't offer enough architectural detail for scale deployment. Prior research has shown that effective knowledge transfer in distributed digital work environments depends not only on technical infrastructure but also on the interaction mechanisms that enable coordination, shared understanding, and continuity across organizational actors (Aman & Nicholson, 2009). This reinforces the need for enterprise knowledge management architectures that do more than extract information, but also preserve the contextual conditions necessary for meaningful knowledge exchange4.
Conventional management information systems (MIS) and enterprise resource planning (ERP) systems primarily handle structured data and facilitate transactional reporting, but they cannot process unstructured text or perform context-aware semantic reasoning. On the other hand, contextual entity and RE from complicated textual corpora5,6 is made possible by transformer-based models like BERT. In a similar vein, GNNs have proven to be highly capable of relational reasoning, graph representation learning, and ontology alignment in a variety of diverse fields7,8,9. Despite these developments, current research usually uses these models separately rather than incorporating them into a cohesive business KM pipeline.
Big Data Analytics, cloud computing, the Industrial Internet of Things, and advanced machine learning are examples of recent technical advancements that have expedited digital transformation in industries like manufacturing, healthcare, professional services, and governance10,11,12,13. At the same time, international policy frameworks place a strong emphasis on the responsible application of AI, emphasizing ethical alignment, accountability, and transparency in digital systems14,15,16. Nevertheless, ethical interpretability and technical robustness are rarely combined in a single architecture in existing KM systems.
In environmental, social, and governance (ESG) reports, for example, AI-driven decision-making may ignore complex moral issues that call for decisions from humans. A decrease in the capacity to assess data utilizing specialized decision17 may result from an over-reliance on knowledge. The counselling function performed by PAs, which has historically been based on economic knowledge and client interaction, may ultimately be diminished by automation18. This could disrupt because the tools intended to advance the profession may unintentionally compromise critical human abilities.
The natural combination of cutting-edge digital technology with an improved anxiety on moral commercial performance and enterprise that orders persons symbolize Industry 6.0, a ground-breaking phase in industrial development19. This stage, which shapes on Industry 4.0 and Industry 5.0, is the next stage of technical growth. By visualizing a time where invention improves rather than substitutes human aptitudes, Industry 6.0 extends these thoughts20. This plan discourses moral worries about mechanization while indorsing collaboration among humans and robots, cumulative efficiency21. The business component of employee’' DL is important since interactions with co-workers within the company frequently shape an individual's competency and comprehension of digital technology. This strategy seeks to be in line with studies that attempt to clarify ways to enable workers and new technology to collaborate so that different jobs and operations may be carried out in businesses22,23. Because it gives them exposure to a larger consumer base, DL is seen as crucial to small firms survival24. Relative to traditional company structures, managers in SMEs can run their companies more efficiently and with fewer physical assets by utilizing technological advances25,26.
The development of online advertising capacity, that in effect improves business performance, depends on technological resources such as technological advances and connection with company objectives27. The electronic focus of a company and the technical revolution in its customer surroundings, however, function as moderators of these impacts28. Businesses can more effectively use IT progress and synchronization to develop their online promotional capabilities by deeply integrating digital technology into their businesses, products, offerings, and plans.
The two mechanisms of AI technological reserves are capital expenditures (capex), which can be used for Big Data platform organization, additions and advancements, and information science and machine learning invention schemes, or operating costs, which are used to allowance licenses for AI and Big Data tools within the organization, or, finally, AI-related training for staff members29. The benefits of adopting AI are higher for businesses that additionally engage in other technologies and follow internal R&D strategy, according to Lee's30examination into AI asset actions. Additionally, it's critical to decide among employment outside authorities and using internal AI-skilled staff31. The position of human resources in this field of training is a major focus of current research, and the results show that businesses with in-house AI knowledge spend in development that talent in order to gain an edge over rivals32,33.
Protein interactions were predicted with GNNs in34, and predictions were verified with LLMs. The approach was very accurate and provided interpretable explanations. Advanced machine learning and deep learning techniques like BERT have been used to study large scale social media data in times of crisis35. RNN, CNN, and GCN help process and classify enormous amounts of data and can be applied in tumor detection36. The authors in37,38,39,40presents a novel approach of augmenting recommender systems by integrating both social and knowledge graphs with GNN based models.
Prior research has not thoroughly investigated how transformer-based semantic extraction and graph-based reasoning can be systematically integrated to improve both operational and strategic KM functions, despite the fact that AI and Big Data Analytics are acknowledged as transformative forces in professional environments. In particular, established frameworks that (i) transform unstructured corporate text into semantically aligned knowledge graphs, (ii) guarantee ontology-level consistency across distant sources, and (iii) statistically assess the impact of enterprise decision support are lacking.
In order to close this gap, this study predict that, in comparison to traditional ERP/MIS-based and keyword-driven KM systems, combining domain-adaptive transformer-based information extraction with GNN-driven ontology alignment and reasoning will greatly increase semantic retrieval accuracy and decrease enterprise decision latency. An executable AI-Big Data Analytics-driven KM framework is proposed in this study. It can perform the following tasks: domain-specific entity and relation extraction using a fine-tuned transformer model; knowledge graph construction from extracted triples; GNN-based ontology alignment and relational reasoning; and task-oriented evaluation using retrieval precision, alignment accuracy, and decision latency metrics.
The novelty of the suggested approach is its dual-layered KM alignment, which concurrently supports strategic KM through structured knowledge integration that improves organizational agility and innovation capability; and Operational KM through enhanced decision support, process optimization, and contextual retrieval. This paper offers an end-to-end, empirically proven architecture implemented across two real-world enterprise systems, in contrast to previous conceptual or single-model research. The experimental results show a 35% decrease in decision-making latency and a 21% increase in retrieval precision. Additionally, by connecting AI-driven outputs to semantically organized knowledge representations, the system improves interpretability and facilitates transparent and responsible decision-making. This study creates a scalable and repeatable paradigm for enterprise knowledge graph construction and intelligent KM in advanced digital transformation environments that are in line with Industry 6.0 principles by methodically fusing transformer-based contextual encoding with graph-based semantic reasoning.
Access restricted. Please log in or start a trial to view this content.
Protocol
Loading...
$$\rightleftharpoonup{xx}$$
$$\longleftharp{xx}$$,
$$\longrightharp{xx}$$,
Ethical statement
This study was reviewed and approved by the Institutional Review Board (IRB) of The National University of Malaysia (UKM) prior to data collection (Approval ID: UKM/FEP/2025/AI-047; Approval Date: 12 March 2025). The approved protocol covered the administration of structured surveys and semi-structured interviews involving human participants. All participants were informed about the purpose of the study, the voluntary nature of their participation, and their right to withdraw at any time without consequence, and written informed consent was obtained before their inclusion. Participant anonymity and confidentiality were strictly maintained, with no personally identifiable information included in the analysis or publication, and all data were securely stored and used solely for academic research purposes in accordance with institutional ethical standards and relevant international guidelines for human-subject research.
Overall architecture of the proposed BERT–GNN KM framework
Initially a fine-tuned transformer encoder was used to process unstructured text, including internal documents, customer interactions and social media content. The overall system architecture of the BERT–GNN-based KM workflow is shown in Figure 1. The enterprise data used in this study were collected in digital document formats, including structured survey files, interview transcripts, internal enterprise reports, and publicly available case study documents. All documents were consolidated into a unified corpus for analysis. Textual content was extracted from these sources and cleaned to remove irrelevant metadata, duplicate entries, and formatting artifacts. The cleaned corpus was then segmented into sentences and tokenized to prepare it for downstream natural language processing such as text extraction using parsers, noise removals, sentence segmentation and tokenization using Word piece tokenizer. This processed textual dataset served as the input for the fine-tuned model for entity and relation extraction34 which have 12 layers with 12 attention heads and 768 hidden units. The extracted data were organized into a Knowledge Graph, which provided a structured and interconnected representation of knowledge across the enterprise domain ontology mapping. GNNs were applied for ontology alignment using cosine similarity and reasoning to ensure that semantic relationships across knowledge domains were accurately captured and logically inferred by removing the duplicates through string similarity with the threshold 0.85. The processed knowledge was then utilized within the decision-making layer, enabling efficient data analysis and facilitating data-driven decision-making. This architecture transformed fragmented data into intelligent, context-aware information assets. The framework was validated through business case simulations and benchmarked against conventional KM systems such as Naive Bayes (NB), Support Vector Machine (SVM), Random Forest (RF), TF-IDF, LDA, BERT only and BERT with KG with the dataset split of 70:15:15 and fixed seed of 42 to evaluate performance improvements in retrieval accuracy, decision latency, and knowledge utility.
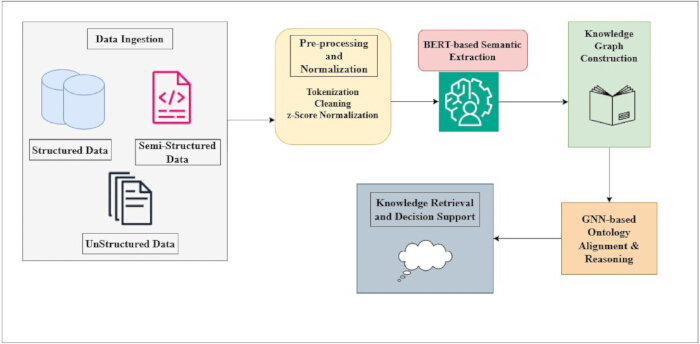
Figure 1: Overall System Architecture of BERT-GNN based KM Workflow. Overall AI–BDA–GNN system architecture showing multi-source data ingestion, pre-processing, fine-tuned BERT for semantic extraction, KG population, GNN-based ontology alignment/reasoning, and the decision-making layer. Arrows indicate data flow and optional feedback loops for online learning. Please click here to view a larger version of this figure.
Data acquisition
The dataset used in this study was collected from multiple sources to support representativeness and external validity. Primary data collection through structured surveys and semi-structured interviews with practitioners in the IT, manufacturing, healthcare, and education sectors included certified members of the Chamber of Financial Auditors of Romania. The secondary data included anonymized internal enterprise documents, annual reports, and publicly available digital transformation case studies. The data collection was done within a well-defined study period, and all records were anonymized on grounds of institutional ethical clearance to protect confidentiality and ensure compliance.
Participation Selection Criteria: To guarantee methodological rigor and representativeness, participants were chosen based on well-defined inclusion and exclusion criteria. In addition to being actively involved in digital transformation, KM, artificial intelligence, big data analytics, or enterprise information systems initiatives, eligible participants had to have at least three years of professional experience in IT, manufacturing, healthcare, education, accounting, or related enterprise environments. It was necessary for certified professionals to have active certification status during the data collecting period (e.g., members of the Chamber of Financial Auditors of Romania). In order to accurately understand the survey and interview materials and to give informed permission in accordance with the authorized IRB protocol, participants were also required to demonstrate proficiency in either Romanian or English. Those with less than three years of relevant experience, inactive professional status (if applicable), no direct involvement in enterprise-level knowledge or decision-making processes, incomplete survey responses (more than 20% missing data), or unsuccessful data quality screening checks were all excluded. Additionally, transcripts of interviews that were not sufficiently detailed or pertinent to KM techniques were not included in the analysis. A competent, sector-representative, and analytically sound participant sample was guaranteed by these standards.
Certified members of the Chamber of Financial Auditors of Romania (CAFR) were a key target population for data collection. An online survey was developed and distributed through CAFR internal communication channels to support targeted distribution and high response rates. To form a representative sample, CAFR histories were reviewed and 250 registered participants were selected based on study-relevant features.
Survey instrument structure: The study used a structured questionnaire with 24 items spread across five construct domains: organizational agility and operational efficiency (5 items), strategic decision support and innovation capability (5 items), Big Data Analytics impact on knowledge sharing (5 items), AI adoption in KM (5 items), and user-perceived effectiveness and system usability (4 items). A 5-point Likert scale, with 1 denoting "strongly disagree" and 5 denoting "strongly agree," was used to rate each item. The tool was contextualized for enterprise AI implementation and modified from previously validated KM and digital transformation scales. Three academic scholars and two business experts conducted an expert review to confirm content validity. To improve language, gauge clarity, and measure reliability, a pilot research with 20 practitioners was carried out; all components had Cronbach's alpha values greater than 0.80, showing strong internal consistency. Semi-structured interviews were also carried out to supplement the survey results. Five subject areas were covered in the interview guide: experience with digital transformation, difficulties with enterprise knowledge flow, integration of AI and Big Data in decision-making, obstacles to semantic alignment, and ethical governance issues. Every interview was performed with informed consent, lasted roughly 45 to 60 minutes, was audio recorded, and was then transcribed for qualitative analysis.
To evaluate the performance of the suggested BERT-GNN framework for KM in digitally transforming organizations, a big and diverse dataset was prepared from different sources in diverse industries. The dataset covers quantitative as well as qualitative aspects to represent the dynamic perceptions regarding knowledge flow and organizational change. Structured data were gathered from more than 250 professionals through an online questionnaire consisting of Likert-scale (range 1–5) items for measuring perceived effects of Artificial Intelligence (AI) and Big Data Analytics (BDA) on knowledge sharing, innovation, and business agility. Concurrently, unstructured data were gathered through semi-structured interviews with 30 domain experts, providing more than 120,000 transcript words. Further semi structured materials including company annual reports and digital strategy papers (in excess of 50 documents) were collected to place enterprise-scale adoption patterns into context. In addition, 15 detailed case studies from the IT, manufacturing, healthcare, and education industries were added to offer practical transformation contexts. Internal knowledge base papers (circa 200 MB), anonymized for privacy reasons, and were also included to enhance the portrayal of operational knowledge assets. This multi-source dataset enables a strong training and evaluation pipeline for deep learning models and captures both strategic and operational aspects of KM. Table 1 shows the population sample used for evaluation.
| Component | Type | Source | Size/Volume |
| Professional Survey Responses | Structured | Online surveys from 250+ professionals | ~10,000 records |
| Interview Transcripts | Unstructured | Semi-structured interviews from 30 experts | ~120,000 words |
| Company Reports | Semi-structured | Annual reports and digital strategy docs | 50+ documents |
| Case Studies | Mixed | Industry-specific digital transformation use cases | 15 detailed cases |
| Knowledge Base Content | Unstructured | Internal documents from organizations (anonymized) | ~200 MB |
Table 1: Population Sample used for Evaluation. Provides sample size and sampling frame.
Data pre-processing and BERT fine-tuning
The raw enterprise document data were accessed from curated list and preprocessed using sentence segmentation, tokenization, stop word removal, and normalization to meet the requirements of the tokenizer. The pre-trained model was then further modified to fine-tune the model for a particular task, and fine-tuned to perform a named entity recognition (NER) and relation extraction (RE) task. The model has been fine-tuned on the preprocessed corpus data for a particular epoch count with the Adam optimizer. Finally, contextualized word embedding’s (R768) were produced from identified entities and their relationships. Normalized entities were generated by an ontology-based normalization technique, in which different entities, such as synonyms were converted into normalized form. Each distinct normalized entity was a node, whereas the relation between entities was called an edge in the knowledge graph representation. The normalized entity embedding’s generated by the model formed the initial node features of the Graph Neural Network. In the following step, the Graph Neural Network was trained with the method for supervised link prediction with negative sampling obtained through edge corruption. In the training, there is a cross-entropy loss over a number of epochs. The trained framework was assessed by using Knowledge Retrieval Precision, Decision Making Latency, and User Satisfaction Rate as the evaluation metrics.
A hybrid annotation approach was used to create training labels for RE and NER. Two independent subject-matter experts manually annotated a domain-specific corpus of enterprise documents, such as internal reports, customer interaction logs, and policy documents, using a predetermined ontology schema that identified entity categories (such as Organization, Process, Technology, Role, KPI) and relation types (such as supports, depends_on, and improves). To guarantee uniformity in relation directionality and entity border detection, comprehensive annotation guidelines were created. 20% of the dataset was double-annotated in order to assess reliability. Cohen's Kappa was used to test inter-annotator agreement, and the results showed strong agreement (κ = 0.87 for entity labeling and κ = 0.82 for relation extraction). Weak supervision was then used to expand the manually annotated dataset using rule-based and ontology-constrained pattern matching, with confidence-based filtering to reduce noise. To guarantee complete reproducibility, all annotation procedures, ontology definitions, dataset splits, and random seeds were recorded.
Efficiency in precision was measured at the document level, latency was estimated based on end-to-end query response time, and users were satisfied by using the Likert scale questionnaires. At the end of each stage, following protocol checkpoints were established. (i) BERT output checkpoint - sample entities and relation triples extracted; (ii) KG checkpoint sample of constructed sub-graph with ontology labels; (iii) GNN checkpoint - sample of ontology prediction and inferred link; and (iv) retrieval checkpoint - sample of retrieved knowledge items with relevance labels.
The proposed protocol is of the following structure: deterministic, multi-stage pipeline with well-defined intermediate outputs, allowing for full reproducibility. Step 1, After raw structured, semi-structured, and unstructured enterprise data ingestion and pre-processing, cleaned text corpora and normalized numerical feature matrices will be generated. Step 2: Application of fine-tuned BERT models will be performed for knowledge extraction, giving explicit output in the form of named entities, such as Department, Process, Document, and KPI; (ii) semantic relations between entities, represented as subject-predicate-object triples. In Step 3, these triples are transformed into an initial knowledge graph, in which nodes are entities and relations are typed edges, aligned with a predefined ontology schema. In Step 4, Graph Neural Network application to this graph for ontology alignment and reasoning would generate improved node embeddings, infer relations, and align ontology labels. Step 5 provides the finalized knowledge graph and reasoning results that will feed semantic retrieval, decision support, and performance evaluation.
All intermediate artifacts, including entity lists, relation triples, ontology-aligned graphs, and inferred links, are explicitly generated at every stage of this protocol, allowing for the independent replication of research with no need for reminders.
The dataset is divided into the training set, validation set, and testing set according to a fixed 70:15:15 ratio to ensure the reproducibility of the experiment results. Tokenization, lowercasing, stop word removal, and sequence shortening to 512 tokens are all done for BERT in terms of text preparation. On the other hand, Z-Score normalization is used to normalize structural features. In addition, the BERT model is fine-tuned using the deep learning framework library with the Adam optimizer where the learning rate is 2e-5, batch size equals 16, and the number of epochs is 5. The predicted extracted entities and relationships are saved in a standard format for the construction of the knowledge graph. In addition, the knowledge graph node embedding (R768) is used as input for the GNN for ontology alignment and reasoning.
BERT-GNN interface and data flow
Within the proposed framework, the transformer encoder is fine-tuned to perform two tasks of NLP: The NER task and the RE task on an enterprise text corpus. Finally, the model outputs include contextualized token embeddings(R768), entity classification labels, and subject-predicate-object relational triplets. Normalized entities are used by constructing a predefined enterprise ontology, where textual variations and synonyms of the entity are mapped to an entity identifier. Each unique normalized entity is assigned a new entity node within the constructed knowledge graph. Depending on the size of the industry corpus, the generated knowledge graph in the assessed enterprise scenarios has between 18,000 and 25,000 entity nodes and 42,000 and 60,000 typed relational edges. Person, Department, Process, Product, Organization, and Document are just a few of the node kinds found in the graph. Other edge types include works_for, manages, belongs_to, produces, approved_by, and related_to. A distinct ontology-based identifier derived from a predetermined enterprise ontology is given to each node. As a result, the resulting heterogeneous graph has typed edges that represent normalized relations and typed nodes with semantic embedding properties. After that, the GNN get these node embeddings for relational reasoning and ontology alignment. Crucially, the GNN functions on the generated graph without back-propagating gradients to the BERT encoder, guaranteeing modular training and maintaining the separation of the graph reasoning and semantic extraction components.
BERT was used in this study for contextual language modeling and semantic feature extraction. The model can efficiently learn to predict the correct category labels for novel text inputs when fine-tuned using labeled data tailored to a specific classification objective. Because BERT is bidirectional, it considers both the preceding and following context of each word, enabling a more comprehensive understanding of relationships within the text. The encoder of the BERT-base model consists of 12 transformer blocks, each containing 12 self-attention heads and a hidden size of 768. Before processing, the input text is divided into tokens depending on the selected tokenization approach, which may represent words or sub-words. The sequence representation derived using BERT is described in Supplementary File 1. The model parameters are optimized by minimizing the log probability of the correct label (Figure 2).
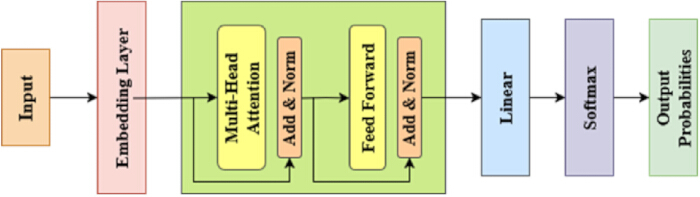
Figure 2: Detailed Working Process of BERT Model used for extracting Semantic Features. Shows input/output dimensions and the role of contextual embeddings for KG population. Please click here to view a larger version of this figure.
Knowledge graph construction using GNN
The schema for the Knowledge Graph is pre-defined before constructing the graph. It provides semantic consistency. The ontology is pre-defined relating to a finite number of types for both entities and relation types, along with domain range constraints, which are helpful for reasoning. The schema is applicable for populating the graph from the triples collected from the BERT model as well as for the relation-aware message passing through the GNN.
Within this framework, the Knowledge Graph (KG) serves as a structured representation of enterprise knowledge, modeling entities (e.g., departments, documents, processes) and semantic relations among them. The mathematical derivations of KG are added in Supplementary file 1. This integration of KG construction and GNN-based reasoning enables ontology alignment, relation inference, and enhanced semantic retrieval within the enterprise KM framework.
The Knowledge Graph (KG) is represented as a heterogeneous graph G, while its structure is expressed by its ontology O. KG can alternatively be seen of as a set of facts that are expressed by assertions of predicate reasoning. These fundamentals have the subsequent descriptions35. The graph G is varied, with V representative the set of objects or nodes (both can be used interchangeably) and  representing the set of relations. A triplet (
 ) can also be used to characterize respectively couple of objects v1 and
  and their association
  . The mathematical derivation of the KG construction using GNN is described in Supplementary File 1.
BERT-GNN-based ontology alignment and reasoning
Algorithm 1 shows the GNN-based Ontology Alignment and Reasoning. The process begins with initializing the node capabilities using pre-extracted embedding’s along with those generated via a high-quality tuned BERT version, which seize the semantic meaning of each entity from unstructured text. The knowledge graph, comprising nodes (entities) and edges (relationships), is represented the use of an adjacency matrix (A) and a feature matrix (X).
The set of rules proceeds via more than one GNN layers. At each layer, the representation of a node is up to date by way of aggregating data from its neighbouring nodes, weighted by their connectivity (i.e., using the adjacency matrix). This is mathematically formulated using a message passing method where node embedding’s are expanded by means of trainable weight matrices and passed via a non-linear activation characteristic which include ReLU. A normalization step (e.g., layer normalization or using diploma matrices as in the GCN equation) guarantees stable gaining knowledge of throughout layers.
After repeating this process for a predefined range of layers T, the model produces a final set of node embedding’s Z, which encode each neighborhood and its shape and semantic capabilities. This embedding’s are then surpassed via a soft max classification layer to predict aligned ontology labels, including entity sorts (e.g., “Department,” “Product,” “Project”) or semantic roles inside the corporation.
Algorithm 1: BERT GNN-based ontology alignment and reasoning
The GNN-based ontology alignment and reasoning process operated on the constructed Knowledge Graph, which consisted of entities represented as nodes and their relationships represented as edges. The initial node representations were derived from BERT-based semantic embeddings and organized into a feature matrix. The adjacency matrix represented the connectivity structure of the graph, and a predefined number of GNN layers was applied to refine node representations. For each layer, the model updated every node by aggregating information from its neighboring nodes based on the graph structure. This aggregation in Eqn (1) is involved multiplying neighboring node representations with trainable weight matrices, adding a bias term, and applying a nonlinear activation function.
 (1)
(1)
After each layer update, normalization was applied to stabilize training and ensure consistent embedding scales. Once all layers were processed, the final node embeddings were obtained. These embeddings were then passed through a classification layer with a softmax function to predict aligned ontology labels or entity classes. The procedure produced the final refined node embeddings and the predicted ontology-aligned labels as outputs.
The proposed method enables semantic alignment of entities from multiple sources and supports reasoning over the knowledge graph by inferring new relationships and classifying previously unlabeled nodes.
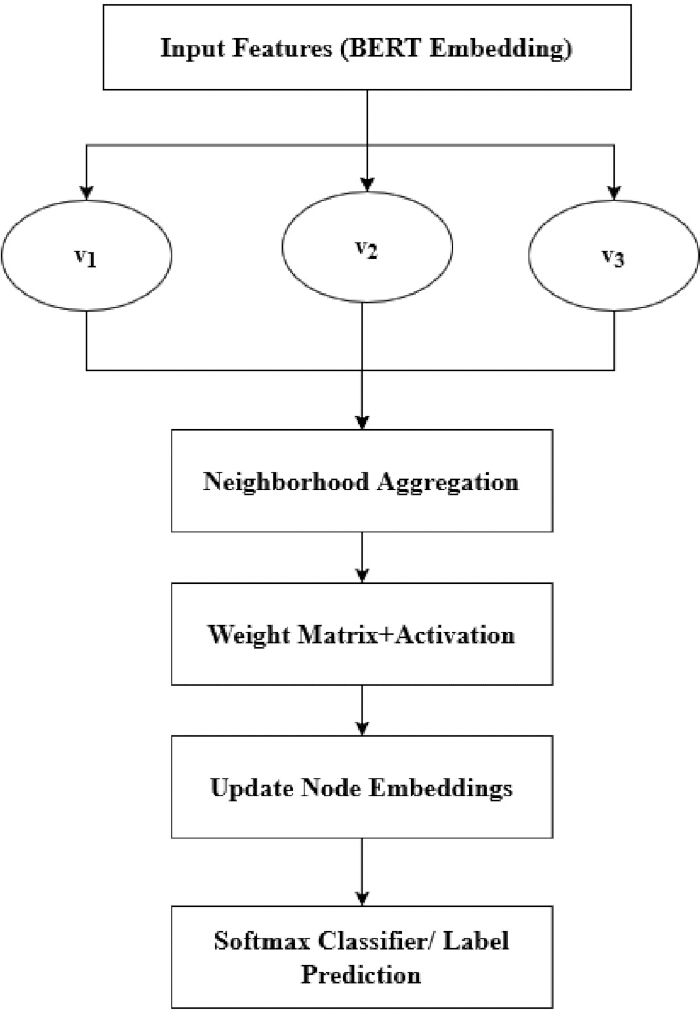
Figure 3: Ontology Alignment and Semantic Reasoning using GNN. Illustrates neighborhood message passing and embedding update steps. Please click here to view a larger version of this figure.
The Figure 3 illustrates the system of a Graph Neural Network (GNN) used for ontology alignment and entity style inner a Knowledge Graph, particularly in the setting of effort on leveraging AI for knowledge organization in digitally remodeling businesses. The process begins with input features generated by a fine-tuned BERT model, which produces contextual embeddings for each entity within the graph, including documents, departments, or business units. These entities are represented as nodes (v1, v2, v3) in a graph form, and the edges denote semantic or relational links among them. The number one node (v2) is demonstrated to combine data from its neighboring nodes (v1 and v3), taking pictures contextual statistics through a procedure called neighborhood aggregation.
The aggregated features are transformed using relation-specific weight matrices and a non-linear activation function (e.g., ReLU), generating updated node embeddings that integrate semantic features derived from BERT with structural information from the graph. These embeddings are then passed to a softmax classification layer to predict entity labels or aligned ontology classes. This established process makes the GNN enormously effective for reasoning over know-how graphs, assisting duties like entity disambiguation, courting inference, and semantic type, in the end contributing to smarter, AI-pushed statistics control structures (Table 2).
| Component | Description |
| Framework/Toolkits | Python 3.9, PyTorch 2.0.1, Hugging Face Transformers 4.34, DGL 1.1 (Deep Graph Library) |
| Hardware | NVIDIA Tesla V100 GPU (16GB), 128GB RAM, Ubuntu 20.04 |
| Pre-processing Pipeline | Tokenization (Word Piece for BERT), stop word removal, entity recognition (SpaCy), z-score normalization for numerical features |
| Dataset Sources | Professional survey (250+ responses), interview transcripts (~120,000 words), company reports (50+), case studies (15), internal documents (200MB) |
| Data Split | 70% training, 15% validation, 15% testing |
| Text Encoder Model | BERT base (uncased), 12-layer, 768 hidden size, 12 attention heads |
| BERT Fine-Tuning | 4 epochs, batch size = 32, learning rate = 2e-5, Adam optimizer, max seq length = 512 |
| Graph Construction | Triplet-based knowledge extraction (subject, predicate, object) |
| Graph Type | Heterogeneous graph with multi relational edges (entities from BERT output) |
| GNN Architecture | 2-layer Heterogeneous Graph Neural Network (message passing model) |
| GNN Hyper parameters | Hidden dimension = 128, Activation = ReLU, Optimizer = Adam, Learning rate = 0.001 |
| Decoder Type | Dist. Mult with dot product scoring for link prediction |
| Loss Function | Binary Cross-Entropy for triplet classification |
Table 2: Configuration Details of BERT Model. Summarizes training settings used for semantic extraction.
Finally, the protocol concludes with the generation of the following outputs: an ontology-aligned enterprise knowledge graph, BERT and GNN models, results of information retrieval and reasoning, and the reports of the KRP, OAA, DML, and USR. These provide the final output in reproducible form. For negative sampling during GNN training, valid triplets are corrupted through entity replacement according to ontology-defined type constraints. The resulting ontology alignments are validated for consistency and manually reviewed by domain experts to ensure semantic coherence between extracted entities and canonical ontology classes.
Evaluation criteria
Decision-Making Latency is the measure of the total time taken by the system to provide an actionable response after the user query has been submitted. Let i be the user query,  be the time at which the query is submitted,
  be the time at which the system provides the final decision output. The Decision-Making Latency (DML) is given by:
 (2)
(2)
where is the total number of evaluated queries. This metric measures the overall response time of the proposed framework, from knowledge retrieval to response generation. A lower value for this metric is ideal since it shows a quicker system response time, which is crucial for time-sensitive enterprise decision-making applications.
Knowledge Coverage Ratio is the ratio of the system's ability to retrieve all the relevant knowledge items available for a given query. Let be the set of all relevant knowledge items for query q, be the set of knowledge items actually retrieved by the system. The Knowledge Coverage Ratio (KCR) is defined as:
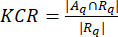 (3)
(3)
This formula calculates the completeness of the knowledge items that are retrieved. It is equivalent to the recall measure used in traditional information retrieval systems.
Access restricted. Please log in or start a trial to view this content.
Results
Loading...
$$\rightleftharpoonup{xx}$$
$$\longleftharp{xx}$$,
$$\longrightharp{xx}$$,
Data pre-processing and BERT fine-tuning
The proposed device integrates a best tuned BERT version for unstructured understanding extraction and a Graph Neural Network (GNN) for ontology alignment and reasoning inside an understanding graph framework. The experimental setup worried comparing the overall performance of the BERT aspect on NER and RE tasks, while the GNN factor turned into examined on link prediction and node class over the built understanding graph.
The F1-sc...
Access restricted. Please log in or start a trial to view this content.
Discussion
Loading...
$$\rightleftharpoonup{xx}$$
$$\longleftharp{xx}$$,
$$\longrightharp{xx}$$,
This study presents a unified enterprise KM framework that integrates contextual semantic extraction using BERT with graph-based relational reasoning and ontology alignment through GNNs. In order to enable entity linking, cross-document reasoning, and coherent knowledge representation across disparate business data sources, the main contribution is the integration of deep contextual language modeling with structured, ontology-aware inference within a single pipeline3,...
Access restricted. Please log in or start a trial to view this content.
Disclosures
Loading...
$$\rightleftharpoonup{xx}$$
$$\longleftharp{xx}$$,
$$\longrightharp{xx}$$,
The authors have no conflict of interest
Acknowledgements
Loading...
$$\rightleftharpoonup{xx}$$
$$\longleftharp{xx}$$,
$$\longrightharp{xx}$$,
The authors gratefully acknowledge the support provided by the Faculty of Economics and Management, The National University of Malaysia, Bangi, Malaysia.
Access restricted. Please log in or start a trial to view this content.
Materials
| Name | Company | Catalog Number | Comments |
|---|---|---|---|
| BERT-Base (Uncased) Pretrained Model | Google AI | N/A | Transformer-based pretrained language model (bert-base-uncased variant) |
| Deep Graph Library (DGL) | AWS Labs | RRID: SCR_017054 | Version 2.1 used for graph neural network modeling |
| Matplotlib Visualization Library | PyData Community | RRID: SCR_008624 | Used for performance plots and visual analytics |
| NetworkX Graph Library | PyPI Community | RRID: SCR_005317 | Version 3.2 used for graph construction and analysis |
| NumPy Numerical Computing Library | PyData Community | RRID: SCR_008633 | Used for numerical operations and array processing |
| NVIDIA GPU (Tesla T4 / RTX 3080) | NVIDIA Corporation | RRID: SCR_016409 | CUDA-enabled hardware accelerator for model training |
| Pandas Data Analysis Library | PyData Community | RRID: SCR_018214 | Used for structured data manipulation |
| Python Programming Language | Python Software Foundation | RRID: SCR_008394 | Version 3.10 used for model development and data processing |
| PyTorch Deep Learning Framework | Meta AI | RRID: SCR_018536 | Version 2.0 used for neural network implementation |
| Scikit-learn Machine Learning Library | Scikit-learn Developers | RRID: SCR_002577 | Version 1.5 used for preprocessing and evaluation metrics |
| Transformers NLP Library | Hugging Face | RRID: SCR_020989 | Version 4.40 used for pretrained transformer models |
| Ubuntu Linux Operating System | Canonical Ltd. | RRID: SCR_018317 | Version 20.04 LTS runtime environment |
Reprints and Permissions
Request permission to reuse the text or figures of this JoVE article
Request Permission