This study identified shared genes, biological pathways, immune associations, and potential therapeutic targets underlying type 2 diabetes mellitus and atherosclerotic cardiovascular disease through integrated bioinformatics and experimental validation.
Research Article
Common Molecular Mechanisms and Candidate Drug Targets in Type 2 Diabetes Mellitus and Atherosclerotic Cardiovascular Disease
In This Article
Summary
Abstract
This study examined the mechanisms underlying the comorbidity between type 2 diabetes mellitus (T2DM) and atherosclerotic cardiovascular disease (ASCVD), while identifying potential therapeutic targets. Common differentially expressed genes (C-DEGs) between T2DM and ASCVD were extracted from the GSE78721 and GSE12288 datasets. Gene Ontology (GO) and Kyoto Encyclopedia of Genes and Genomes (KEGG) pathway enrichment analyses, protein-protein interaction (PPI) network construction, hub gene identification, and Drug-Gene Interaction Database (DGIdb) analysis were conducted. The association between hub C-DEGs and immune-infiltrating cells was analyzed using the CIBERSORT method. Expression levels of hub C-DEGs were quantified through qRT-PCR and Western blot analyses. A total of 32 C-DEGs were identified, comprising 20 upregulated and 12 downregulated genes. C-DEGs were predominantly enriched in key pathways, including viral myocarditis, arrhythmogenic right ventricular cardiomyopathy, hypertrophic cardiomyopathy, and dilated cardiomyopathy. PPI analysis revealed 29 nodes and 39 edges, leading to the identification of eight hub C-DEGs (HSP90B1, PLAU, SLPI, TOP3A, NCF4, PRF1, TUBA1C, and CS) across both datasets. Furthermore, hub C-DEGs (TOP3A, SLPI, NCF4, PRF1, and PLAU) demonstrated significant correlations with immune-infiltrating cell levels. Drugs specifically targeting these hub C-DEGs present promising candidates for the treatment of T2DM and ASCVD. Additionally, the expression of hub C-DEGs at both mRNA and protein levels was validated in patients with T2DM and ASCVD. An integrated bioinformatics analysis facilitated the screening of candidate therapeutic targets, mechanisms, and drugs for T2DM and ASCVD, offering new insights into molecular therapies for these conditions.
Introduction
Diabetes mellitus (DM) is a chronic disease with a complex etiology influenced by various genetic and environmental factors, currently affecting an estimated 463 million individuals worldwide, projected to rise to 700 million by 20451,2. Type 2 diabetes mellitus (T2DM) is a multifactorial condition characterized by insulin resistance and relative insulin deficiency resulting from beta-cell failure, leading to hyperglycemia and dyslipidemia, accounting for 90% of DM cases3,4,5. Insulin resistance serves as a key precursor to numerous cardiovascular metabolic abnormalities that collectively facilitate the development of atherosclerotic cardiovascular disease (ASCVD) and may impact its prognosis6,7. Coronary artery disease (CAD) primarily arises from the progressive accumulation of atherosclerotic material, resulting in luminal narrowing and blood flow obstruction8. Atherosclerosis is driven by multiple factors, including hypercholesterolemia and diabetes9,10. The significant human and financial burdens associated with T2DM and CAD, along with challenges in their long-term management, highlight the urgent need for effective preventive strategies.
Patients with CAD and concurrent T2DM face a markedly higher risk of cardiac events11. Cardiovascular disease (CVD) is a common complication of T2DM and represents the leading cause of mortality among T2DM patients, with approximately 32.2% affected by CVD12. The LoDoCo2 sub-study confirms that concomitant T2DM correlates with an increased risk of major adverse cardiovascular events in chronic CAD populations13. Individuals with T2DM are at elevated risk for ASCVD14,15, and those with chronic CAD who also have diabetes carry a significantly greater risk of subsequent cardiovascular events16, highlighting a critical unmet need for innovative treatment options.
An increasing number of research groups are screening for novel differentially expressed genes (DEGs) in T2DM and ASCVD through comprehensive analyses of transcriptomic data from various databases. Efforts are focused on elucidating the connection between these diseases and identifying effective biological functions. Recent bioinformatics studies have explored T2DM in relation to other conditions; for example, Song et al. identified shared DEGs between T2DM and osteoarthritis17, Castillo-Velázquez et al. predicted the relationship between Alzheimer's disease and DM18, and important genes and pathways in T2DM and polycystic ovary syndrome were recognized through bioinformatics analysis19. However, the molecular mechanisms linking T2DM and ASCVD remain poorly understood, highlighting the importance of identifying new potential therapeutic targets to treat the progression of both conditions.
This study aims to systematically identify shared molecular pathways and potential therapeutic targets between T2DM and ASCVD by conducting an integrated bioinformatics analysis of transcriptomic data from the GSE78721 (T2DM) and GSE12288 (ASCVD) datasets. These datasets were chosen for their provision of matched patient and control samples for each disease, employing comparable microarray platforms to enable robust comparative analysis. The current approach involved identifying common DEGs (C-DEGs), conducting functional enrichment and protein interaction analyses, evaluating associations with immune infiltration, and predicting interacting drugs. Additionally, preliminary experimental validation was performed. This work provides novel insights and candidate targets for understanding the comorbidity of T2DM and ASCVD.
Protocol
This study protocol was reviewed and approved by Ningxia Medical University Institutional Review Board for ethics (Internal Review Board Reference Number: Ethics [2023]-YCSKT-002) and conformed to the principles outlined in the Declaration of Helsinki. Written consent was obtained from all patients involved in the study prior to their participation.
Sources of expression data for T2DM and ASCVD
Gene expression data for T2DM and ASCVD were obtained from the GSE78721 and GSE12288 datasets, respectively, sourced from the GEO database. Both datasets utilized microarray data from the [PrimeView] Affymetrix Human Gene Expression Array and the [HG-U133A] Affymetrix Human Genome U133A Array platforms. The GSE78721 dataset included expression data from 68 T2DM patients and 62 normal samples (details in Supplementary Table 1), while the GSE12288 dataset comprised expression data from 110 ASCVD samples and 112 normal controls (details in Supplementary Table 2). Gene probes were converted to their corresponding gene symbols based on platform annotation information.
Identification of differentially expressed genes in T2DM and ASCVD
After downloading the data from the GEO database, raw expression matrices for T2DM and ASCVD were corrected and normalized using the "limma" software package to identify DEGs. A threshold of P < 0.05 was applied for DEG screening. Differential expression results were visualized using the 'heatmap' and 'ggplot2' R packages to generate a heatmap and a volcano plot, respectively. C-DEGs between T2DM and ASCVD were identified via a Venn diagram.
Gene Ontology (GO) functional and Kyoto Encyclopedia of Genes and Genomes (KEGG) pathway enrichment analyses of C-DEGs
Biological functions and pathways were determined through GO and KEGG pathway enrichment analyses. The R package org.Hs.eg.db was used to convert C-DEG names to gene IDs, and GO enrichment analysis was performed using the R packages clusterProfiler, enrichplot, ggplot2, and GOplot to explore common biological functions of the C-DEGs. Subsequently, KEGG analysis was conducted to identify shared significant pathways involved in the molecular mechanisms underlying the comorbidity of T2DM and ASCVD. GO and KEGG enrichment results were presented in bar charts illustrating gene counts, functional descriptions, and P values, with statistical significance defined as P < 0.05.
Protein-protein interaction (PPI) network analysis of C-DEGs
C-DEGs and hub genes were defined as shared genes in this study. To assess functional associations among these shared genes, a PPI network was constructed using the STRING database (https://string-db.org). The analysis commenced by selecting "Multiple proteins" under the "SEARCH" function and inputting the C-DEG names while specifying the species as "Homo sapiens." Basic parameters for the C-DEGs were configured to display the PPI regulatory network. Visualization of the PPI network was conducted using Cytoscape software (version 3.9.1) (https://apps.cytoscape.org/), providing a graphical representation of interactions among the C-DEGs. Hub C-DEGs were identified within the PPI network utilizing the CytoHubba plugin in Cytoscape, based on the Degree ranking algorithm.
Immune cell infiltration analysis
To examine the differences in immune cell infiltration between the T2DM group and the normal control group, the CIBERSORT method was employed to assess the abundance of various immune-infiltrating cell types. The Wilcoxon test algorithm was subsequently applied to compare the proportions of these infiltrating immune cells between T2DM and control samples, facilitating the evaluation of observed differences. Visualization of the data was achieved through violin plots. To validate the correlation between C-DEGs and immune-infiltrating cells, R packages such as limma, scales, tidyverse, and ggplot2 were utilized to calculate Spearman correlation coefficients. This step quantified the relationship between C-DEG expression and immune cell infiltration levels, with results displayed as heatmaps. A P-value of less than 0.05 was considered statistically significant.
Interaction analysis of hub C-DEGs with potential targeted drugs
The Drug-Gene Interaction Database (DGIdb) provides a comprehensive catalog of drug-gene interactions and genetic profiles of approved and potential therapeutic agents. In this study, the list of hub C-DEGs was input into the database to retrieve interaction information between the hub C-DEGs and their potential targeted drugs, which was then visualized using Cytoscape software.
Experimental validation of core genes by clinical samples
To experimentally validate the core genes, peripheral blood samples were collected from clinical subjects. The study cohort included an experimental group and a control group. The experimental group consisted of 15 patients diagnosed with both T2DM and ASCVD, representing a comorbid condition. The control group comprised 10 age- and sex-matched healthy volunteers without a history of diabetes, CVDs, or other major systemic illnesses. All patients in the experimental group were definitively diagnosed following established clinical guidelines for T2DM and ASCVD.
Quantitative real-time polymerase chain reaction (qRT-PCR)
Total RNA was isolated using TRIzol reagent, and first-strand cDNA was synthesized with a Reverse Transcription System Kit. The cDNA was then diluted for qRT-PCR using SYBR-green PCR Master Mix, with GAPDH serving as an internal control. Relative fold changes in expression were calculated via the 2−ΔΔCt method. The primers used for the analysis were as follows: TUBA1C-forward: 5′-GACCTCGTGTTGGACCGAAT-3′ and reverse: 5′-CGAGGTGAACCCAGAACCAG-3′; NCF4-forward: 5′-CTAAGTTTCAAAGCTGGAGATGTG-3′ and reverse: 5′-GAATTCCTGAAAGGGCTCCTG-3′; PRF1-forward: 5′-CCCAGTGGACACACAAAGGTT-3′ and reverse: 5′-TCGTTGCGGATGCTACGAG-3′; SLPI-forward: 5′-CCCTTCCTGGTGCTGCTT-3′ and reverse: 5′-CCTCCTTGTTGGGTTTGG-3′; HSP90B1-forward: 5′-CCGAAGAAGAACCTGAAGAG-3′ and reverse: 5′-CATCTGTTCCCACATCCATT-3′; PLAU-forward: 5′-GGGGAGATGAAGTTTGAGGTG-3′ and reverse: 5′-GCAATGTCGTTGTGGTGAGC-3′; GAPDH-forward: 5′-CAGGGCTGCTTTTAACTCTGG-3′ and reverse: 5′-GGGTGGAATCATATTGGAACA-3′.
Western blot assay
Total protein was isolated, diluted in loading buffer, and separated by 10% SDS-PAGE, followed by transfer to PVDF membranes. The membranes were blocked and probed with specific primary antibodies, including anti-TUBA1C (1:1000, ab222849), anti-HSP90B1 (1:1000, ab238126), anti-NCF4 (1:1000, 14648-1-AP), anti-PRF1 (1:1000, ab256453), anti-SLPI (1:1000, ab46763), anti-PLAU (1:1000, 17968-1-AP), and anti-GAPDH (1:5000, 10494-1-AP). Secondary antibodies conjugated with horseradish peroxidase (HRP) (1:2000, ab6721) were applied, and bands were visualized using enhanced chemiluminescent (ECL) substrate.
Statistical analysis
Statistical analysis was performed using GraphPad Prism Software, with data presented as mean ± SD. Differences between groups were assessed using Student's t-test, and a P-value of less than 0.05 was considered statistically significant.
Results
Identification of DEGs
Two datasets, GSE78721 and GSE12288, were utilized for bioinformatics analysis in this study. In GSE78721, a total of 2,266 DEGs were identified between T2DM patients and normal samples, comprising 1,209 upregulated and 1,057 downregulated genes (Figure 1A). In GSE12288, 924 DEGs were verified between ASCVD patients and controls, including 403 genes that were overexpressed and 521 that were downregulated (Figure 1C). The top 50 DEGs identified in both datasets are represented in heat maps shown in Figure 1B,D. By intersecting these two datasets, 32 C-DEGs were identified, consisting of 20 upregulated and 12 downregulated genes (Figure 2A,B).
GO and KEGG enrichment of the C-DEGs
To elucidate the biological functions and key pathways associated with the 32 C-DEGs, GO and KEGG analyses were performed. The top ten terms related to biological process (BP), cellular component (CC), and molecular function (MF) among the C-DEGs are presented in Figure 3A. The BP functions predominantly include regulation of plasminogen activation, regulation of fibrinolysis, positive regulation of cardiocyte differentiation, negative regulation of protein binding, and cardioblast differentiation. The CC functions pertain to the serine-type endopeptidase complex, protein complexes involved in cell-matrix adhesion, condensed chromosome, specific granule membrane, and PML body. The MF encompasses structural constituents of the cytoskeleton, superoxide-generating NADPH oxidase activator activity, intramolecular transferase activity (phosphotransferases), serine-type exopeptidase activity, and IgG binding (Figure 3A). In terms of KEGG analysis, the C-DEGs were primarily involved in critical pathways, including viral myocarditis, arrhythmogenic right ventricular cardiomyopathy, complement and coagulation cascades, prostate cancer, hypertrophic cardiomyopathy, dilated cardiomyopathy, apoptosis, phagosome, and protein processing in the endoplasmic reticulum (Figure 3B).
Construction of PPI networks and hub gene screening
Among the 32 C-DEGs, three genes exhibited no known interactions with other C-DEGs in the STRING database and were therefore excluded from the PPI network construction. The STRING platform was employed for PPI analysis of the remaining 29 C-DEGs, revealing a network consisting of 29 nodes and 39 edges, which was visualized using Cytoscape (Figure 4A). Subsequently, eight hub C-DEGs (HSP90B1, PLAU, SLPI, TOP3A, NCF4, PRF1, TUBA1C, and CS) were identified based on their connectivity degree (Figure 4B).
Differences in immune cell infiltration and their correlation with hub C-DEGs
This analysis focused exclusively on the T2DM dataset (GSE78721) to preliminarily investigate changes in the immune microenvironment in the context of T2DM and their relationship with hub genes. Violin plots were utilized to visualize the relationship between the T2DM dataset and the infiltration levels of 22 immune cell types (Figure 5A; details in Supplementary Table 3). The immune cell infiltration analysis indicated a higher proportion of activated dendritic cells in the T2DM group compared to the control group (P = 0.049), while the proportion of resting dendritic cells was significantly lower in the T2DM group (P = 0.023). Furthermore, the relationship between the expression levels of the eight hub C-DEGs and the infiltration levels of the 22 different immune cell types was visualized using a heatmap (Figure 5B). Notably, TOP3A expression exhibited a strong positive correlation with the infiltration level of regulatory T cells (Tregs) (P < 0.001), while SLPI expression was strongly positively correlated with gamma delta T cell infiltration (P < 0.001). Conversely, NCF4 expression showed a strong negative correlation with the infiltration level of activated NK cells (P < 0.001), PRF1 expression was strongly negatively correlated with the infiltration level of M2 macrophages (P < 0.001), and PLAU expression was strongly negatively related to the infiltration level of naive B cells (P < 0.001).
Candidate drug-target network for hub C-DEGs
Among the eight identified hub C-DEGs, CS and TOP3A were not listed as known drug targets in the DGIdb database and were thus excluded from the subsequent candidate drug-target network analysis. To identify drugs with potential therapeutic roles in T2DM and ASCVD, the remaining six hub C-DEGs were submitted to the DGIdb database (details in Supplementary Table 4). Subsequently, Cytoscape was employed to construct a candidate drug-target network illustrating the associations between hub C-DEGs and candidate targeted drugs (Figure 6). This network comprised six hub C-DEGs, 136 molecular drugs, and 137 edges. Specifically, 82, 5, 3, 4, 1, and 42 candidate target drugs were identified for TUBA1C, NCF4, PRF1, SLPI, HSP90B1, and PLAU, respectively, with the majority classified as antineoplastic agents, anti-inflammatory agents, and antithrombotic agents.
Validation of hub C-DEGs expression
Due to the absence of CS and TOP3A as candidate drug targets in the DGIdb database and their biological functions being less directly related to therapeutic strategies in the context of T2DM and ASCVD research, the study focused on the remaining six hub C-DEGs (HSP90B1, PLAU, SLPI, NCF4, PRF1, and TUBA1C) for experimental validation. To further explore the roles of these hub C-DEGs, qRT-PCR and western blot assays were conducted to assess the expression levels of core genes across different groups (Figure 7 and Figure 8). The expression levels of TUBA1C, NCF4, SLPI, HSP90B1, and PLAU were significantly upregulated in patients with T2DM and ASCVD compared to corresponding healthy control groups, while PRF1 expression was downregulated. These findings suggest that these core genes may play a significant role in the progression of patients with T2DM and ASCVD.
DATA AVAILABILITY:The gene expression datasets GSE78721 and GSE12288 used for bioinformatics analysis in this study are available from the public NCBI GEO database. The raw data from the experimental validation part generated in this study are provided in Supplementary File 1.
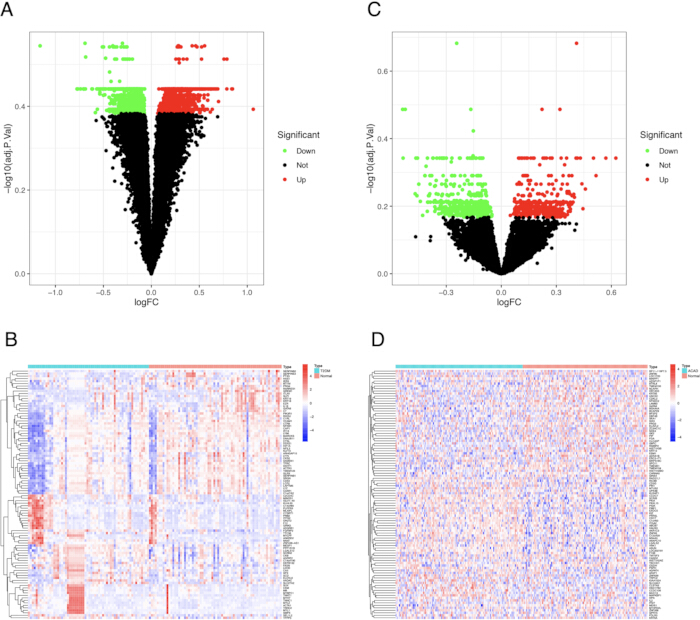
Figure 1: Identification of DEGs in the datasets GSE78721 and GSE12288. (A,C) The volcano plots of DEGs in GSE78721 and GSE12288, respectively. |logFC|≥ 0.5 and P < 0.05 were established as the screening threshold; the upregulated genes were marked as red, and the downregulated genes were marked as green. (B,D) Heatmaps of the top 50 DEGs in GSE78721 and GSE12288, respectively. Please click here to view a larger version of this figure.
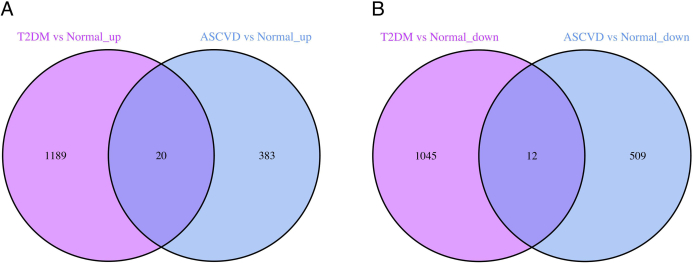
Figure 2: Venn diagram of C-DEGs from two datasets. (A) Venn diagram of upregulated C-DEGs from T2DM and ASCVD in GSE78721 and GSE12288 datasets. (B) Venn diagram of downregulated C-DEGs from T2DM and ASCVD in GSE78721 and GSE12288 datasets. Please click here to view a larger version of this figure.
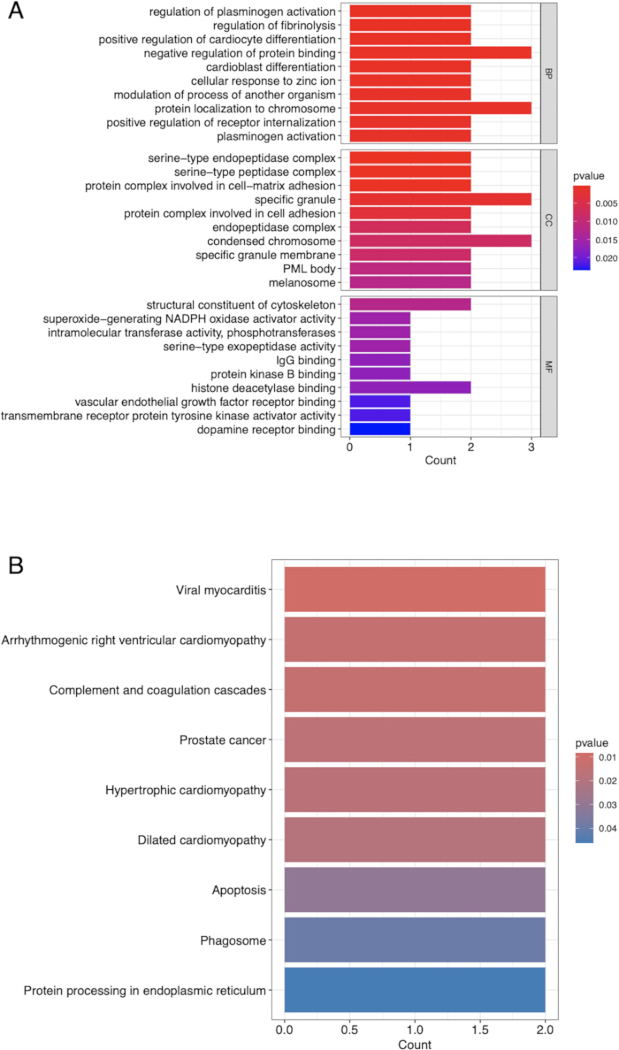
Figure 3: Functional and pathway enrichment analysis of C-DEGs. Bar graphs of GO (A) and KEGG (B) enrichment analyses. Vertical coordinates indicate the description of different GO items or KEGG pathways, and horizontal coordinates indicate the number of enriched C-DEGs. Please click here to view a larger version of this figure.
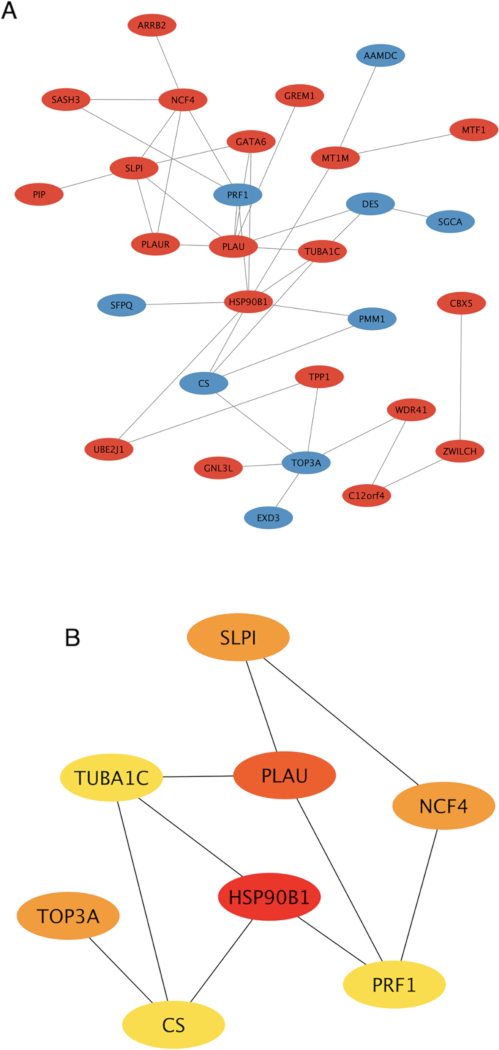
Figure 4: PPI network and hub gene screening of C-DEGs. (A) The PPI network of C-DEGs. Red and blue represent the upregulated and downregulated C-DEGs, respectively. (B) Eight hub genes were identified among the C-DEGs. Nodes represent a C-DEG, and edges represent the interaction between C-DEGs. Please click here to view a larger version of this figure.
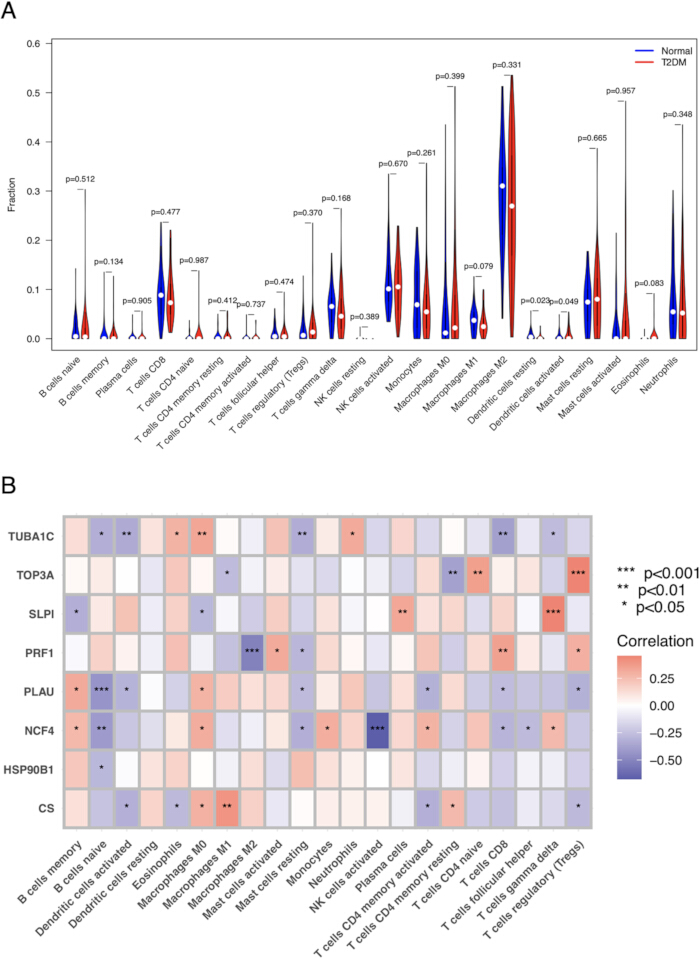
Figure 5: Immune cell infiltration analysis. (A) Differences in the infiltration of 22 immune cell types between the T2DM group and the control group. Horizontal axis: immune cell subtypes; Vertical axis: relative infiltration level of immune cells. (B) Correlation heatmap of the expression of 8 hub C-DEGs and the infiltration levels of 22 immune cell types. Red squares: positive correlation; Blue squares: negative correlation. Darker colors indicate stronger correlations. Please click here to view a larger version of this figure.
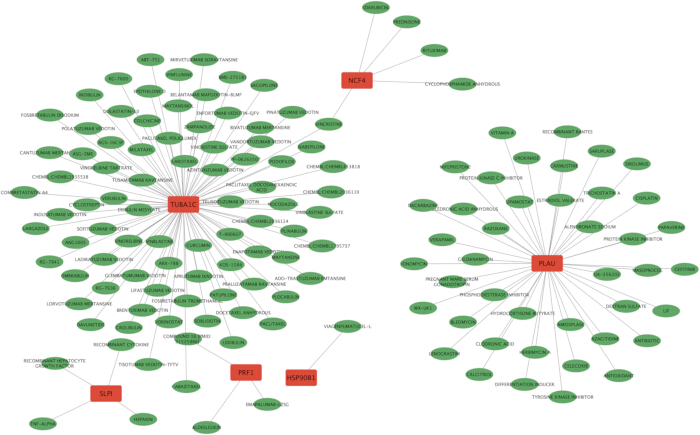
Figure 6: Candidate drug-target network for six hub C-DEGs. Red nodes represent hub C-DEGs, green nodes represent candidate targeted drugs, and the edges between them represent interaction pairs. Please click here to view a larger version of this figure.
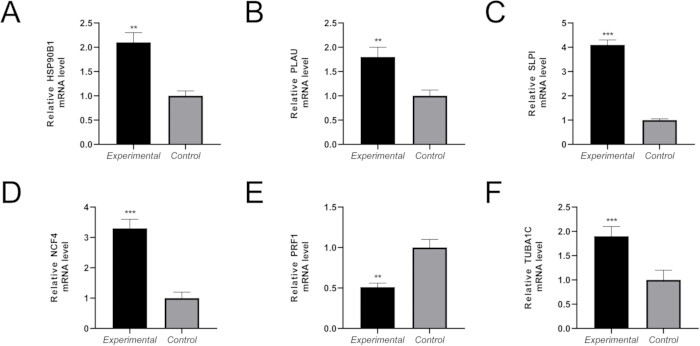
Figure 7: Validation of core gene expression in the patients with T2DM and ASCVD by qRT-PCR. The mRNA expression levels of HSP90B1 (A), PLAU (B), SLPI (C), NCF4 (D), PRF1 (E), and TUBA1C (F) were detected by qRT-PCR. Please click here to view a larger version of this figure.
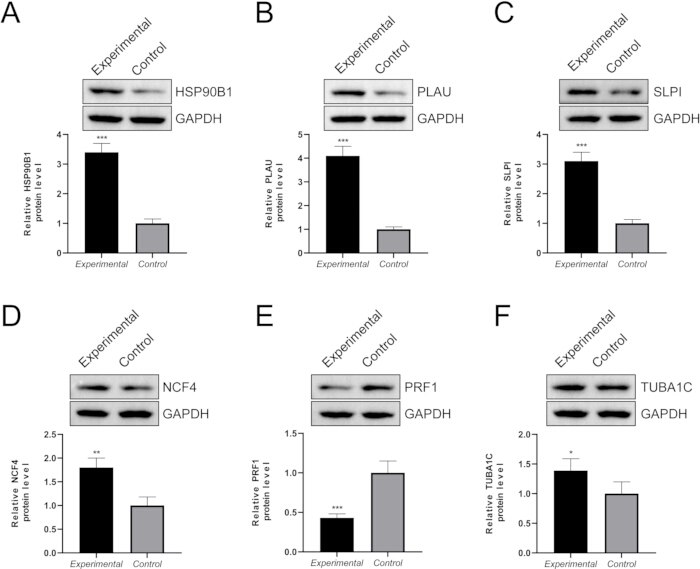
Figure 8: Validation of core gene expression in patients with T2DM and ASCVD by Western blot. The protein expression levels of HSP90B1 (A), PLAU (B), SLPI (C), NCF4 (D), PRF1 (E), and TUBA1C (F) were detected by Western blot assays. Please click here to view a larger version of this figure.
Supplementary Table 1. Gene expression matrix for the GSE78721 dataset, used for the T2DM transcriptomic analysis in this study.Please click here to download this file.
Supplementary Table 2. Gene expression matrix for the GSE12288 dataset, used for the ASCVD transcriptomic analysis in this study.Please click here to download this file.
Supplementary Table 3: Immune cell infiltration analysis in the GSE78721 dataset.Please click here to download this file.
Supplementary Table 4: Candidate drug-target interactions for hub common differentially expressed genes.Please click here to download this file.
Supplementary File 1: The raw data from the experimental validation part generated in this study.Please click here to download this file.
Discussion
T2DM and ASCVD are complex diseases, with emerging evidence suggesting a significant association between the two. Insulin resistance serves as a pivotal precursor to various cardiovascular metabolic abnormalities, including T2DM, which collectively contribute to the development of ASCVD and may impact its prognosis6,7. Additionally, DM is a driving factor in the progression of atherosclerosis20. Individuals with T2DM face an enhanced risk of CAD21, yet questions linger regarding the underlying mechanisms of comorbidity. This study aims to explore the relationship and mechanisms linking these two diseases, alongside identifying potential biomarkers through bioinformatics analysis and experimental validation.
In this study, a total of 32 C-DEGs were identified between T2DM and ASCVD, comprising 20 upregulated and 12 downregulated genes. GO and KEGG enrichment analyses revealed that these C-DEGs were predominantly enriched in critical metabolic pathways closely related to both CAD and T2DM22,23. Eight hub C-DEGs (HSP90B1, PLAU, SLPI, TOP3A, NCF4, PRF1, TUBA1C, and CS) were screened across the two conditions. Notably, hub C-DEGs (TOP3A, SLPI, NCF4, PRF1, and PLAU) were significantly associated with the infiltration levels of immune cells. HSP90B1 has been implicated in cancer progression24 and may also have associations with T2DM25. PLAU has been shown to play a role in preventing premature vascular aging associated with T2DM26 and is critical in the progression of atherosclerotic plaque, providing insights for early warning biomarkers and elucidating mechanisms underlying CAD progression27. The expression of SLPI increases with progressive metabolic dysfunction28 and has been identified as a C-DEG associated with impaired glucose tolerance and T2DM29. NCF4 has established links to CAD30 and contributes to the regulation of NADPH oxidase activity and inflammasome activation31. Due to the key role of PRF1 in immune monitoring and regulation32, it holds diagnostic potential, distinguishing between myocardial infarction and stable CAD33. Furthermore, PRF1 acts as a critical immune regulatory player in obesity-related insulin resistance34. TUBA1C has also been associated with cancers and is linked to immune infiltration within the tumor microenvironment35. It has been identified as a susceptibility gene for coronary heart disease36. However, the relationship between ASCVD and T2DM remains underexplored.
KEGG analysis revealed the involvement of these candidate genes in pathways such as "Complement and Coagulation Cascades" and "Protein Processing in Endoplasmic Reticulum." Experimental validation of key genes within these pathways, specifically PLAU (a serine protease involved in fibrinolysis and coagulation) and HSP90B1 (an endoplasmic reticulum chaperone), confirmed their dysregulation in our T2DM model. These findings situate our research within a specific molecular framework, suggesting that imbalances in the endoplasmic reticulum stress response and thrombolytic pathways may be integral to diabetic pathology, extending beyond the widely recognized inflammatory processes.
Extensive research has documented dysfunctional immune responses in diabetic patients37. Abnormal immune cell activation plays a pivotal role in the progression of T2DM38,39. Immune infiltration analysis revealed a significant alteration in the dendritic cell compartment in T2DM, characterized by an increased proportion of activated dendritic cells and a decreased proportion of resting dendritic cells (Figure 5A). This indicates a state of enhanced antigen presentation and immune activation in T2DM, potentially contributing to chronic inflammatory damage in target tissues. Furthermore, strong correlations observed between specific hub genes (e.g., NCF4 with activated NK cells, PRF1 with M2 macrophages) (Figure 5B) suggest mechanistic links between gene expression in metabolic tissues and the local immune microenvironment composition, thereby identifying new targets for immunomodulatory interventions.
Additionally, a drug-target network analysis was performed to predict potential therapeutic targets, underlying mechanisms, and drugs for T2DM and ASCVD. This candidate drug-target network encompassed six hub C-DEGs, 136 molecular drugs, and 137 edges. The analysis yielded 82, 5, 3, 4, 1, and 42 candidate target drugs for TUBA1C, NCF4, PRF1, SLPI, HSP90B1, and PLAU, respectively. The majority of these drugs are classified as antineoplastic agents, anti-inflammatory agents, and antithrombotic agents. Notably, some drugs, including Rituximab, Prednisone, Antioxidants, Verapamil, Antibiotics, Colchicine, and Heparin, have demonstrated therapeutic functions in both T2DM15,40,41,42,43,44,45,46 and CAD15,47,48,49,50,51,52,53,54,55, indicating their potential therapeutic effects in patients with T2DM and CAD. Furthermore, several drugs such as Alendronate sodium, Calcitriol, Celecoxib, Masoprocol, Mifepristone, and Curcumin have been shown to exhibit therapeutic functions specifically in T2DM56,57,58,59,60,61,62,63, which may also be beneficial for ASCVD. Validation of the expression of these hub C-DEGs in T2DM and ASCVD was also conducted.
This study has several limitations. First, the clinical sample sizes within the validation experiment were insufficient and should be expanded. Second, further experimental research is necessary to provide valuable insights into the linkage between T2DM and ASCVD. Future work will involve validating the results with larger clinical cohorts and conducting more comprehensive experimental studies to elucidate the molecular mechanisms and pathological pathways connecting these two diseases. In the experimental validation section, samples from T2DM and ASCVD patients were pooled into a single "experimental group" for comparison with healthy controls. While this design facilitated the validation of overall expression changes in the identified core C-DEGs in the comorbid condition, it does not differentiate whether these expression alterations are specific to T2DM, ASCVD, or shared by both. Subsequent studies should compare distinct groups of T2DM patients, ASCVD patients, and individuals with T2DM comorbid with ASCVD to more accurately delineate the specific roles of these genes in individual diseases versus the comorbid state. Moreover, the immune cell infiltration analysis was conducted exclusively on the T2DM dataset (GSE78721) and not performed in parallel for the ASCVD dataset (GSE12288). Thus, the reported correlations between hub C-DEGs and immune cell infiltration levels (e.g., TOP3A with Tregs, SLPI with gamma delta T cells) reflect only their potential immunomodulatory roles within the pathological context of T2DM. Another limitation is the absence of functional validation for the predicted drug-target interactions. Future investigations should incorporate molecular docking simulations to assess binding affinity, along with in vivo experiments using animal models to evaluate the therapeutic efficacy of these candidate drugs.
In conclusion, this integrated bioinformatics analysis, supplemented by preliminary experimental validation, identified several shared hub genes and pathways between T2DM and ASCVD and proposes potential drug candidates targeting these genes. These findings offer novel hypotheses and candidate targets for further mechanistic and therapeutic exploration of the complex interplay between T2DM and ASCVD.
Disclosures
The authors declare no competing interests.
Acknowledgements
The authors gratefully acknowledge the financial support provided by the Ningxia Natural Science Foundation Program (Grant No. 2023AAC03498) and the Yinchuan Science and Technology Innovation Project (Grant No. 2024SF005). The authors also thank all participants and researchers whose contributions made this study possible.
Materials
| Name | Company | Catalog Number | Comments |
|---|---|---|---|
| Anti-GAPDH | Proteintech | 60004-1-Ig | |
| Anti-HSP90B1 | Abcam | ab238126 | |
| Anti-NCF4 | Proteintech | 14648-1-AP | |
| Anti-PLAU | Proteintech | 17968-1-AP | |
| Anti-PRF1 | Abcam | ab256453 | |
| Anti-SLPI | Abcam | ab46763 | |
| Anti-TUBA1C | Abcam | ab222849 | |
| CIBERSORT | Stanford University | https://cibersortx.stanford.edu | |
| clusterProfiler (R package) | Bioconductor | http://www.bioconductor.org/packages/release/bioc/html/clusterProfiler.html | |
| CytoHubba (Cytoscape plugin) | Cytoscape Consortium | https://apps.cytoscape.org | |
| Cytoscape (version 3.9.1) | Cytoscape Consortium | http://cytoscape.org/ | |
| DGIdb (Drug-Gene Interaction Database) | Washington University | http://www.dgidb.org/ | |
| Enhanced chemiluminescent (ECL) substrate | Thermo Fisher Scientific | 34080 | |
| enrichplot (R package) | Bioconductor | http://bioconductor.org/packages/release/bioc/html/enrichplot.html | |
| Gel imaging system | Bio-Rad | ChemiDox XRS | |
| GEO Database (Datasets: GSE78721, GSE12288) | NCBI | https://www.ncbi.nlm.nih.gov/geo/ | |
| ggplot2 (R package) | CRAN | https://ggplot2.tidyverse.org | |
| GOplot (R package) | CRAN | https://cran.r-project.org/web/packages/GOplot/index.html | |
| GraphPad Prism(version 9.1.2) | GraphPad Software | https://www.graphpad.com/scientific-software/prism/ | |
| limma (R package) | Bioconductor | http://bioconductor.org/packages/release/bioc/html/limma.html | |
| loading buffer | Bio-Rad | 1610737 | |
| org.Hs.eg.db (R package) | Bioconductor | https://bioconductor.org/packages/release/data/annotation/html/org.Hs.eg.db.htm | |
| PVDF membrane | Bio-Rad | 1620177 | |
| R software (version 4.0.2) | R Foundation | https://www.r-project.org/ | |
| Real-time PCR system | Bio-Rad | CFX-96 | |
| Reverse Transcription System Kit | Takara | D6110A | |
| scales (R package) | CRAN | https://CRAN.R-project.org/package = scales | |
| SDS-PAGE Gels | Bio-Rad | 4561085 | |
| Secondary antibody | Abcam | ab6721 | |
| STRING databas | STRING Consortium | https://string-db.org/ | |
| SYBR-green PCR Master Mix | Vazyme Biotech | Cat #Q311-02 | |
| tidyverse (R package) | CRAN | https://cran.r-project.org/web/packages/tidyverse/index.html | |
| Trans-Blot transfer system | Bio-Rad | 1704150 | |
| TRIzol reagent | Thermo Fisher Scientific | #1559602 |
References
- Artasensi A, Pedretti A. Type 2 diabetes mellitus: a review of multi-target drugs. Molecules. 2020;25(8):1986.
- Saeedi P, Petersohn I, Salpea P, Malanda B, Karuranga S, Unwin N, et al. Global and regional diabetes prevalence estimates for 2019 and projections for 2030 and 2045: results from the International Diabetes Federation Diabetes Atlas, 9th edition. Diabetes Res Clin Pract. 2019;157:107843.
- Chatterjee S, Khunti K, Davies MJ. Type 2 diabetes. Lancet. 2017;389(10085):2239-2251.
- Wu J, Yang K, Fan H, Wei M, Xiong Q. Targeting the gut microbiota and its metabolites for type 2 diabetes mellitus. Front Endocrinol (Lausanne). 2023;14:1114424.
- Holman N, Young B, Gadsby R. Current prevalence of Type 1 and Type 2 diabetes in adults and children in the UK. Diabet Med. 2015;32(9):1119-1120.
- Mancusi C, de Simone G. Myocardial mechano-energetic efficiency and insulin resistance in non-diabetic members of the Strong Heart Study cohort. Cardiovasc Diabetol. 2019;18(1):56.
- Hill MA, Yang Y, Zhang L, Sun Z, Jia G, Parrish AR, et al. Insulin resistance, cardiovascular stiffening and cardiovascular disease. Metabolism. 2021;119:154766.
- Trigka M, Dritsas E. Long-term coronary artery disease risk prediction with machine learning models. Bioengineering (Basel). 2023;23(3):1193.
- Nowbar AN, Gitto M, Howard JP, Francis DP, Al-Lamee R. Mortality from ischemic heart disease. Circ Cardiovasc Qual Outcomes. 2019;12(6):005375.
- Mensah GA, Roth GA, Fuster V. The global burden of cardiovascular diseases and risk factors: 2020 and beyond. J Am Coll Cardiol. 2019;74(20):2529-2532.
- Tian R, Liu H, Feng S, Wang H, Wang Y, Wang Y, et al. Gut microbiota dysbiosis in stable coronary artery disease combined with type 2 diabetes mellitus influences cardiovascular prognosis. Nutr Metab Cardiovasc Dis. 2021;31(5):1454-1466.
- Ma CX, Ma XN, Guan CH, Li YD, Mauricio D, Fu SB. Cardiovascular disease in type 2 diabetes mellitus: progress toward personalized management. Cardiovasc Diabetol. 2022;21(1):74.
- Mohammadnia N, Los J, Opstal TSJ, Fiolet ATL, Eikelboom JW, Mosterd A, et al. Colchicine and diabetes in patients with chronic coronary artery disease: insights from the LoDoCo2 randomized controlled trial. Front Cardiovasc Med. 2023;10:1244529.
- Einarson TR, Acs A, Ludwig C, Panton UH. Prevalence of cardiovascular disease in type 2 diabetes: a systematic literature review of scientific evidence from across the world in 2007-2017. Cardiovasc Diabetol. 2018;17(1):83.
- Huang J, Li N, Li Z, Hou XJ, Li ZZ. Low-dose unfractionated heparin with sequential enoxaparin in patients with diabetes mellitus and complex coronary artery disease during elective percutaneous coronary intervention. Chin Med J (Engl). 2018;131(7):764-769.
- Knuuti J, Wijns W, Saraste A, Capodanno D, Barbato E, Funck-Brentano C, et al. 2019 ESC Guidelines for the diagnosis and management of chronic coronary syndromes. Eur Heart J. 2020;41(3):407-477.
- Song S, Yu J. Identification of the shared genes in type 2 diabetes mellitus and osteoarthritis and the role of quercetin. J Cell Mol Med. 2024;28(4):18127.
- Castillo-Velázquez R, Martínez-Morales F, Castañeda-Delgado JE, García-Hernández MH, Herrera-Mayorga V, Paredes-Sánchez FA, et al. Bioinformatic prediction of the molecular links between Alzheimer's disease and diabetes mellitus. PeerJ. 2023;11:14738.
- Zhang J, Zhang FJ, Zhang L, Xian DX, Wang SA, Peng M, et al. Identification of key genes and molecular pathways in type 2 diabetes mellitus and polycystic ovary syndrome via bioinformatics analyses. Eur Rev Med Pharmacol Sci. 2023;27(8):3255-3269.
- Sun H, Ma X, Ma H, Li S, Xia Y, Yao L, et al. High glucose levels accelerate atherosclerosis via NLRP3-IL/MAPK/NF-κB-related inflammation pathways. Biochem Biophys Res Commun. 2024;704:149702.
- Hasbani NR, Westerman KE. Type 2 diabetes modifies the association of CAD genomic risk variants with subclinical atherosclerosis. Circ Genom Precis Med. 2023;16(6):004176.
- Vernon ST, Tang O, Kim T, et al. Metabolic signatures in coronary artery disease: results from the BioHEART-CT study. J Am Heart Assoc. 2021;10(5):019852.
- Colosimo S, Mitra SK, Chaudhury T, Marchesini G. Insulin resistance and metabolic flexibility as drivers of liver and cardiac disease in T2DM. Diabetes Res Clin Pract. 2023;206:111016.
- Huang X, Zhang W, Yang N, Zhang Y, Qin T, Ruan H, et al. Identification of HSP90B1 in pan-cancer hallmarks to aid development of a potential therapeutic target. Mol Cancer. 2024;23(1):19.
- Sims-Robinson C, Zhao S, Hur J, Feldman EL. Central nervous system endoplasmic reticulum stress in a murine model of type 2 diabetes. Diabetologia. 2012;55(8):2276-2284.
- Wan Y, Liu Z, Wu A, Khan AH. Hyperglycemia promotes endothelial cell senescence through AQR/PLAU signaling axis. Int J Mol Sci. 2022;23(5):2677.
- Song C, Qiao Z, Chen L, Ge J, Zhang R, Yuan S, et al. Identification of key genes as early warning signals of acute myocardial infarction based on weighted gene correlation network analysis and dynamic network biomarker algorithm. Front Immunol. 2022;13:879657.
- López-Bermejo A, Ortega FJ, Castro A, Ricart W, Fernández-Real JM. The alarm secretory leukocyte protease inhibitor increases with progressive metabolic dysfunction. Clin Chim Acta. 2011;412(11-12):1122-1126.
- Songtao Y, Fangyu L, Jie C, Li Y. Identification of claudin-2 as a promising biomarker for early diagnosis of pre-diabetes. Front Pharmacol. 2024;15:1370708.
- Wang Y, Liu T, Liu Y, Chen J, Xin B, Wu M, et al. Coronary artery disease associated specific modules and feature genes revealed by integrative methods of WGCNA, MetaDE and machine learning. Gene. 2019;710:122-130.
- Li L, Mao R, Yuan S, Xie Q, Meng J, Gu Y, et al. NCF4 attenuates colorectal cancer progression by modulating inflammasome activation and immune surveillance. 2024;15(1):5170.
- Chen J, Yu L, Zhang S, Chen X. Network analysis-based approach for exploring the potential diagnostic biomarkers of acute myocardial infarction. Front Physiol. 2016;7:615.
- Zhang L, Wang Q, Xie X. Identification of biomarkers related to immune cell infiltration with gene coexpression network in myocardial infarction. Dis Markers. 2021;2021:2227067.
- Revelo XS, Tsai S, Lei H, Luck H, Ghazarian M, Tsui H, et al. Perforin is a novel immune regulator of obesity-related insulin resistance. Diabetes. 2015;64(1):90-103.
- Zou Y, Wang G. Comprehensive multiomic analysis identified TUBA1C as a potential prognostic biological marker of immune-related therapy in pan-cancer. 2022;2022:9493115.
- Yan X, Huang Y, Wu J. Identify cross talk between circadian rhythm and coronary heart disease by multiple correlation analysis. J Comput Biol. 2018;25(12):1312-1327.
- Rubinstein MR, Genaro AM, Wald MR. Differential effect of hyperglycaemia on the immune response in an experimental model of diabetes in BALB/cByJ and C57BL/6J mice: participation of oxidative stress. Clin Exp Immunol. 2013;171(3):319-329.
- Donath MY, Shoelson SE. Type 2 diabetes as an inflammatory disease. Nat Rev Immunol. 2011;11(2):98-107.
- Zhou J, Zhang X, Ji L. Identification of potential biomarkers of type 2 diabetes mellitus-related immune infiltration using weighted gene coexpression network analysis. 2022;2022:9920744.
- Su Z, Ma C, Zhao R, Jiang Y, Cai Y, Yong G, et al. Heterogeneity of circulating CXCR5−PD-1hi Tph cells in patients with type 2 and type 1 diabetes in the Chinese population. 2023;60(6):767-776.
- Banerjee M, Vats P. Reactive metabolites and antioxidant gene polymorphisms in type 2 diabetes mellitus. Redox Biol. 2014;2:170-177.
- Leh HE, Lee LK. Lycopene: a potent antioxidant for the amelioration of type II diabetes mellitus. 2022;27(7):2335.
- Wu X, Gong H, Hu X, Shi P, Cen H, Li C. Effect of verapamil on bone mass, microstructure and mechanical properties in type 2 diabetes mellitus rats. BMC Musculoskelet Disord. 2022;23(1):363.
- Chen YS, Weng SJ, Chang SH. Evaluating the antidiabetic effects of R-verapamil in type 1 and type 2 diabetes mellitus mouse models. PLoS One. 2021;16(8):e0255405.
- Chu L, Su D, Wang H. Association between antibiotic exposure and type 2 diabetes mellitus in middle-aged and older adults. 2023;15(5):1290.
- Guan J, Abudouaini H, Lin K, Yang K. Emerging insights into the role of IL-1 inhibitors and colchicine for inflammation control in type 2 diabetes. Diabetol Metab Syndr. 2024;16(1):140.
- Armitage JD, Montero C, Benner A, Armitage JO, Bociek G. Acute coronary syndromes complicating the first infusion of rituximab. Clin Lymphoma Myeloma. 2008;8(4):253-255.
- Ribichini F, Joner M, Ferrero V, Finn AV, Crimins J, Nakazawa G, et al. Effects of oral prednisone after stenting in a rabbit model of established atherosclerosis. J Am Coll Cardiol. 2007;50(2):176-185.
- Bastani A, Rajabi S, Daliran A, Saadat H, Karimi-Busheri F. Oxidant and antioxidant status in coronary artery disease. Biomed Rep. 2018;9(4):327-332.
- Sotoudeh Anvari M, Mortazavian Babaki M, Boroumand MA, Eslami B, Jalali A, Goodarzynejad H. Relationship between calculated total antioxidant status and atherosclerotic coronary artery disease. Anatol J Cardiol. 2016;16(9):689-695.
- Winniford MD, Jansen DE, Reynolds GA, Apprill P, Black WH, Hillis LD. Cigarette smoking-induced coronary vasoconstriction in atherosclerotic coronary artery disease and prevention by calcium antagonists and nitroglycerin. Am J Cardiol. 1987;59(4):203-207.
- Muhlestein JB. Antibiotic treatment of atherosclerosis. Curr Opin Lipidol. 2003;14(6):605-614.
- Nelson K, Fuster V, Ridker PM. Low-dose colchicine for secondary prevention of coronary artery disease: JACC review topic of the week. J Am Coll Cardiol. 2023;82(7):648-660.
- Fiolet ATL, Nidorf SM, Mosterd A, Cornel JH. Colchicine in stable coronary artery disease. Clin Ther. 2019;41(1):30-40.
- Aimo A, Pascual-Figal DA, Barison A, Cediel G, Vicente ÁH, Saccaro LF, et al. Colchicine for the treatment of coronary artery disease. Trends Cardiovasc Med. 2021;31(8):497-504.
- Ikeda T, Manabe H, Iwata K. Clinical significance of alendronate in postmenopausal type 2 diabetes mellitus. Diabetes Metab. 2004;30(4):355-358.
- Wang Y, Huang M, Xu W, Li F, Ma C, Tang X. Calcitriol-enhanced autophagy in gingival epithelium attenuates periodontal inflammation in rats with type 2 diabetes mellitus. Front Endocrinol (Lausanne). 2022;13:1051374.
- Cheng S, So WY, Zhang D, Cheng Q, Boucher BJ, Leung PS. Calcitriol reduces hepatic triglyceride accumulation and glucose output through Ca2+/CaMKKβ/AMPK activation under insulin-resistant conditions in type 2 diabetes mellitus. Curr Mol Med. 2016;16(8):747-758.
- Tian F, Zhang YJ, Li Y, Xie Y. Celecoxib ameliorates non-alcoholic steatohepatitis in type 2 diabetic rats via suppression of the non-canonical Wnt signaling pathway expression. PLoS One. 2014;9(1):e83819.
- Reed MJ, Meszaros K, Entes LJ, Claypool MD, Pinkett JG, Brignetti D, et al. Effect of masoprocol on carbohydrate and lipid metabolism in a rat model of type II diabetes. Diabetologia. 1999;42(1):102-106.
- Fleseriu M, Biller BMK, Findling JW, Molitch ME, Schteingart DE, Gross C. Mifepristone, a glucocorticoid receptor antagonist, produces clinical and metabolic benefits in patients with Cushing's syndrome. J Clin Endocrinol Metab. 2012;97(6):2039-2049.
- Chuengsamarn S, Rattanamongkolgul S, Luechapudiporn R, Phisalaphong C, Jirawatnotai S. Curcumin extract for prevention of type 2 diabetes. Diabetes Care. 2012;35(11):2121-2127.
- Bozkurt O, Kocaadam-Bozkurt B. Effects of curcumin, a bioactive component of turmeric, on type 2 diabetes mellitus and its complications: an updated review. 2022;13(23):11999-12010.