Three-dimensional spheroid culture systems improve upon conventional 2D models for AAV gene therapy development. This methodology enables sensitive detection of AAV transduction at low doses, enhanced physiological relevance, and robust long-term monitoring. The platform supports potency assessment, high-throughput screening, and vector optimization across diverse cell lines and AAV serotypes.
Method Article
Evaluation of 3D Spheroids for AAV Transduction Studies
In This Article
Summary
Abstract
Adeno-associated viruses (AAVs) are potent vectors used for gene delivery in gene therapy products. Their development requires in vitro systems that can reliably detect differences in vector design, serotype performance, regulatory element strength, and expression kinetics. These systems must also support applications such as potency assessment and vector optimization. Here, we describe a streamlined three-dimensional spheroid platform optimized for evaluating AAV potency, transgene expression kinetics, and serotype-specific transduction efficacy across diverse cell lines. Uniform spheroids are generated using ultra-low attachment plates and maintained under conditions that support stable architecture and long-term imaging. Following AAV transduction, fluorescent or luminescent readouts are monitored in real time using live-cell imaging systems. This enables quantitative assessment of reporter signal, dose responsiveness, regulatory element activity, and onset time through continuous kinetic imaging. The platform effectively discriminates between potent and weak vector genome designs and among multiple AAV serotypes. This method demonstrates robust performance across both slowly and rapidly dividing cell lines. These results establish its utility as a scalable and physiologically relevant system for preclinical gene therapy evaluation and development.
Introduction
AAV vectors have become one of the preferred gene delivery systems for in vivo applications due to their safety profile and ability to achieve persistent gene expression1. AAV gene therapy is showing success in the treatment of multiple rare disease indications, with hundreds of products in the development pipeline2. Furthermore, emerging applications include in vivo delivery of genome editing components such as Cas9, with great potential to aid in treating hard-to-treat indications3. Key development challenges include high manufacturing costs and the limited predictive capacity of current in vitro assays for determining product quality and clinical efficacy4.
The advancement of AAV therapeutics is fundamentally limited by the lack of predictive, standardized activity assays that can accurately forecast clinical performance4,5. These assays are a critical component of the development pipeline, as they are used for multiple purposes, including screening libraries of engineered vectors, optimizing capsid modifications for enhanced targeting, and evaluating tissue-specific tropism. They also serve to characterize the influence of regulatory sequences on transgene expression6. Beyond candidate selection, AAV transduction assays also support critical manufacturing quality control through potency assays used for lot release, lot comparability studies, and stability assessments6,7.
The scientific challenge lies in developing assays that capture the complexity of vector-host interactions while maintaining practical feasibility for routine use7,8. Current approaches include utilizing immortalized cell lines that represent the target organ in traditional 2D monolayer cultures. These culture conditions lack physiological relevance and require high drug doses. This creates a significant gap between laboratory predictions and clinical translatability. Novel engineered cell lines, such as AAVR-overexpressing or CRISPR-activated systems, represent important advances but fail to recapitulate the three-dimensional architecture and extracellular matrix interactions characteristic of native tissues9,10,11. Next-generation models that better simulate in vivo microenvironments could bridge this translational divide12,13,14.
We recently developed a 3D spheroid system optimized for AAV transduction to improve the translatability of AAV transduction assays. This system significantly enhances AAV transduction efficiency across multiple cell lines and AAV serotypes compared to the gold-standard 2D assays. In addition to the improved sensitivity and conservation of the product used in the assay, these models improve upon 2D monolayers by providing realistic cell-cell interactions that vary with cellular location within the spheroid. They also enable meaningful investigation of drug penetration that simulates actual organ conditions11,15,16. Furthermore, this spheroid approach offers practical advantages over more complex organoid or co-culture systems, as it uses standard laboratory equipment and avoids specialized medium or scaffold requirements. This simplicity ensures reproducibility and scalability, making it well-suited for routine gene therapy testing and vector development workflows17.
This 3D spheroid platform is particularly well-suited for applications requiring sensitive detection of AAV transduction at low doses and comparative evaluation of vector genome designs. It also supports assessment of serotype-dependent tropism. It is especially advantageous for cell lines with relatively low transduction efficiency that require high AAV doses in conventional 2D cultures. In these contexts, the enhanced sensitivity and improved physiological relevance of the 3D platform are critical. However, this system may be less appropriate for studies requiring immune components, vascular delivery, or full tissue complexity. This is because spheroids do not fully recapitulate the in vivo environment.
Thus, we present a straightforward 3D spheroid protocol optimized for AAV transduction assays, with two critical and complementary readouts: transduction efficiency (defined here as total reporter signal per spheroid) and transduction kinetics. This method provides a cost-effective, physiologically relevant, informative platform for AAV potency evaluation, vector design, and neutralization assays.
Protocol
This study utilized established human cell lines (HEK293T, HeLa, Huh7, HEP3B, HEPG2, and A375) obtained from commercial or previously published sources. No primary human or animal samples were used, and therefore no ethical approval was required.
1. Sterile experimental setup and initial hood preparation
- Activate the biosafety cabinet.
- Turn on the Class II laminar flow microbiological safety cabinet 15 min prior to starting to allow sufficient time for airflow stabilization.
- Spray all interior hood surfaces with 70% (v/v) ethanol.
- Create a 5% (v/v) bleach disinfectant solution in a 500 mL glass beaker for disposal of cell supernatant and cellular debris.
- Clean equipment by thoroughly disinfecting all micropipettes and tip boxes using 70% (v/v) ethanol.
2. Cell culture media preparation
- Prepare 500 mL of Dulbecco's modified Eagle's medium (DMEM) high glucose base medium.
- Supplement the base medium with 10 mL heat-inactivated fetal bovine serum (FBS), 1 mL penicillin/streptomycin solution (100 units/mL penicillin and 100 µg/mL streptomycin), and 5 mL of 2 mM L-glutamine.
NOTE: Aseptic techniques should be maintained throughout all procedures. Fresh medium preparation is needed for each experiment. Please refer to the Table of Materials for specific equipment specifications.
3. Spheroid preparation
- Prepare complete DMEM medium as described above.
- Warm culture medium in a 37 °C water bath for 10–15 min.
- Remove cell lines of interest from the liquid nitrogen tank.
- Rapidly thaw cryopreserved HEK293T, Huh7, HEP3B, HEPG2, A375 and HeLa cells by placing in 37 °C water bath.
- Remove immediately from the water bath as soon as the last ice crystal is thawed.
- Dilute 1 mL of thawed cells in 9 mL of complete DMEM medium.
NOTE: All cell lines used in this protocol are maintained in the same DMEM media and culturing conditions. - Centrifuge cells at 350 × g. for 5 min at room temperature.
- Discard the supernatant.
- Resuspend the pellet in 5 mL of complete DMEM medium.
- Seed cells in a T75 cell culture flask.
- Place the seeded flasks in a cell culture incubator maintained at 37 °C, 5% CO2, and 95% humidity.
4. Cell growth monitoring
- Add 15 mL of culture medium every 3 days.
- Passage HEK293T, Huh7, HEP3B, HEPG2, A375, and HeLa cells when they reach 70% confluency, aspirate the complete DMEM medium from the T75 flasks.
- Wash cells by adding 5 mL of PBS to the T75 flasks containing the cells.
- Aspirate the 5 mL of PBS 30 s after addition to the T75 flasks.
- Repeat this wash step one more time.
- Trypsinize the cells with 5 mL of 0.05% trypsin-EDTA for 5 min.
- Incubate flasks in a 37 °C incubator for 5 min to allow complete cell detachment.
- Add 5 mL of complete DMEM medium to neutralize the trypsin.
- Centrifuge the cells at 350 × g. for 5 min to remove the trypsin.
- Resuspend the cell pellet in 5 mL of DMEM.
- Split cells at a 1:10 dilution for routine cell passaging.
NOTE: It is recommended to passage the cells 2 times before performing experiments to allow cells to reach log phase and become metabolically active. - Continue incubation under these controlled conditions until cells reach 70% confluency, then proceed with subsequent experimental procedures.
NOTE: Cell morphology and growth patterns should be monitored regularly. Ensure proper flask positioning for optimal gas exchange. Sterile conditions are essential throughout the incubation period.
5. Cell harvesting and initial cell preparation
- Remove culture medium by aspirating the existing culture medium from the T75 flasks.
- Wash HEK293T, Huh7, HEP3B, A375, HEPG2 and HeLa cells 3 times with PBS to remove residual medium and debris.
- Add 5 mL of pre-warmed 1× trypsin solution to these cells to detach adherent cells from the flask surface.
NOTE: Ensure trypsin is pre-warmed to maintain optimal enzymatic activity. Place flasks in a 37 °C incubator for 5 min to allow complete cell detachment. Monitor trypsinization time carefully to prevent overdigestion. - Add 5 mL of complete culture medium to inactivate the trypsin enzyme.
- Pipette the mixture up and down to homogenize the solution.
- Collect each cell suspension by transferring the entire cell suspension to individually labeled centrifuge tubes.
NOTE: Cells should be handled gently during resuspension to maintain viability. - Centrifuge cells by spinning at 350 × g. for 5 min at room temperature to pellet the cells.
- Discard the supernatant and gently resuspend the cell pellet in 5 mL of fresh culture medium.
6. Cell counting and viability assessment using a Cell counter
- Homogenize the suspension by gently pipetting up and down to ensure uniform cell distribution throughout the centrifuge tube.
- Prepare counting tubes for HEK293T, Huh7, HEP3B, HEPG2, A375 and HeLa cells.
- Prepare a 1:10 dilution of the sample in complete DMEM culture medium. For example, 40 µL of cell suspension into 360 µL of complete DMEM medium.
- Gently pipette the mixture up and down four times to ensure homogeneous dilution.
- Label the sample in the login, and assign the cell type used, dilution, and sample name.
- Load the sample onto the Cell counter and position the tube containing the diluted cell suspension into the assigned number.
NOTE: The Cell counter is an automated cell counter that aspirates cell samples and mixes them with trypan blue, reducing operator-to-operator variability. - Let the cell suspension settle for 1 min before counting the sample.
- Resuspend cells evenly before counting to obtain accurate results.
- Calculate the total cell number.
- Use the total viable cell concentration to determine cell seeding for experiments.
- Use viable cells with > 90% viability.
- Distinguish between viable (unstained) and non-viable (blue-stained) cells.
NOTE: Consistent counting criteria should be maintained across all samples.
7. Spheroid seeding and size optimization
- Pipette the cell suspension up and down to homogenize the solution.
- Seed different cell densities from HEK293T, Huh7, HEP3B, HEPG2, or HeLa cells.
- Start by seeding 1 x 10⁴ cells in 200 µL in an ultra-low attachment (ULA) 96-well round-bottom plate.
- Serially dilute the 1 x 10⁴ cells / well in 2-fold dilutions until you reach the desired cell density for the experiments.
- Add 1 volume of complete medium to all rows (1B-1H) except the top row.
- Add 2 volumes of 1 x 10⁴ cells /well in row 1A (top row).
- Serially dilute row 1A by adding 1 volume of row 1A into 1B and so on. See example of experimental layout below in Supplementary Figure 1.
NOTE- Ensure even resuspension by gently tapping the plate sides. - Spin down the ULA plate in a centrifuge at 350 × g .for 5 min to pull the cells to the center and promote cell-to-cell contact.
NOTE: If using cell lines other than those reported here, parameter optimization may be needed, as different cell lines exhibit varying growth and spheroid-formation rates. - Avoid disturbing the plates for the first 24–48 h to allow for initial spheroid formation. Let spheroids mature for 3 days to reach a diameter of ~400 µm.
- Check for spheroid size uniformity. Ensure cells are resuspended uniformly and that the plates are not warped.
Note: Do not use plates with spheroids of inconsistent sizes. Make sure spheroids are relatively uniform in diameter within each well. - Monitor spheroid morphology.
Note: Well-formed spheroids appear round with defined edges. - Make mature spheroids that exhibit tight cell-cell adhesion, not loose cell aggregates.
- Increase seeding density or extend formation time. If spheroids are not compact, increase the seeding density or extend the formation time.
- Minimize multiple small aggregates by reducing seeding density or by extending the centrifugation step.
8. Live-cell real-time spheroid monitoring
- Once cell suspensions are spun down, transfer the plate to a 37 °C incubator (5% CO2, 95% humidity), housing a live-cell imaging instrument for automated live cell imaging.
- Set the parameters for spheroid live cell imaging as needed for the experiment:
NOTE: The following parameters were used for all cell lines tested. - Log into the acquisition software.
- Select the following commands:|Schedule To Acquire | Launch Add Vessel | Scan On Schedule | Create Vessel: New.
- |Select Scan Type|: Spheroid. |Select the channels of interest|: Phase + Brightfield (to follow spheroid growth), Green/Red (to follow AAV transduction, acquisition time 300 ms or 400 ms respectively).
- Select the desired magnification: 10x.
- Pick the plate model and its position in the drawer.
- Select the position of wells to image, and how many images are desired per well.
- Enter the description of the experiment: name, type of cells, number of cells.
- For the analysis setup, select Defer Analysis Until Later.
- Right-click on the timeline and select the Set Selected Scan Group Interval option.
- Set add scans every 6 h and scan indefinitely. Set the desired starting time (at least 1 h after incubation in the automated imaging apparatus).
- Check daily for spheroid growth by logging in to the imaging software.
- Pick the View Recent Scans option and double-click on the desired experiment. |Select Brightfield in the image channels panel| and then use the |Measure image| features tool to measure the diameter of the spheroids.
NOTE: Optimal maturation timing may be needed to produce compact spheroids from the cells of interest. - Remove the plate on the day of optimized spheroid formation and use it for AAV transduction.
9. AAV Transduction
- Purchase or manufacture AAV serotypes3 and transgenes of interest.
- Make 2% FBS supplemented DMEM medium for AAV transductions by adding 10 mL of FBS to 490 mL of DMEM medium.
NOTE: For screening of capsids or genomic regulatory elements, a GFP transgene is highly effective, as demonstrated in the representative results section. Dilute the AAV of interest in 2% FBS supplemented DMEM medium, with no antibiotics. - Dilute in a designated 96-well round plate for serial dilutions.
- Make 1:10 dilutions from the starting MOI to titrate AAV1, AAV2, AAV5, AAV8, and AAV9.
- See example experimental layout below in Supplementary Figure 2. Calculate the MOI needed for AAV transduction, as shown in the Discussion section.
- Add 33 µL of AAV stock to 297 µL of media to obtain 330 µL total of MOI 1 × 10⁶.
- Perform 10-fold serial dilutions, starting with a MOI of 1 × 10⁶ by adding 33 µL into 297 µL of 2% FBS supplemented DMEM media.
NOTE: It is recommended to avoid high MOIs to prevent reduced cell viability. Optimization of experimental conditions may be needed for each cell type and AAV serotype, as they can significantly influence optimal MOI. Not all viral genomes are infectious; functional titers may differ from the vg/mL value.
10. AAV dosing
- Aspirate all media from the already prepared spheroid plate by using a multichannel pipette.
- Add 100 µL of the desired MOI by transferring this volume from the dilution plate to the treatment plate, using a multichannel pipette.
- Place plates back into the imaging instrument and start monitoring transduction by tracking green, fluorescent intensity over 72 h.
- Add 100 µL of complete DMEM medium per well every 3 days to replenish nutrients, if monitoring longer than 3 days.
11. Live-cell imaging, transduction monitoring, and data analysis
- Place the plate back in the instrument after adding the desired AAV and MOI to the treatment group.
- Begin recording transduction efficiency every 6 h.
NOTE: It usually takes between 3 and 5 days to achieve optimal GFP expression. This depends on the promoter and the genome configuration used. - Analyze the data by creating an analysis definition specific to the cells and reporter genes of interest.
NOTE: Alternatively, keep the plate in a standard 37 °C incubator and assess transduction efficiency by qPCR, western blotting, or ELISA. - Define Analysis Parameters by performing Brightfield Analysis for primary spheroid detection.
- Optimize Segmentation Parameters as follows:
- Analysis Type: "Spheroid Brightfield."
- Segmentation Method: "Adaptive Threshold."
- Threshold Range: 0.3–0.8 (auto-adjust recommended initially)
- Top-hat Filter: 200–500 µm (removes uneven illumination)
- Optimize brightfield parameters as follows:
- Load representative images from different time points.
- Test threshold range (0.2–0.9) to find optimal detection.
- Adjust size filters based on expected spheroid size range.
- Validate segmentation by visual overlay inspection.
- Optimize the Green Channel for AAV transduction assessment as follows:
- Determine background levels of untreated wells (MOI=0).
- Set threshold 2–3× above background noise.
- Test with the sample treated with the highest MOI.
- Optimize exposure time to avoid saturation while maintaining signal
NOTE: For AAV transductions, report the total fluorescence signal per spheroid as a measure of transduction efficiency.
12. Data Analysis
- Select the correct parameters, adjusting the filters and masks, so that you select the cells on the image and not background noise.
- Select a representative image to train the software.
- Apply optimized parameters to all images in the study.
- Extract the data either with individual values or grouped and transfer it to a statistical analysis system for further data presentation.
13. Onset time calculation
- Calculate the time it takes to detect the first GFP signal per MOI.
- Perform interpolation at mean untreated wells (MOI = 0) + 3 Standard Deviations (SD).
- Copy the green fluorescent intensity of each spheroid at each time point from the live-cell imaging software to a statistical software.
- Average replicates.
- Calculate the mean and SD signals of all wells with untreated spheroids (MOI = 0).
- Use the Asymmetric Sigmoidal, 5PL curve fit to interpolate the onset time for each MOI.
- For example, the following interpolation values were used in Table 1:
- For scGFP: 254,955 (mean) + 3 × 288,055 (SD) = 1,412,120 (interpolation signal)
- For ssGFP: 2,417,941(mean) + 3 × 26,093 (SD) = 3,200,746 (interpolation signal)
14. Measure fluorescence with a plate reader with fluorescence capabilities.
- Launch the fluorescent plate reader software on the computer connected to the plate reader.
- Navigate to File > Open Protocol and choose the plate type (e.g., 96-well, 384-well) and ensure the correct well layout is selected.
- Set the integration time for fluorescent detection, which determines how long the reader collects fluorescence from each well.
- Adjust any gain or sensitivity settings
if the assay requires higher or lower signal detection. - Set the fluorescent parameters for GFP as follows: excitation: 485 nm and emission: 528 nm.
- Click Run in the software to start the measurement.
- Measure fluorescence from each well.
NOTE- After the run, the software displays raw fluorescence values, which can be used to generate graphs by calculating averages and subtracting the background. - Export results in the preferred format for further analysis or reporting.
NOTE: If the sample protocol was modified, use File > Save As to create a unique version, preserving the original for future use.
15. Luminescent transgene transduction
- Follow the same seeding and AAV dosing protocol as detailed above.
- Add 100µL of AAV1, AAV2, AAV5, AAV8, and AAV9 carrying a nano luciferase transgene with different MOIs ranging from 0–106 to 100 µL of HeLa spheroids already grown in ULA plates.
- Incubate plates in a regular 37 °C incubator and assess transduction efficiency after 3 days of transduction.
16. Prepare the extracellular luminescence inhibitor and luminescence substrate for live- cell assay detection
- Remove assay plates from the incubator at day 3 (endpoint).
- Add extracellular luminescence inhibitor and substrate directly to the cells.
NOTE: No media removal is required. - Remove the Extracellular inhibitor from −20 °C storage and allow to thaw at room temperature.
- Centrifuge briefly to collect liquid from the cap and sides of the tube.
- Prepare the desired amount of reconstituted 15X Extracellular luminescence inhibitor by combining 1 volume of Extracellular inhibitor with 14 volumes of complete DMEM media.
- For example, if the experiment requires 1.0 mL of reagent, add 67 µL of inhibitor to 933 µL of DMEM. For 1 plate, prepare 1 mL of DMEM, and add 67 µL of inhibitor.
- Transfer prepared inhibitor from Step 16.5 to a sterile reagent reservoir.
- Use a multichannel pipette to dispense 10 µL of inhibitor to the wells transduced with AAV.
- Remove the Live Cell Substrate from −20°C storage and mix.
- Centrifuge briefly to collect liquid from the cap and sides of the tube.
- Prepare the desired amount of reconstituted 3.6X Live Cell Reagent.
- Prepare 4 mL of DMEM and add 144 µL of substrate for 1 plate.
- Transfer the prepared substrate from Step 16.11 to a sterile reagent reservoir.
- Use a multichannel pipette to dispense 50 µL of substrate to the same wells transduced with AAV.
NOTE: The volume of reagents may need to be adjusted if multiple assay plates are run simultaneously. - Shake the plate at 300 rpm for 5 min at room temperature.
- Read the plate with an in vivo imaging system instrument within 2 h of adding the luminescence detection reagents.
NOTE: The luminescence intensity will gradually decay over 2 h.
17. Bioluminescence imaging
- Power on the bioluminescence imaging system at least 30 min before imaging to allow the CCD camera to cool (−90 °C).
- Ensure plates are ready for imaging (e.g., live cell imaging substrate added for bioluminescence readout)
- Remove plate lid to avoid light reflection and scattering.
- Clean the bottom of the plate if imaging from below.
- Place the plate in the imaging chamber on the stage.
- Position the plate centered under the camera.
- Set imaging parameters for Luminescence: Auto-exposure or set exposure time (typically 1–60 s), binning (medium recommended), f/stop (1 for maximum sensitivity).
- Take a photograph for anatomical reference.
- Capture the luminescent image.
18. Bioluminescence Imaging Data Analysis
- Use ROI tools to circle wells or areas of interest.
- Ensure consistent ROI size across samples for comparison.
- Measure total flux (photons/second) for bioluminescence.
- Measure radiant efficiency.
- Export data to a spreadsheet for statistical analysis.
- Save image files and analysis results.
- Export images as TIFF or JPEG for presentations.
Results
Here, we show that 3D spheroids can be used as a tool to assess AAV transduction, distinguish vector genome designs such as self-complementary (sc) and single-stranded (ss), and assess transduction kinetics. An overview of the process is shown in Figure 1. Briefly, cells are first expanded in 2D cultures and seeded into ultra-low attachment (ULA) plates to form compact spheroids (Figure 1A). Then, the plates are centrifuged to promote aggregation (Figure 1B) and transferred to a live-cell imaging system for real-time monitoring of spheroid formation (Figure 1C). On day 3, spheroids are transduced with AAV at varying MOIs (Figure 1D). Transduction kinetics are tracked longitudinally using live-cell imaging (Figure 1E), and endpoint analysis is performed using plate-based fluorescence or luminescence readouts (Figure 1F).
Figure 2 shows the morphology of spheroids from 6 different cell lines, demonstrating a range of densities, roundness, and shape. All cell lines were grown in complete DMEM media for a few passages before being used in any experiment. Once cells reached log phase, HEP3B, HEK293T, A375, HeLa, HEPG2, and Huh7 cells were harvested and serially diluted in ULA-round bottom plates, starting at a cell density of 10,000 cells per well, and serially diluted by 2-fold (Plate layout included in Supplementary Figure 1 and representative results are shown in Supplementary Figure 2). Spheroid size can be as small as 50 µm while still maintaining spheroid structure and excellent transduction susceptibility. After cell seeding, the ULA round-bottom plate was spun down at 350 × g. for 5 min, which allowed the cells to congregate at the well center and self-assemble into spheroids. This step is particularly beneficial for cells that do not naturally aggregate. The spin-down can be extended from 5 to 15 min for highly resistant cells, such as lymphocytes. Well-formed spheroids exhibit a round and compact phenotype, such as that observed in HEK293T and Huh7 cells, whereas poorly formed spheroids are loosely aggregated and prone to disintegration during media changes.
Next, the plate is transferred to a 37 °C incubator equipped with an instrument for live-cell monitoring. The plates are monitored daily at 6 h intervals to assess spheroid formation for each of the cell lines reported here. Most cell lines require 3 days to self-assemble into a spheroid. As shown in Figure 2, each cell line exhibited distinct morphological features and varying levels of compaction after 3 days of seeding. Hepatic cell lines (Huh7, HEPG2, and HEP3B) formed more compact, dense spheroids than the other cell lines. HEK293T formed a very round spherical appearance with a distinct necrotic core, whereas A375 formed an irregularly shaped cell aggregate (previously described as a deformed spheroid)18,19. These differences in morphology are thought to be indicators of pathophysiological states of disease, which further supports the utility of 3D models compared to 2D culture systems18,19. The spheroid assembly protocol is highly reproducible across the six cell lines tested and was applied to all transductions shown here.
After optimizing cell concentration, time for spheroid formation, and status of green/red autofluorescence (shown in Supplementary Figure 3), we proceeded to test AAV transduction in spheroids using a live-cell imaging system and a plate reader (an Example of the plate layout for AAV titration is shown in Supplementary Figure 4). Figure 3 shows the optimized spheroid protocol applied in four different cell lines (HEK293T, Huh7, HEP3B, and HEPG2). On day 3 of spheroid formation, spheroids were transduced with two AAV2 vectors carrying distinct vector genome designs, tagged with GFP, at various multiplicities of infection (MOIs). These two AAV transgene designs represent high-potency (scGFP) and low-potency (ssGFP) GFP variants. Once the cells were transduced, the plates were placed in a live-cell imaging system for real-time monitoring of the AAV transduction. At the 72-h time point, green fluorescent intensity was detected using live-cell imaging Software. In Figure 3, the blue lines represent sc-GFP genomes, whereas the red lines represent ss-GFP genomes. Spheroids were highly susceptible to AAV transduction, with strong transduction detected at very low AAV titers and across different cell lines for scGFP. Representative videos of AAV transduction in various cell lines and MOIs, captured in real time, are shown in Supplementary Movie 1, Supplementary Movie 2, Supplementary Movie 3, Supplementary Movie 4, Supplementary Movie 5, and Supplementary Movie 6. On the other hand, spheroid transduction of ssGFP AAV was observed at lower levels, which recapitulates the expected weaker/slower transduction of this type of regulatory element20,21. This demonstrates the utility of 3D spheroids for strong and weak AAV transductions, as well as for discriminating between strong transducing genes, such as sc-GFP, and less potent genes, such as ss-GFP. We observed a 100-fold difference in relative fluorescence between the sc and ss transgenes at an MOI of 106 in HEK293T cells, and a 3-fold difference in harder-to-transduce cell lines, such as HEP3B.
We next proceeded to test the AAV transduction of various serotypes in a dose-dependent manner in both HEK293T spheroids and Huh7 spheroids. As shown in Figure 4, 3D spheroids were amenable to AAV-scGFP transductions of four different serotypes. After 72 h of transduction, scGFP was measured using a fluorescent plate reader (Figure 4A,B) and live-cell imaging Software (Figure 4C,D). All 4 serotypes were successfully detected using these two instruments. The live-cell imaging system showed higher range between the signal to noise than a fluorescent plate reader although normalized signal did not show significant differences. We found that AAV2 had the strongest transduction efficacy in both cell lines, followed by AAV1, whereas AAV5 and AAV9 showed significantly lower transduction.
Next, we evaluated luminescence transduction using the spheroid protocol. To test this, HeLa cells were grown into 3D spheroids following the optimized protocol described here. On day 3, HeLa spheroids were transduced with 5 different AAV serotypes encoding a nano luciferase reporter gene. After 72 h of AAV transduction, the cells were treated with Live Cell substrate and incubated for 5 min at room temperature. Next, luminescence was measured and imaged using a bioluminescence imaging system (Figure 5A). Efficient transduction was observed for all AAV serotypes using this system. Sensitive discrimination between the transduction efficacy of different AAV serotypes was observed, indicating that the protocol is not limited to fluorescence readouts. Consistent with the trends observed in Figure 5, AAV-nano luciferase transduction in HeLa cells showed that AAV2 is the most potent serotype, as seen with the AAV-GFP vectors. Similarly, the lowest transduction efficacy was observed for the AAV9 serotype, as shown by both fluorescence and luminescence vectors (Figure 4 and 5). A representative image of AAV-nano luciferase transduction is shown in Figure 5B.
In addition to transduction intensity, 3D spheroid protocols enable kinetic monitoring of transduction. Figure 6 shows representative results for 3D HEK293T spheroid transduction kinetics of AAV2-scGFP and AAV2-ssGFP, when transduced at different MOIs (0-106) (Figure 6A-G). We found that AAV2-scGFP transduction is detectable at MOIs as low as 101, with an increase in GFP signal detectable after about 34 h compared to untreated cells, using a live-cell imaging system. The AAV2-ssGFP signal is much weaker and slower than the AAV2scGFP signal. To further compare transduction speed, we calculated the onset time when the GFP signal becomes detectable. We observed that scGFP is, on average, 4 times faster than ssGFP in transducing cells. Individual onset times are reported in Table 1. These kinetic measurements show an additional aspect of transduction efficacy useful for assay optimization.
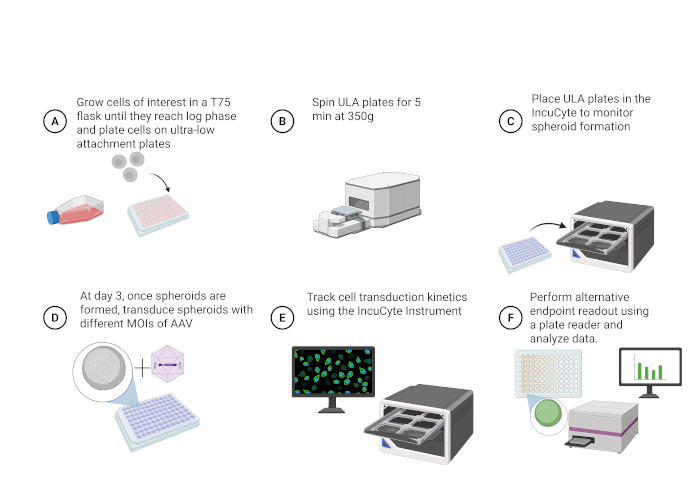
Figure 1: Overview of AAV transductions using 3D cultures. (A) Cells are expanded in 2D culture and seeded into ultra-low attachment (ULA) plates to form spheroids. (B) Plates are centrifuged to promote aggregation and transferred to a (C) IncuCyte S3 system for real-time monitoring of spheroid formation. (D) At day 3, spheroids are transduced with AAV at varying MOIs. (E) Transduction kinetics are tracked longitudinally using live-cell imaging, and (F) endpoint analysis can be performed using plate-based fluorescence or luminescence readouts. Please click here to view a larger version of this figure.

Figure 2: Morphological characterization of spheroids across multiple cell lines. Representative images of spheroids generated from HEP3B, HEK293T, A375, HeLa, HEPG2, and Huh7 cells demonstrate variability in size, morphology, and compactness, while providing high reproducibility across replicates (scale bar, 50 µm). All cell lines were seeded at 1 x 10⁴ cells/well for 3 days. Please click here to view a larger version of this figure.
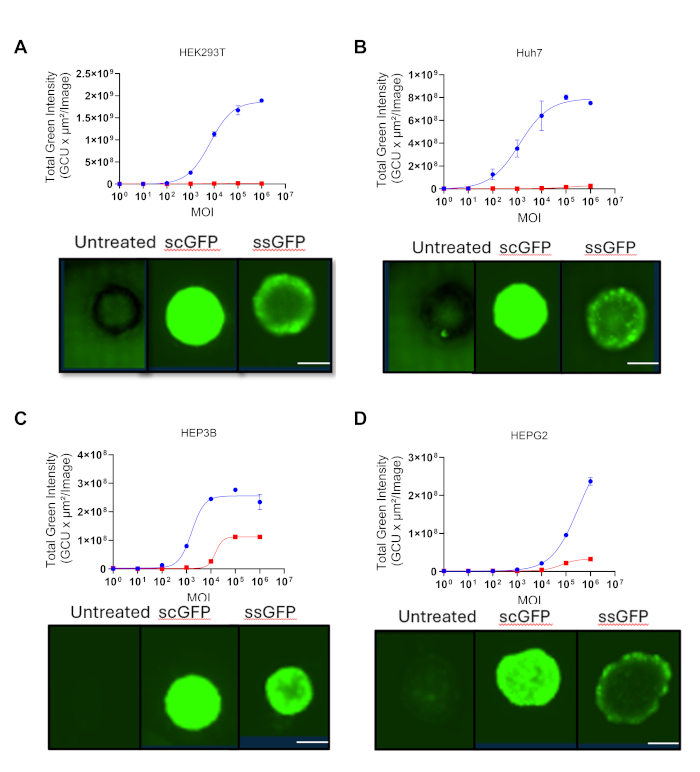
Figure 3: Comparison of AAV transduction efficiency between self-complementary (scGFP) and single-stranded (ssGFP) vectors across cell lines. 3D spheroids of (A) HEK293T, (B) Huh7, (C) HEP3B, and (D) HEPG2 were self-assembled and transduced with different MOIs of AAV2-scGFP (blue) and AAV2-ssGFP (red). Total green fluorescence intensity was quantified at 72 h post-transduction. Representative images of spheroids treated at the highest MOI for each AAV taken at a 72 h time point using a live-cell imaging system. Scale bars represent 200 µm. Error bars represent SD. Please click here to view a larger version of this figure.
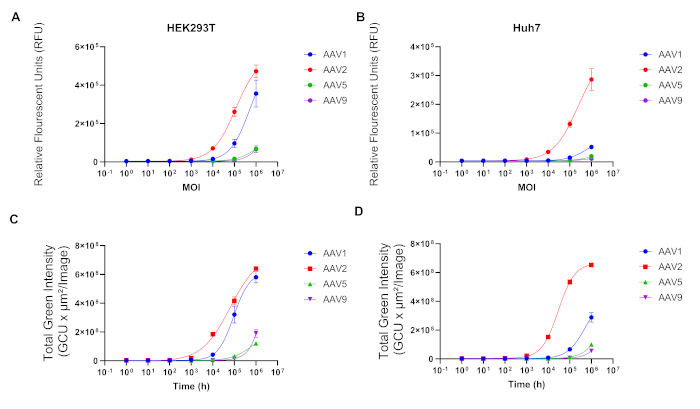
Figure 4: AAV transduction in 3D spheroids distinguishes the activity of different AAV serotypes. 3D spheroids from (A,C) HEK293T and (B,D) Huh7 were transduced with AAV1, AAV2, AAV5, and AAV9, scGFP transgene across a range of MOIs. Fluorescent Intensity units were measured at 72 h using a fluorescent-based plate reader (A,B) and live-cell imaging system (C,D). Error bars represent SD. Please click here to view a larger version of this figure.
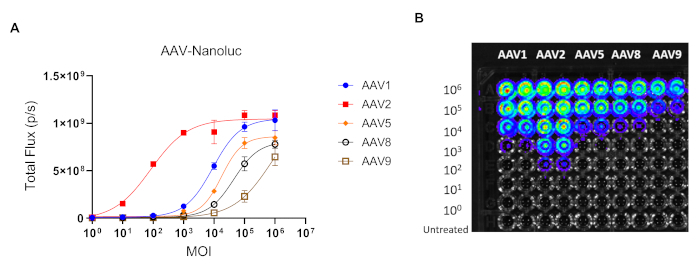
Figure 5: AAV transduction in 3D spheroids with luminescent reporters. HeLa spheroids were transduced with AAV1, AAV2, AAV5, AAV8, and AAV9 encoding a nanoluciferase reporter transgene at increasing MOIs. Luminescence was visualized and measured using an Endpoint readout with the luminescence imaging system 72 h post-transduction. (A) Total Flux values. (B) Representative End-point readout with luminescence images of spheroid plates demonstrates signal distribution across MOIs and serotypes. Each AAV vector was run in two horizontal replicates. Error bars represent SD. Please click here to view a larger version of this figure.
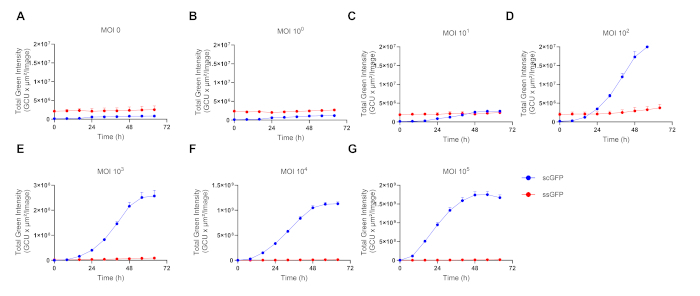
Figure 6: Transduction kinetic evaluation in 3D Spheroids. HEK293T spheroids were transduced with AAV2-scGFP (blue) and AAV2-ssGFP (red) across a range of 7 MOIs (A–G). Total green intensity was measured over a 72 h period, with 6 h time intervals, using the Monitor spheroid formation/growth system. Please click here to view a larger version of this figure.
| MOI | scGFP (hrs) | ssGFP (hrs) |
| 1 | >72hrs | >72 |
| 10 | 34.2 | >72 |
| 100 | 16.5 | 54.2 |
| 1000 | 5.6 | 23.1 |
| 10000 | 3.3 | 13 |
| 100000 | 1.9 | 8 |
Table 1: Onset time for GFP detection.
Supplementary Figure 1: Plate layout for spheroid titration. (A) Representative plate layout showing the dilution scheme for HEK293T, Huh7, HEP3B, and HEPG2 spheroids, generated from initial seeding densities ranging from 10,000 to 78 cells. Please click here to download this file.
Supplementary Figure 2: Spheroid formation across a range of seeding densities. Representative microscope images of HEK293T and Huh7 spheroids generated from initial seeding densities ranging from 10,000 to 78 cells on day 3. Scale bar represents 50 µm.Please click here to download this file.
Supplementary Figure 3: Cell line information for 3D Spheroid formation.Please click here to download this file.
Supplementary Figure 4: Plate layout for AAV serial dilutions. (A) Representative plate layout showing the AAV serial dilution scheme used for AAV1, AAV2, AAV5, and AAV9, starting at MOI of 106. Negative control shown in row H, representing untreated spheroids.Please click here to download this file.
Supplementary Movie 1: Real-time live cell imaging of AAV2-scGFP transduction in HEK293T spheroids at MOI 106.Please click here to download this file.
Supplementary Movie 2: Real-time live cell imaging of AAV2-scGFP transduction in Huh7 spheroids at MOI 106.Please click here to download this file.
Supplementary Movie 3: Real-time live cell imaging of AAV2-scGFP transduction in HEP3B spheroids at MOI 106.Please click here to download this file.
Supplementary Movie 4: Real-time live cell imaging of AAV2-scGFP transduction in HEK293T spheroids at MOI 106, as part of a dose dependency study.Please click here to download this file.
Supplementary Movie 5: Real-time live cell imaging of AAV2-scGFP transduction in HEK293T spheroids at MOI 104.Please click here to download this file.
Supplementary Movie 6: Real-time live cell imaging of AAV2-scGFP transduction in HEK293T spheroids at MOI 101.Please click here to download this file.
Supplementary File 1: Calculation of the MOI needed for AAV transduction.Please click here to download this file.
Discussion
We present here a streamlined in vitro 3D platform for AAV development and potency testing. This platform leverages enhanced transduction, high sensitivity, and better translational predictability using three-dimensional cell culture that more closely resembles human tissue architecture. This system successfully differentiates transduction efficacy across AAV serotypes and regulatory elements, including single-stranded and self-complementary vectors, in multiple cell lines. We note that, in contrast to conventional 2D assays, where transduction efficiency is often defined as the percentage of transgene-positive cells, the 3D spheroid system does not readily allow single-cell-resolution quantification. Therefore, transduction efficiency in this study is defined as the bulk reporter signal intensity (fluorescent or luminescent), which reflects the combined contributions of the proportion of transduced cells and the level of transgene expression per cell. The high sensitivity of the spheroids substantially reduces the need for high product quantities, making it cost-effective, versatile, and physiologically relevant for AAV research and development.
This approach addresses key challenges with traditional 2D cell culture assays, which rely on adhesion to artificial surfaces and lack cellular organization, possibly leading to poor predictions of vector performance in clinical settings. The 3D spheroid system better mimics tissue structure and drug distribution patterns, providing vector behavior data that more closely matches real biological conditions22,23. The protocol uses simple ultra-low attachment plates, making it easily reproducible in standard laboratory settings.
This adaptable system could be used for AAV neutralization assays, to study AAV penetration, and to develop more complex co-culture experiments to investigate the effects of different cellular environments on AAV transduction. In addition, high-throughput drug and vector screening platforms can easily integrate with the spheroid platform, enabling automation and cost reduction in vector discovery workflows for the development of more targeted products.
A major practical advantage of spheroids is their ability to grow continuously for weeks without cell passaging, enabling extended studies of AAV activity. This stable culture system maintains important cell-cell interactions and matrix components, avoiding the interruptions caused by repeated cell harvesting required in 2D cultures24. The preserved cellular environment supports natural protein organization and membrane structures that are essential for evaluating AAV binding and entry into cells25.
Although 3D spheroids show great potential for AAV transduction assessments, they also present some translational shortcomings compared to in vivo models, primarily due to their simplified structure relative to native tissues. Spheroids lack critical physiological components, including vasculature for vector delivery, immune cells for assessing immunogenicity, and tissue-specific barriers such as the blood-brain barrier, that could significantly impact AAV performance26. These limitations indicate that spheroids, despite offering an intermediate level of complexity between conventional 2D cultures and in vivo animal models, remain insufficient to fully recapitulate the physiological microenvironment required for comprehensive AAV assessment.
The spheroid protocol presented here describes a single cell type at a time. This protocol can be developed to include 2–3 additional cell types that aggregate into a basic three-dimensional structure. More complex 3D models, such as organoids or microfluidics, are multicellular systems that recapitulate the cellular diversity and organization of specific organs, containing 10 or more distinct cell types arranged in tissue-like patterns. Such advanced 3D organoids can include multiple cells27, hydrogel-embedded cultures, hanging drop techniques, and microfluidic platforms11,27,28. While these methods provide more complex tissue architecture that could help further our understanding of AAV biology, they tend to require more specialized reagents, equipment, and considerable technical expertise. On the other hand, 3D spheroids formed in ultra-low attachment plates are considerably simpler and are appropriate for many laboratories due to their cost-effectiveness and reproducibility.
Critical steps for successful implementation of this protocol include maintaining high cell viability, as compromised cells can impair spheroid formation and transduction efficiency. The use of ultra-low attachment plates and optimization of centrifugation are also critical for achieving spheroid compactness. Optimizing MOI for each cell type and AAV serotype is essential to avoid weak signals or saturation. Selection of the appropriate detection method is also critical, particularly for kinetic analyses, where compatibility with continuous live-cell imaging systems is required. Several technical considerations are important for accurate interpretation of AAV transduction in 3D spheroids.
A poor or absent transduction signal may result from low viral titer, suboptimal MOI, or insufficient incubation time; this can be addressed by verifying viral titers, optimizing MOI, and extending incubation time (typically 3–5 days). Weak fluorescence or luminescence signals may reflect low transgene expression or limited reagent penetration within the 3D structure, which can be improved by optimizing exposure settings or allowing additional time for substrate diffusion. A major challenge in certain cell lines, such as HeLa cells, is autofluorescence, which can lead to high background signal and reduced sensitivity in fluorescence-based assays. To address this limitation, we implemented a luminescence-based nanoluciferase reporter system, which provides an improved signal-to-noise ratio and enables more accurate detection of transduction in autofluorescent backgrounds. In addition, background signal may arise from improper thresholding or media-related fluorescence and should be controlled using untreated wells (MOI = 0) to define baseline levels. Finally, signal saturation at high MOIs may occur due to excessive viral input or detector limitations; this can be mitigated by reducing the MOI range and optimizing detector exposure settings to maintain measurements within the linear dynamic range.
Overall, this 3D spheroid methodology provides a streamlined, reproducible system for evaluating AAV transduction, potency, and kinetics. By bridging the gap between conventional 2D assays and in vivo studies, it enables more informed vector development and supports the advancement of clinically relevant gene therapy strategies.
Disclosures
The authors have nothing to disclose.
Acknowledgements
The authors thank Morten Seirup and Trish Hoang for providing the plasmid for AAV nanoluciferase production and the live substrate reagents. This project was supported by an appointment to the ORISE Research Participation Program at the CBER, U.S. Food and Drug Administration, administered by the Oak Ridge Institute for Science and Education under an interagency agreement between the U.S. Department of Energy and the FDA.
Materials
| Name | Company | Catalog Number | Comments |
|---|---|---|---|
| 37C incubator | ThermoFisher Scientific | #51025983 | Standard culture conditions |
| A375 cells | ATCC | CRL-1619 | Cell line |
| AAV1 plasmid | Addgene | 112862 | AAV plasmid |
| AAV2 plasmid | Addgene | 104963 | AAV plasmid |
| AAV5 plasmid | Addgene | 104964 | AAV plasmid |
| AAV8 plasmid | Addgene | 112864 | AAV plasmid |
| AAV9 plasmid | Addgene | 112865 | AAV plasmid |
| BioTek GEN5 plate reader | Agilent Technologies | NA | End-point readout for fluorescence or luminescence |
| Centrifuge | ThermoFisher Scientific | #TSO-MX1R | Maintain spheroid suspension |
| Corning™ Cell Culture Phosphate Buffered Saline (1X) | Fisher Scientific | #MT21040CMX | PBS to rinse cells |
| DMEM high glucose, GlutaMAX supplement, pyruvate | ThermoFisher Scientific | #10569010 | Complete growth medium |
| Extracellular NanoLuc Inhibitor | Promega | N235B | Quenches any Nanoluc® signal coming from the extracellular environment |
| Fetal Bovine Serum (FBS) | Sigma-Aldrich | #F4135-500mL | Provide growth factors |
| HEK293T Cells | ATCC | CRL-3216 | Cell line |
| HeLa Cells | ATCC | CRM-CCL-2 | Cell line |
| HEP3B Cells | ATCC | HB-8064 | Cell line |
| HEPG2 Cells | ATCC | HB-8065 | Cell line |
| Huh7 Cells | ABM | T8973 | Cell line |
| IncuCyte S3 Inverted microscope | Sartorius | NA | Monitor spheroid formation/growth |
| IVIS Spectrum Imager | Spectralinvivo | NA | End-point readout for luminescence |
| Nano-Glo® Live Cell Assay | Promega | N2013 | Luminescent substrate reagent for live cell detection |
| Penicillin-Streptomycin (10,000 U/mL) | ThermoFisher Scientific | # 15140122 | Prevent bacterial contamination |
| T75 Tissue Culture flasks with ventilation | Fisher Scientific | #NC0509296 | Flasks to grow cells |
| Trypsin-EDTA (0.05%) | ThermoFisher Scientific | #25300120 | Enzymatic detachment of cells |
| Ultra-low attachment plates | Corning | #7007 | Prevent cell adhesion to promote spheroid formation |
References
- Mendell JR, et al. Current Clinical Applications of In Vivo Gene Therapy with AAVs. Mol Ther. 2021;29(2):464-88.
- Byrne BJ, et al. Current clinical applications of AAV-mediated gene therapy. Mol Ther. 2025;33(6):2479-516.
- Najera SS, et al. AAV2 delivery of the saCas9 gene results in presentation of an HLA-A*02:01-restricted T cell epitope potent to induce T cell cytotoxicity. Mol Ther Methods Clin Dev. 2025;33(3):101506.
- Alhakamy NA, Curiel DT, Berkland CJ. The era of gene therapy: From preclinical development to clinical application. Drug Discov Today. 2021;26(7):1602-19.
- Arutyunyan IV, et al. Gene Expression Profile of 3D Spheroids in Comparison with 2D Cell Cultures and Tissue Strains of Diffuse High-Grade Gliomas. Bull Exp Biol Med. 2023;175(4):576-84.
- Cashen P, Manser B. Quality by design (QbD) for adeno-associated virus (AAV): A framework for a QbD assessment for AAV products within the chemistry manufacturing and controls (CMC) documentation [Internet]. Port Washington (NY): Pall Corporation; 2021. Available from: https://www.pall.com/
- Center for Biologics Evaluation and Research. Potency Assurance for Cellular and Gene Therapy Products: Draft Guidance for Industry [Internet]. Silver Spring (MD): U.S. Food and Drug Administration; 2023. Available from: https://www.fda.gov/regulatory-information/search-fda-guidance-documents/potency-assurance-cellular-and-gene-therapy-products
- Fu Q, Polanco A, Lee YS, Yoon S. Critical challenges and advances in recombinant adeno-associated virus (rAAV) biomanufacturing. Biotechnol Bioeng. 2023;120(9):2601-21.
- Martinez RA, et al. A versatile cell line for establishing potency of cell type-specific AAV transgenes. Mol Ther Methods Clin Dev. 2025;33(1):101401.
- Zengel J, et al. Development of cell lines with increased susceptibility to diverse adeno-associated viral vectors to enable in vitro potency assays. Mol Ther Methods Clin Dev. 2025;33(1):101416.
- Marconi GD, et al. Three-Dimensional Culture System: A New Frontier in Cancer Research, Drug Discovery, and Stem Cell-Based Therapy. Biology (Basel). 2025;14(7):875.
- Bialkowska K, Komorowski P, Bryszewska M, Milowska K. Spheroids as a Type of Three-Dimensional Cell Cultures-Examples of Methods of Preparation and the Most Important Application. Int J Mol Sci. 2020;21(17):6225.
- Ducker M, Millar V, Ebner D, Szele FG. A Semi-automated and Scalable 3D Spheroid Assay to Study Neuroblast Migration. Stem Cell Reports. 2020;15(3):789-802.
- Hiller T, et al. Generation of a 3D Liver Model Comprising Human Extracellular Matrix in an Alginate/Gelatin-Based Bioink by Extrusion Bioprinting for Infection and Transduction Studies. Int J Mol Sci. 2018;19(10):3129.
- Jakeman PG, et al. Improved in vitro human tumor models for cancer gene therapy. Hum Gene Ther. 2015;26(5):249-56.
- Kapalczynska M, et al. 2D and 3D cell cultures - a comparison of different types of cancer cell cultures. Arch Med Sci. 2018;14(4):910-9.
- Gunti S, Hoke ATK, Vu KP, London NR Jr. Organoid and Spheroid Tumor Models: Techniques and Applications. Cancers (Basel). 2021;13(4):874.
- McRobb LS, Lee VS, Faqihi F, Stoodley MA. A Simple Model to Study Mosaic Gene Expression in 3D Endothelial Spheroids. J Cardiovasc Dev Dis. 2024;11(10):305.
- Ohguro H, et al. 3D Spheroid Configurations Are Possible Indicators for Evaluating the Pathophysiology of Melanoma Cell Lines. Cells. 2023;12(5):759.
- Casey G, et al. Self-complementarity in adeno-associated virus enhances transduction and gene expression in mouse cochlear tissues. PLoS One. 2020;15(11):e0242599.
- Hutt JA, et al. Scientific and Regulatory Policy Committee Points to Consider: Nonclinical Research and Development of In Vivo Gene Therapy Products, Emphasizing Adeno-Associated Virus Vectors. Toxicol Pathol. 2022;50(1):118-46.
- El Harane S, et al. Cancer Spheroids and Organoids as Novel Tools for Research and Therapy: State of the Art and Challenges to Guide Precision Medicine. Cells. 2023;12(7):1001.
- Najera SS, et al. Targeting NAD+ Metabolism Vulnerability in FH-Deficient Hereditary Leiomyomatosis and Renal Cell Carcinoma with the Novel NAMPT Inhibitor OT-82. Mol Cancer Ther. 2025;24(2):200-13.
- Huang HL, et al. Trypsin-induced proteome alteration during cell subculture in mammalian cells. J Biomed Sci. 2010;17(1):36.
- Ripa I, Andreu S, Lopez-Guerrero JA, Bello-Morales R. Membrane Rafts: Portals for Viral Entry. Front Microbiol. 2021;12:631274.
- Habanjar O, Diab-Assaf M, Caldefie-Chezet F, Delort L. 3D Cell Culture Systems: Tumor Application, Advantages, and Disadvantages. Int J Mol Sci. 2021;22(22):12200.
- Kaiser VM, Gonzalez-Cordero A. Organoids - the future of pre-clinical development of AAV gene therapy for CNS disorders. Gene Ther. 2025;Mar 27. Epub ahead of print. PMID: 40148593.
- Ramamurthy RM, Atala A, Porada CD, Almeida-Porada G. Organoids and microphysiological systems: Promising models for accelerating AAV gene therapy studies. Front Immunol. 2022;13:1011143.
Reprints and Permissions
This article has been published
Video Coming Soon