For patients with long-standing type 2 diabetes mellitus and age-related cataracts, small-incision cataract surgery and phacoemulsification provide comparable overall visual, ocular surface, and corneal outcomes over 6 months, although early postoperative corneal endothelial cell density is transiently lower after small-incision cataract surgery.
Research Article
Effect of Two Different Surgical Methods on Age-Related Cataracts with Long-Standing Type 2 Diabetes Mellitus: A Retrospective Case-Control Study
* These authors contributed equally
In This Article
Summary
Abstract
This retrospective case-control study evaluated anterior segment recovery after small-incision cataract surgery (SICS) and phacoemulsification (PE) in patients with age-related cataracts and long-standing (≥10 years) type 2 diabetes mellitus (T2DM). A total of 165 patients (165 eyes) were included, with 83 eyes undergoing SICS and 82 eyes undergoing PE. Glycated hemoglobin (HbA1c), diabetic retinopathy status, renal function, diabetic peripheral neuropathy status, preoperative ocular surface disease severity, and quantitative lens density were assessed. Intraoperative parameters, including operative duration, nuclear delivery difficulty, cumulative dissipated energy (CDE), ultrasound settings, balanced salt solution (BSS) irrigation volume, and surgically induced astigmatism (SIA), were recorded. Best-corrected visual acuity (BCVA), tear film break-up time (TBUT), Schirmer I test (SIT), corneal endothelial cell density (CECD), and central corneal thickness (CCT) were evaluated preoperatively and at 1 week, 1 month, 3 months, and 6 months postoperatively. In both groups, BCVA improved significantly and stabilized by 1 month after surgery. TBUT and SIT decreased postoperatively and returned to baseline levels by 6 months. CECD decreased significantly and stabilized by 3 months, whereas CCT increased transiently and returned to baseline within 1 month. No statistically significant between-group differences were observed in BCVA, TBUT, SIT, or CCT; CECD was transiently higher in the PE group at 1 week and 1 month postoperatively. These findings show that SICS and PE were associated with similar visual recovery, ocular surface outcomes, and corneal endothelial changes during the 6-month follow-up period in patients with long-standing T2DM and age-related cataracts.
Introduction
With population aging and the increasing prevalence of diabetes, diabetic cataracts have become a common ocular comorbidity1. Patients with diabetes have a higher incidence of cataracts and altered ocular healing physiology than individuals without diabetes2. Cataract surgery is the definitive treatment, and the two most widely used surgical techniques are small-incision cataract surgery (SICS) and phacoemulsification (PE)3. Phacoemulsification uses a smaller incision and is associated with rapid postoperative recovery, whereas SICS remains a cost-effective and accessible option in primary care and resource-limited settings4,5.
Type 2 diabetes mellitus (T2DM) is associated with corneal endothelial dysfunction, reduced corneal nerve density, diabetic keratopathy, and delayed epithelial healing, which may increase susceptibility to surgical trauma and prolong postoperative recovery6,7,8. Although posterior segment complications, such as cystoid macular edema, are well-recognized concerns following cataract surgery in patients with diabetes9, the present study focused on anterior segment recovery, including ocular surface function and corneal endothelial status. These parameters are important for postoperative visual rehabilitation but have been evaluated less frequently in patients with long-standing T2DM. Previous studies comparing SICS and PE in patients with diabetes have seldom focused on individuals with a T2DM duration of ≥10 years or included extended follow-up of ocular surface and corneal endothelial outcomes over 6 months.
This study compared postoperative visual, ocular surface, and corneal endothelial outcomes following SICS and PE in patients with age-related cataracts and long-standing T2DM (≥ 10 years). Best-corrected visual acuity (BCVA), tear film break-up time (TBUT), Schirmer I test (SIT), corneal endothelial cell density (CECD), and central corneal thickness (CCT) were evaluated during a 6-month follow-up period. The hypothesis was that the two surgical techniques would produce similar anterior segment recovery and visual outcomes.
Protocol
This study was conducted in accordance with the Declaration of Helsinki and was approved by the Ethics Committee of Beijing Tsinghua Changgung Hospital (Approval No. 26875-6-01), which provided ethics oversight for the retrospective cohort enrolled at Beijing Tongren Hospital, Mentougou Campus. The requirement for research-informed consent was waived because of the retrospective study design. The study workflow is shown in Figure 1. The instruments, consumables, medications, and software used in the protocol are listed in the Table of Materials.
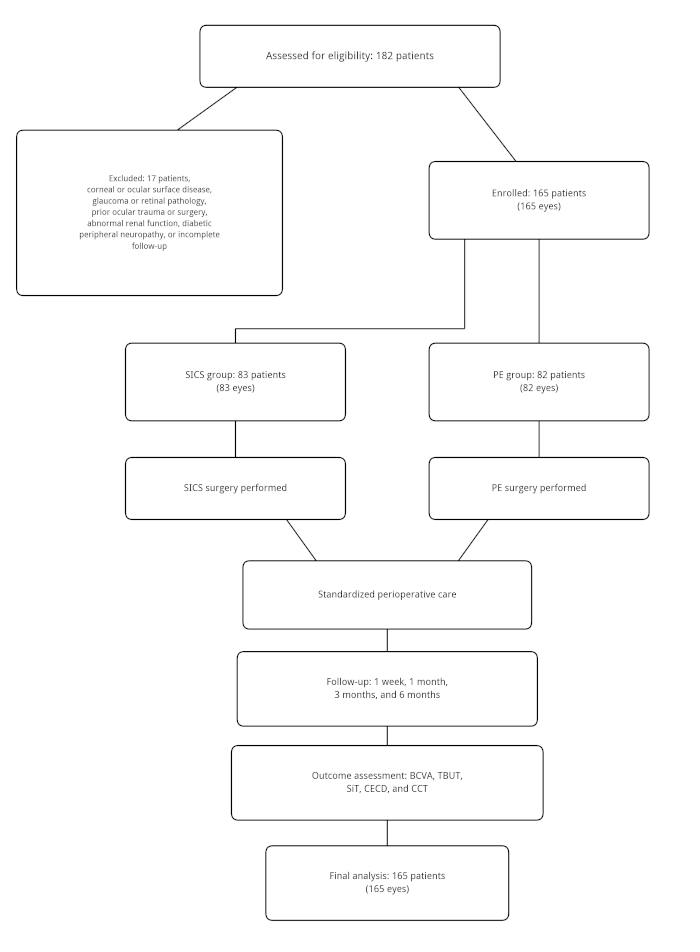
Figure 1: Study workflow. Workflow of participant enrollment, eligibility assessment, group allocation, surgical procedures, postoperative assessments, and follow-up for patients undergoing small-incision cataract surgery (SICS) or phacoemulsification (PE). Follow-up examinations were performed at 1 week, 1 month, 3 months, and 6 months postoperatively. Please click here to view a larger version of this figure.
1. Study participants
This retrospective case-control study enrolled 165 patients (165 eyes) with age-related cataracts who underwent surgery in the Department of Ophthalmology, Beijing Tongren Hospital, Mentougou Campus, Beijing, China, between January 2021 and February 2023. All cataract surgeries and perioperative clinical assessments were performed at Beijing Tongren Hospital, Mentougou Campus, and the study data were reviewed under the ethics oversight of Beijing Tsinghua Changgung Hospital. Eighty-three patients underwent small-incision cataract surgery (SICS group), and 82 underwent phacoemulsification (PE group). The sample size was calculated using G*Power with α = 0.05 and a power of 0.95, yielding a minimum requirement of 134 cases. Therefore, the final sample size of 165 cases was considered adequate.
Eligible participants had age-related cataracts diagnosed according to the Clinical Guidelines of Ophthalmology (China)10 and type 2 diabetes mellitus diagnosed according to the China Guideline for Type 2 Diabetes (2020 Edition)11. Additional eligibility requirements included lens nuclear hardness grade III or IV according to the Emery–Little classification, supplemented by quantitative lens density grading; fasting venous blood glucose < 8.0 mmol/L on two consecutive measurements before surgery; corneal endothelial cell density (CECD) ≥ 2,000 cells/mm2 with a hexagonal cell ratio > 50%; complete preoperative, intraoperative, and 6-month postoperative follow-up data; and uncomplicated surgery without posterior capsular rupture. Routine written consent for cataract surgery was obtained as part of standard clinical care, whereas study-specific research consent was waived because of the retrospective study design.
Patients were excluded if they had corneal astigmatism, keratoconjunctival disease, keratoconus, iritis, glaucoma, significant vitreous opacity, macular edema, high myopia with fundus lesions, other systemic or ocular contraindications, a history of ocular trauma or intraocular surgery, diabetic retinopathy or other retinal pathology affecting vision, abnormal renal function, diabetic peripheral neuropathy, or moderate-to-severe preoperative dry eye disease or ocular surface disease.
2. Surgical procedures
Preoperative evaluations included intraocular lens (IOL) power calculation using the SRK/T formula, slit-lamp biomicroscopy, noncontact specular microscopy, and anterior segment optical coherence tomography (AS-OCT). All surgeries were performed by the same senior surgeon under topical anesthesia.
In the SICS group, a 5.5 mm scleral tunnel incision, continuous curvilinear capsulorhexis, hydrodissection, nucleus delivery, cortical aspiration, and IOL implantation were performed. The incision was closed in a watertight manner. Operative duration and nuclear delivery difficulty grading were recorded.
In the PE group, a 3.0 mm clear corneal incision, continuous curvilinear capsulorhexis, phacoemulsification of the lens nucleus, cortical aspiration, and IOL implantation were performed. The incision was hydrated for closure. Operative duration, cumulative dissipated energy (CDE), intraoperative ultrasound power, quantitative phacoemulsification parameters, and balanced salt solution (BSS) irrigation volume were recorded.
Postoperative medications were standardized for all patients and consisted of levofloxacin eye drops four times daily for 2 weeks, prednisolone acetate eye drops four times daily, tapered over 4 weeks, pranoprofen eye drops four times daily for 4 weeks, and recombinant bovine basic fibroblast growth factor ophthalmic gel twice daily for 4 weeks. The postoperative medication regimen was identical in both groups. Intraocular pressure > 21 mmHg was managed with antiglaucoma medications.
3. Outcome measures
Patients were evaluated preoperatively and at 1 week and 1, 3, and 6 months postoperatively. At each visit, best-corrected visual acuity (BCVA), tear film break-up time (TBUT), Schirmer I test (SIT), corneal endothelial cell density (CECD), and central corneal thickness (CCT) were assessed. BCVA values were converted to logarithm of the minimum angle of resolution (LogMAR) units for statistical analysis.
TBUT was measured using fluorescein staining. A sterile fluorescein strip was moistened with one drop of topical antibiotic solution and applied to the inferior conjunctival sac. After gentle blinking, TBUT was measured under cobalt blue illumination. Three consecutive measurements were obtained and averaged for analysis. The same procedure was used for all participants at all study visits.
SIT was performed without topical anesthesia. A standardized Schirmer strip was placed in the lateral third of the lower conjunctival sac, and patients were instructed to gently close their eyes for 5 min without squeezing. The wetted length was recorded in millimeters. All SIT measurements were performed by the same experienced technician.
CECD was measured using noncontact specular microscopy, and three central images were averaged. CCT was measured using AS-OCT. To minimize physiological variability, CECD and CCT measurements were performed between 9:00 and 11:00 AM in a temperature-controlled examination room. Examiners were masked to group allocation and followed identical acquisition procedures throughout the study.
4. Statistical analysis
Data were analyzed using SPSS. Categorical variables were analyzed using the chi-square test. Continuous variables are presented as mean ± standard deviation ( ± s) and were analyzed using the independent-samples t-test. Repeated-measures analysis of variance (RM-ANOVA) was performed for each primary endpoint (BCVA, TBUT, SIT, CECD, and CCT) to quantify three statistical effects separately: Firstly, the main time effect (within-subject change across follow-up visits), secondly, the main group effect (overall difference between SICS and PE regardless of time), and lastly, the group × time interaction effect (differences in postoperative change trajectories between the two surgical groups). Sphericity testing was performed, and the Greenhouse–Geisser correction was applied when the sphericity assumption was violated. A Bonferroni post hoc correction was used for pairwise within-group comparisons with the preoperative baseline and for comparisons between consecutive follow-up time points. Exact F-statistics and P-values are reported for the time, group, and interaction effects of each RM-ANOVA. Group × time interactions were assessed. A P value < 0.05 was considered statistically significant.
Results
Baseline characteristics
A total of 165 patients (165 eyes) were included, comprising 79 men (79 eyes) and 86 women (86 eyes), with an overall mean age of 65.33 ± 5.09 years (range, 56.3–74.9 years). The baseline clinical characteristics of the SICS and PE groups are presented in Table 1. No statistically significant differences were observed between the groups with respect to sex, age, duration of diabetes, cataract severity, quantitative lens density, glycated hemoglobin (HbA1c), diabetic retinopathy status, renal function (estimated glomerular filtration rate [eGFR]), diabetic peripheral neuropathy status, or preoperative ocular surface disease severity (all P > 0.05).
| Parameter | SICS Group (n = 83) | PE Group (n = 82) | Statistic | P-value |
| Sex (male, n) | 41 | 38 | χ² = 0.24 | 0.62 |
| Age (years, mean ± SD) | 64.72 ± 4.91 | 65.94 ± 5.22 | t = -1.56 | 0.12 |
| Duration of diabetes (years, mean ± SD) | 14.61 ± 2.99 | 14.77 ± 3.07 | t = -0.34 | 0.74 |
| Cataract severity (grade, mean ± SD) | 3.51 ± 0.50 | 3.55 ± 0.50 | t = -0.52 | 0.6 |
| Glycated hemoglobin (HbA1c, %, mean ± SD) | 7.32 ± 0.61 | 7.38 ± 0.65 | t = -0.58 | 0.56 |
| Diabetic retinopathy status (n, %) | No DR: 83 (100%) | No DR: 82 (100%) | — | 1 |
| Renal function (eGFR) | 92.45 ± 8.36 | 93.11 ± 8.72 | t = -0.49 | 0.63 |
| Diabetic peripheral neuropathy status (n, %) | Absent: 83 (100%) | Absent: 82 (100%) | — | 1 |
| Preoperative dry eye severity grade (n, %) | Mild: 83 (100%) | Mild: 82 (100%) | — | 1 |
| Quantitative lens density (AU, mean ± SD) | 18.62 ± 2.14 | 18.75 ± 2.21 | t = -0.41 | 0.68 |
| Note: Continuous variables are expressed as mean ± SD; categorical variables are presented as count (percentage). The independent-samples t-test was used for continuous variables, and the chi-square test was used for categorical variables. eGFR is reported in mL/min/1.73 m². HbA1c, glycated hemoglobin; DR, diabetic retinopathy; AU, arbitrary units. | ||||
Table 1: Baseline characteristics. Comparison of baseline demographic and clinical characteristics between the SICS (n = 83) and PE (n = 82) groups. Data are presented as mean ± SD unless otherwise indicated. HbA1c, glycated hemoglobin; DR, diabetic retinopathy; eGFR, estimated glomerular filtration rate; AU, arbitrary units. The chi-square test was used for categorical variables, and the independent-samples t-test was used for continuous variables.
Best-corrected visual acuity
Changes in BCVA are presented in Table 2. All 83 eyes in the SICS group and all 82 eyes in the PE group were analyzed throughout the study, including at baseline and at 1 week and 1, 3, and 6 months postoperatively. No statistically significant between-group differences were observed at baseline or at any postoperative time point (all P > 0.05). RM-ANOVA of LogMar BCVA revealed a significant main time effect (F = 156.38, P < 0.001), a non-significant main group effect (F = 0.74, P = 0.391), and a non-significant group × time interaction (F = 0.62, P = 0.573). Significant changes over time were observed within both groups (all P < 0.05). Compared with baseline values, BCVA improved significantly at 1 week, 1 month, 3 months, and 6 months postoperatively in both groups (all P < 0.05). BCVA at 1 month was significantly improved compared with that at 1 week postoperatively (P < 0.05), whereas no statistically significant differences were observed among the later postoperative time points (all P > 0.05).
| Group | Preoperative | 1 Week Postoperative | 1 Month Postoperative | 3 Months Postoperative | 6 Months Postoperative |
| SICS | 0.76 ± 0.12 | 0.16 ± 0.05* | 0.17 ± 0.06*# | 0.16 ± 0.04* | 0.17 ± 0.05* |
| PE | 0.79 ± 0.25 | 0.17 ± 0.04* | 0.16 ± 0.05*# | 0.15 ± 0.05* | 0.16 ± 0.04* |
| Note: All data are presented as mean ± SD. SICS: small-incision cataract surgery, PE: phacoemulsification | |||||
| *P < 0.05 versus preoperative baseline value; #P < 0.05 versus 1 week postoperative value. | |||||
| RM-ANOVA for BCVA: time effect F = 156.38, P < 0.001; group effect F = 0.74, P = 0.391; group × time interaction effect F = 0.62, P = 0.573. | |||||
| Repeated-measures ANOVA with Bonferroni correction was applied for within-group and between-group comparisons. | |||||
Table 2: Best-corrected visual acuity. Comparison of preoperative and postoperative best-corrected visual acuity (BCVA; LogMar) between the SICS (n = 83) and PE (n = 82) groups. Measurements were obtained preoperatively and at 1 week, 1 month, 3 months, and 6 months postoperatively. Repeated-measures analysis of variance (RM-ANOVA) with Bonferroni correction was used for within-group comparisons. *P < 0.05 versus preoperative; #P < 0.05 versus 1 week postoperatively.
Tear film break-up time
TBUT results are presented in Table 3. No statistically significant between-group differences were observed at baseline or at any postoperative time point (all P > 0.05). RM-ANOVA of TBUT demonstrated a significant main time effect (F = 131.75, P < 0.001), a non-significant main group effect (F = 0.41, P = 0.522), and a non-significant group × time interaction (F = 0.59, P = 0.602). Significant changes over time were observed within both groups (all P < 0.05). Compared with baseline values, TBUT decreased significantly at 1 week, 1 month, and 3 months postoperatively in both groups (all P < 0.05). By 6 months postoperatively, TBUT values had returned to baseline levels.
Schirmer I Test
SIT results are presented in Table 3. No statistically significant between-group differences were observed at any time point (all P > 0.05). RM-ANOVA of SIT showed a significant main time effect (F = 124.92, P < 0.001), a non-significant main group effect (F = 0.28, P = 0.597), and a non-significant group × time interaction (F = 0.45, P = 0.718). Significant changes over time were observed within both groups (all P < 0.05). Compared with baseline values, SIT measurements decreased significantly at 1 week, 1 month, and 3 months postoperatively (all P < 0.05). No statistically significant differences from baseline were observed at 6 months postoperatively (P > 0.05).
| Index | SICS Group | PE Group | t | P |
| TBUT (s) | ||||
| Preoperative | 8.12 ± 4.12 | 8.20 ± 3.25 | t = -0.21 | 0.83 |
| 1 Week Postoperative | 3.16 ± 3.05* | 3.27 ± 2.54* | t = 0.26 | 0.8 |
| 1 Month Postoperative | 5.17 ± 3.16* | 5.46 ± 3.05* | t = 0.56 | 0.58 |
| 3 Months Postoperative | 6.86 ± 4.08* | 6.75 ± 3.95* | t = -0.17 | 0.87 |
| 6 Months Postoperative | 8.07 ± 3.05 | 8.16 ± 4.06 | t = 0.16 | 0.87 |
| SIT (mm) | ||||
| Preoperative | 10.01 ± 4.12 | 10.10 ± 4.25 | t = 0.13 | 0.9 |
| 1 Week Postoperative | 5.96 ± 3.73* | 6.07 ± 3.14* | t = 0.19 | 0.85 |
| 1 Month Postoperative | 7.17 ± 4.06* | 6.96 ± 3.97* | t = -0.32 | 0.75 |
| 3 Months Postoperative | 7.97 ± 5.09* | 8.01 ± 4.93* | t = 0.05 | 0.96 |
| 6 Months Postoperative | 9.97 ± 5.01 | 9.86 ± 4.93 | t = -0.14 | 0.89 |
| Note: All data are expressed as mean ± SD. *P < 0.05 versus preoperative baseline value. | ||||
| RM-ANOVA for TBUT: time effect F = 131.75, P < 0.001; group effect F = 0.41, P = 0.522; interaction effect F = 0.59, P = 0.602. | ||||
| RM-ANOVA for SIT: time effect F = 124.92, P < 0.001; group effect F = 0.28, P = 0.597; interaction effect F = 0.45, P = 0.718. | ||||
| Repeated-measures ANOVA with Bonferroni correction was applied for within-group and between-group comparisons. | ||||
Table 3: Tear film break-up time and Schirmer I test. Comparison of preoperative and postoperative tear film break-up time (TBUT, s) and Schirmer I test (SIT, mm) between the SICS (n = 83) and PE (n = 82) groups. Measurements were obtained preoperatively and at 1 week, 1 month, 3 months, and 6 months postoperatively. Repeated-measures analysis of variance (RM-ANOVA) with Bonferroni correction was used for within-group comparisons. *P < 0.05 versus preoperative.
Corneal endothelial cell density
CECD results are presented in Table 4. No statistically significant between-group differences were detected at baseline, 3 months, or 6 months postoperatively (all P > 0.05). However, statistically significant between-group differences were observed at 1 week (t = 2.67, P = 0.008) and 1 month (t = 2.89, P = 0.004) postoperatively, with slightly higher CECD values in the PE group. RM-ANOVA of CECD yielded a significant main time effect (F = 217.54, P < 0.001), a non-significant main group effect (F = 1.08, P = 0.300), and a non-significant group × time interaction (F = 0.86, P = 0.445). Significant changes over time were observed within both groups (all P < 0.05). Compared with baseline values, CECD decreased significantly at 1 week, 1 month, 3 months, and 6 months postoperatively in both groups (all P < 0.05).
| Index | SICS Group | PE Group | t | P |
| CECD (cells/mm²) | ||||
| Preoperative | 2969.12 ± 73.34 | 2973.10 ± 74.25 | t = 0.32 | 0.75 |
| 1 Week Postoperative | 2475.96 ± 43.73* | 2496.17 ± 51.13* | t = 2.67 | 0.008 |
| 1 Month Postoperative | 2407.27 ± 41.06* | 2426.96 ± 43.97* | t = 2.89 | 0.004 |
| 3 Months Postoperative | 2382.97 ± 39.09* | 2393.01 ± 40.93* | t = 1.63 | 0.1 |
| 6 Months Postoperative | 2380.07 ± 39.81* | 2391.16 ± 40.93* | t = 1.67 | 0.1 |
| CCT (μm) | ||||
| Preoperative | 527.32 ± 37.35 | 531.12 ± 34.26 | t = 0.66 | 0.51 |
| 1 Week Postoperative | 546.96 ± 35.73* | 545.27 ± 40.13* | t = -0.27 | 0.79 |
| 1 Month Postoperative | 528.27 ± 41.03 | 532.06 ± 43.07 | t = 0.57 | 0.57 |
| 3 Months Postoperative | 527.97 ± 39.79 | 531.59 ± 38.83 | t = 0.59 | 0.56 |
| 6 Months Postoperative | 527.37 ± 36.81 | 531.16 ± 30.93 | t = 0.68 | 0.5 |
| Note: Data are presented as mean ± SD. *P < 0.05 versus preoperative baseline value. | ||||
| RM-ANOVA for CECD: time effect F = 217.54, P < 0.001; group effect F = 1.08, P = 0.300; interaction effect F = 0.86, P = 0.445. | ||||
| RM-ANOVA for CCT: time effect F = 128.66, P < 0.001; group effect F = 0.65, P = 0.420; interaction effect F = 0.37, P = 0.789. | ||||
| Repeated-measures ANOVA with Bonferroni correction was applied for within-group and between-group comparisons. | ||||
Table 4: Corneal endothelial cell density and central corneal thickness. Comparison of preoperative and postoperative corneal endothelial cell density (CECD, cells/mm2) and central corneal thickness (CCT, µm) between the SICS (n = 83) and PE (n = 82) groups. Measurements were obtained preoperatively and at 1 week, 1 month, 3 months, and 6 months postoperatively. Repeated-measures analysis of variance (RM-ANOVA) with Bonferroni correction was used for within-group comparisons. *P < 0.05 versus preoperative.
Central corneal thickness
CCT results are presented in Table 4. In both groups, CCT increased significantly at 1 week postoperatively compared with baseline values (P < 0.05). RM-ANOVA of CCT identified a significant main time effect (F = 128.66, P < 0.001), a non-significant main group effect (F = 0.65, P = 0.420), and a non-significant group × time interaction (F = 0.37, P = 0.789). No statistically significant differences from baseline were observed at 1, 3, or 6 months postoperatively (all P > 0.05).
DATA AVAILABILITY:
The raw data supporting the results of this study were uploaded as Supplementary File 1.
Supplementary File 1: The raw dataset for this protocol. Please click here to download this file.
Discussion
Cataracts are among the most common conditions encountered in ophthalmic practice and represent a major ocular complication in individuals with diabetes. Given their close association with aging, they are commonly referred to as age-related cataracts. As the prevalence of diabetes continues to increase, diabetic cataracts have become increasingly common. In patients with diabetes, systemic microvascular and metabolic abnormalities affect the ocular microcirculation, reducing corneal endothelial reserve and disrupting neurotrophic support. As a result, these patients may have reduced tolerance to surgical trauma and are more likely to experience postoperative ocular surface disturbances and corneal edema, with slower recovery6,7. In addition, patients with diabetes are at increased risk of postoperative corneal edema8. These factors highlight the importance of selecting a surgical approach that minimizes ocular surface and corneal injury. The present study evaluated postoperative visual acuity, tear film stability, and corneal endothelial changes in patients with long-standing T2DM who underwent either SICS or PE.
Tear film stability is essential for maintaining normal ocular surface structure and function. Tear film break-up time (TBUT) is commonly used to assess tear film integrity, with lower values indicating greater instability. Reduced tear film stability is more frequently observed in patients with diabetes than in individuals without diabetes9. In the present study, both groups demonstrated preoperative TBUT values below the normal threshold (<10 s), which may reflect baseline diabetic ocular surface disease and age-related reductions in lacrimal gland function. Following surgery, TBUT decreased further and did not return to baseline until 6 months postoperatively. Previous studies in patients without diabetes have reported recovery of TBUT to baseline levels as early as 1 month after surgery12, suggesting that tear film restoration may be slower in patients with diabetes13.
Tear secretion is another important indicator of ocular surface health. Previous studies have shown that patients with diabetes are more susceptible to dry eye disease than individuals without diabetes14,15. In the present study, SIT values decreased significantly after surgery and did not return to baseline until the 6-month follow-up visit. The postoperative reductions in TBUT and SIT suggest a transient deterioration in ocular surface function following cataract surgery. Surgical incisions may disrupt ocular surface regularity and reduce tear film stability. In addition, mechanical injury to corneal nerves and inflammation induced by surgical trauma may contribute to postoperative dry eye symptoms16,17.
No statistically significant between-group differences were observed in TBUT or SIT at any postoperative time point. The standardized postoperative regimen, including recombinant bovine basic fibroblast growth factor ophthalmic gel, may have promoted epithelial healing and reduced observable differences between groups. When advanced age and diabetes coexist, ocular surface defense mechanisms may be further compromised, endothelial cell reserve may be reduced, and tissue repair may be impaired following injury.
Phacoemulsification offers advantages such as a small incision and rapid postoperative recovery. However, ultrasound energy used during the procedure may contribute to corneal endothelial injury18,19. Small-incision cataract surgery remains a cost-effective and accessible technique, particularly in primary care and resource-limited settings. Nevertheless, endothelial injury may also occur during SICS due to repeated instrument manipulation within the anterior chamber and the larger incision size, which may increase the risk of instrument–endothelium contact under conditions of anterior chamber instability20,21.
Patients with diabetes generally exhibit reduced tolerance to corneal endothelial stress, and surgical manipulation may further exacerbate endothelial injury22,23,24. In the present study, CECD decreased significantly in both groups after surgery and stabilized by approximately 3 months postoperatively. Although the PE group showed slightly higher CECD values at 1 week and 1 month postoperatively (P = 0.008 and P = 0.004, respectively), the difference between groups was no longer statistically significant at 3 or 6 months (both P > 0.05). The apparent increase in CECD between 1 week and 3 months postoperatively likely reflects measurement variability and endothelial cell redistribution rather than true endothelial regeneration. Similarly, CCT increased significantly during the early postoperative period and returned to baseline levels by 1 month, with no statistically significant between-group differences. These findings are consistent with transient corneal responses to surgical trauma.
Both groups demonstrated significant improvements in visual acuity following surgery, with BCVA stabilizing by 1 month postoperatively. No statistically significant differences in postoperative visual acuity were observed between the two surgical approaches during follow-up. Postoperative visual recovery depends on multiple factors, including corneal transparency, endothelial pump function, and epithelial integrity. In addition, BCVA outcomes may be influenced by factors not evaluated in the present study, including IOL selection, mini-monovision strategies, and iatrogenic anisometropia25,26.
Regarding ocular surface assessment, TBUT was measured using fluorescein strips moistened with a drop of antibiotic solution, a nonstandard technique. Although this procedure was applied consistently throughout the study, the antibiotic solution may theoretically influence tear film osmolarity or surface tension, thereby affecting TBUT measurements. Future studies may consider using sterile balanced salt solution to minimize this potential source of variability.
For SIT measurements, environmental conditions were controlled; however, detailed parameters, such as room airflow and blink-restriction protocols, were not documented. Similarly, although CECD and CCT measurements were performed at comparable times of day and examiners were masked to treatment allocation, formal repeatability testing was not performed in the study cohort. These factors may have introduced minor measurement variability.
This retrospective, nonrandomized observational study is subject to inherent limitations. Although no statistically significant baseline differences were observed between groups, the study design may permit residual confounding, and baseline comparability should be interpreted with caution. Surgical technique selection was based on surgeon preference, patient economic status, and available clinical resources, introducing the potential for selection bias. Although HbA1c was recorded, detailed stratified analyses according to glycemic control were not performed. Furthermore, diabetic retinopathy status, renal function, and preoperative ocular surface disease severity were not analyzed in a stratified manner. Residual confounding, therefore, cannot be excluded. The follow-up period was limited to 6 months, and longer-term outcomes remain uncertain. Finally, the findings may not be applicable to patients with shorter durations of diabetes, poor glycemic control, or advanced diabetic eye disease.
This study provides observational data regarding anterior segment outcomes following SICS and PE in patients with long-standing T2DM. Most outcomes were comparable between the two techniques; CECD was transiently lower after SICS at 1 week and 1 month, but this difference was not sustained at 3 or 6 months. These findings may be applicable to patients with age-related cataracts and long-standing (≥ 10 years) T2DM who do not have severe ocular comorbidities. Future studies should incorporate prospective randomized designs, stratified analyses according to glycemic control, longer follow-up periods, and evaluation of surgically induced astigmatism and phacoemulsification energy parameters.
Conclusion
In patients with age-related cataracts and long-standing type 2 diabetes mellitus, both SICS and phacoemulsification achieved substantial visual improvement and showed similar postoperative ocular surface recovery and corneal thickness outcomes during the 6-month follow-up period. Although CECD was lower in the SICS group at 1 week and 1 month postoperatively, the between-group difference was not sustained at later follow-up visits.
Disclosures
The authors declare no personal, financial, commercial, or academic conflicts of interest.
Acknowledgements
The authors thank all patients and medical staff who participated in this study. No external funding was received for this work.
Materials
| Name | Company | Catalog Number | Comments |
|---|---|---|---|
| Antiglaucoma medication (timolol maleate eye drops) | Merck & Co., Inc., USA | Catalog No. TM-0.5% | Used for postoperative intraocular pressure control |
| Balanced salt solution (BSS) | Alcon Laboratories, Inc., USA | Catalog No. BSS-500ML | Intraoperative irrigation fluid |
| Fluorescein test strips | Tianjin Jingming New Technology Development Co., Ltd., China | Catalog No. J1001 | Used for tear film break-up time (TBUT) measurement |
| G*Power Statistical Power Analysis Software | Heinrich Heine University Düsseldorf, Germany | Version 3.1 | Used to calculate the minimum required sample size |
| Hess–Rabe noncontact specular microscope | Tomey, Nagoya, Japan | Model EM3000 | Used for corneal endothelial cell density (CECD) measurement |
| Intraocular lens (IOL, monofocal foldable) | Alcon Laboratories, Inc., USA | Model SN60WF | Implanted during cataract surgery |
| Levofloxacin eye drops | Sinopharm Group Co., Ltd., China | Lot No. LF20240915 | Postoperative anti-infective medication |
| Pranoprofen eye drops | Senju Pharmaceutical Co., Ltd., Japan | Catalog No. PRN-05 | Postoperative anti-inflammatory medication |
| Prednisolone acetate eye drops | Allergan Pharmaceuticals, USA | Catalog No. PRED-10ML | Postoperative anti-inflammatory medication |
| Recombinant bovine basic fibroblast growth factor ophthalmic gel | Changchun GeneScience Pharmaceuticals Co., Ltd., China | Catalog No. bFGF-GEL-5G | Used for postoperative corneal epithelial repair |
| Slit-lamp biomicroscope | Haag-Streit, Switzerland | Model BX90 | Used for preoperative and postoperative anterior segment examination |
| SPSS Statistics Software | IBM Corp., Armonk, NY, USA | Version 21.0 | Used for chi-square tests, independent-samples t-tests, repeated-measures ANOVA, Greenhouse–Geisser correction, and Bonferroni post hoc comparisons |
| Standard Schirmer I test strips | Tianjin Jingming New Technology Development Co., Ltd., China | Catalog No. S1003 | Used for Schirmer I tear secretion testing without topical anesthesia |
| Visante AS-OCT system | Carl Zeiss Meditec, Jena, Germany | Model 1000 | Used for central corneal thickness (CCT) measurement |
References
- Saeedi P, et al. Global and regional diabetes prevalence estimates for 2019 and projections for 2030 and 2045: Results from the International Diabetes Federation Diabetes Atlas, 9th edition. Diabetes Res Clin Pract. 2019;157:107843. doi:10.1016/j.diabres.2019.107843
- Ang MJ, Afshari NA. Cataract and systemic disease: A review. Clin Exp Ophthalmol. 2021;49:118–127.
- Yao K, Wang W. A summary of 70 years of cataract diagnosis and treatment in China. Chin J Ophthalmol. 2020;56:321–324.
- Wu BC, et al. Comparison of small-incision cataract surgery and phacoemulsification. Int Eye Sci. 2015;5:883–886.
- Wu ZD, et al. Efficacy of small-incision horizontal space nuclear splitting surgery versus phacoemulsification in patients with age-related cataracts. Chin J Gerontol. 2021;41:3471–3473.
- Sahu PK, et al. Dry eye following phacoemulsification surgery and its relation to associated intraoperative risk factors. Middle East Afr J Ophthalmol. 2015;22:472–477.
- Zou X, et al. Prevalence and clinical characteristics of dry eye disease in community-based type 2 diabetic patients: The Beixinjing Eye Study. BMC Ophthalmol. 2018;18:117. doi:10.1186/s12886-018-0781-7
- Shi YM, Yang J, Li GQ. Advances in the management of cataract surgery in patients with diabetes. Int Eye Sci. 2021;21:458–461.
- Wang SS, et al. Noninvasive and comprehensive observation of ocular surface characteristics after cataract surgery in patients with type 2 diabetes mellitus. J Clin Ophthalmol. 2020;28:390–394.
- Chinese Medical Association. Clinical guidelines of ophthalmology: ophthalmology volume. Beijing: People's Medical Publishing House; 2006.
- Chinese Diabetes Society. Guideline for the prevention and treatment of type 2 diabetes mellitus in China (2020 edition). Chin J Diabetes Mellitus. 2021;13(4):315–409. doi:10.3760/cma.j.cn115791-20210221-00095
- Zhu TF, et al. Influence on ocular surface of patients with cataract and diabetes after cataract phacoemulsification. Int Eye Sci. 2016;16:2209–2212.
- Song XH, et al. Changes in cornea after phacoemulsification in diabetic patients. Recent Adv Ophthalmol. 2017;37:860–862.
- Qian L, Wei W. Identified risk factors for dry eye syndrome: A systematic review and meta-analysis. PLoS One. 2022;17:e0271267. doi:10.1371/journal.pone.0271267
- Garzón-Parra SJ, López-Alemany A, Gené-Sampedro A. Correlation between type 2 diabetes, dry eye and Meibomian glands dysfunction. J Optom. 2019;12:256–262.
- He ZB, et al. Effect of phacoemulsification on ocular surface and corneal endothelial cells in cataract patients with diabetes mellitus. Int Eye Sci. 2017;17:2229–2233.
- Naderi K, Gormley J, O'Brart D. Cataract surgery and dry eye disease: A review. Eur J Ophthalmol. 2020;30:840–855.
- Li N, et al. A comparative study of the effect of phacoemulsification and small-incision cataract surgery on corneal endothelial cells. Chin J Gen Pract. 2017;15:1666–1668.
- Aynala A, Pradeep TG. A clinical study of immediate postoperative corneal edema in patients undergoing minor incision cataract surgery in a teaching hospital. Rom J Ophthalmol. 2024;68:379–384.
- Chu YL, Zuo XC. Effects of two cataract surgery methods on corneal endothelial cells in patients with diabetes mellitus and cataract. Int Eye Sci. 2019;19:971–974.
- Ruit S, Gurung R, Vyas S. The role of small-incision sutureless cataract surgery in the developed world. Curr Opin Ophthalmol. 2018;29:105–109.
- Kang S, Hsu J, Yoo SH. Pseudophakic mini-monovision. Surv Ophthalmol. 2025 Nov 11:S0039-6257(25)00212-7. doi:10.1016/j.survophthal.2025.11.010.
- Chen KY, Chan HC, Chan CM. Is thermal pulsation therapy effective for dry eyes before and after cataract surgery? A systematic review and meta-analysis. Clin Ophthalmol. 2025;19:19–33.
- Chen KY, Chan HC, Chan CM. Is there a link between dry eye disease and diabetes mellitus? A systematic review and meta-analysis. J Diabetes Complications. 2025;39:109149. doi:10.1016/j.jdiacomp.2025.109149
- Chen KY, Chan HC, Chan CM. Do people with diabetes have a higher risk of developing postoperative endophthalmitis after cataract surgery? A systematic review and meta-analysis. J Ophthalmic Inflamm Infect. 2025;15:24. doi:10.1186/s12348-025-00483-9
- Tang Y, et al. Clinical evaluation of corneal changes after phacoemulsification in diabetic and non-diabetic cataract patients: A systematic review and meta-analysis. Sci Rep. 2017;7:14128. doi:10.1038/s41598-017-14656-7