This study investigated mitochondrial oxidative stress–related genes associated with therapeutic resistance in HER2-positive breast cancer. Using transcriptomic datasets, integrated bioinformatics, and clinical data (n = 4,929), the authors identified MTHFD2 and PRDX3 as key differentially expressed genes with potential prognostic value. In silico. analyses suggest functional effects of genetic variants.
A subscription to JoVE is required to view this content. Sign in or start your free trial.
Research Article
Identification of Hub Genes, Single-Nucleotide Polymorphisms, and Potential Drug Targets In Breast Cancer Using Transcriptomic Analysis
In This Article
Summary
Abstract
HER2-positive (HER2+) breast cancer often develops resistance to therapies like Lapatinib, potentially involving mitochondrial metabolic and redox reprogramming. This study aimed to identify mitochondrial oxidative stress–related genes (MOS-DEGs) as biomarkers of resistance and to characterize their functional nsSNPs and structural impacts. RNA-seq datasets (GSE231524, GSE231525) were analyzed using DESeq2 to identify DEGs, which were intersected with mitochondrial oxidative stress genes to obtain MOS-DEGs. Functional enrichment, PPI analysis, ROC analysis, expression profiling, and survival analysis were performed. nsSNPs were evaluated using multiple predictive tools, and structural impacts were assessed through secondary and 3D modeling. Integrated transcriptomic and clinical analysis identified MTHFD2 and PRDX3 as central MOS-DEGs displaying opposing regulatory roles in mitochondrial redox metabolism. MTHFD2 was significantly upregulated and associated with poor prognosis (HR = 1.53, p = 1.1 × 10⁻16), while PRDX3 exhibited protective expression patterns (HR = 0.73, p = 7.7×10⁻10). ROC analysis suggested their potential as predictors of therapeutic response. nsSNP analysis revealed five deleterious variants in MTHFD2 and four deleterious variants in PRDX3, with rs1471336772 (MTHFD2) and rs747786383 (PRDX3.) identified as the most pathogenic. These variants were predicted to be damaging based on multiple computational scoring systems, including SIFT ≤ 0.05, PolyPhen-2 ≥ 0.85, deleterious CADD scores, and high REVEL scores, and were located within catalytic or redox-active domains. Structural modeling suggested that these substitutions may destabilize conformation, disrupt metal- and cofactor-binding sites, and affect NADPH regeneration or thioredoxin-dependent peroxidase activity. Molecular dynamics predictions indicated potential loss of structural stability and altered flexibility, suggesting possible functional impairment of mitochondrial redox control. This study identifies MTHFD2 and PRDX3 as regulators of mitochondrial oxidative stress in HER2+ breast cancer. Deleterious nsSNPs in these genes may contribute to altered redox balance, potentially influencing metabolic adaptation (MTHFD2) and antioxidant defense (PRDX3).
Introduction
Breast cancer is the most commonly diagnosed cancer in women worldwide and a major cause of cancer-related death despite substantial progress in early detection and targeted therapeutics1,2,3. Molecular heterogeneity within breast tumors underlies diverse clinical outcomes and treatment responses, posing persistent challenges for precision oncology4,5. Among the recognized molecular subtypes, human epidermal growth factor receptor 2 (HER2)-positive breast cancer accounts for approximately 15–20% of all breast cancers and is characterized by HER2 gene amplification and overexpression of the HER2 receptor tyrosine kinase6,7. Although HER2-targeted therapies, such as trastuzumab and lapatinib, have markedly improved patient prognosis, primary and acquired resistance to these agents frequently emerges, leading to tumor relapse and disease progression8,9. Understanding the molecular mechanisms driving HER2 therapy resistance, therefore, remains a major unmet need in clinical oncology.
Emerging evidence suggests that mitochondrial dysfunction and oxidative stress play critical roles in mediating drug resistance in breast cancer. Mitochondria, beyond their canonical role in ATP production, are key regulators of apoptosis, redox signaling, and metabolic plasticity—all processes that cancer cells exploit to survive therapeutic pressure. In particular, resistant HER2+ cancer cells demonstrate a metabolic shift toward oxidative phosphorylation (OXPHOS), enhanced reactive oxygen species (ROS) buffering, and altered mitochondrial biogenesis. These adaptations enable cells to maintain survival signaling and evade apoptosis despite sustained inhibition of HER2 signaling pathways. Genes encoding mitochondrial complex subunits and redox-regulating enzymes are therefore potential biomarkers and therapeutic targets for overcoming resistance.
In parallel, non-synonymous single-nucleotide polymorphisms (nsSNPs) in mitochondrial or oxidative stress-related genes can modify protein structure and function, influencing enzyme activity, drug response, and disease susceptibility10. Computational prediction of the deleterious effects of nsSNPs using in silico.tools such as SIFT, PolyPhen-2, and CADD provides a rapid means of identifying functional variants that may contribute to cancer heterogeneity and therapeutic resistance. Integrating transcriptomic and mutational data thus offers a multidimensional view of gene dysregulation and structural alteration at both transcriptional and genomic levels.
Recent advances in bioinformatics and systems biology have enabled the high-throughput identification of potential driver genes through large-scale expression profiling and network-based analysis. Public repositories such as the Gene Expression Omnibus (GEO) provide valuable RNA-sequencing datasets that capture molecular changes across experimental models and patient cohorts. Coupled with analytical tools such as DESeq2, clusterProfiler, and STRING–Cytoscape network analysis, these resources enable comprehensive characterization of differentially expressed genes (DEGs), pathway enrichment, and hub gene discovery. Importantly, integrating mitochondrial oxidative stress gene signatures with DEGs can illuminate novel molecular mechanisms underlying HER2-targeted therapy resistance and identify candidate biomarkers for therapeutic intervention.
The HER3-driven resistance axis has recently gained attention as a major compensatory pathway following HER2 inhibition. HER3 activation restores downstream PI3K/AKT signaling, promoting cellular survival and drug tolerance (Figure 1). The DUSP6 (Dual Specificity Phosphatase 6), a negative regulator of ERK signaling, has been implicated in modulating this adaptive response. Inhibition of DUSP6 reactivates ERK signaling and may counteract HER3-mediated resistance, but its interplay with mitochondrial oxidative stress and metabolic adaptation remains insufficiently understood. Therefore, comparative transcriptomic analyses of HER2+ cell lines (BT474 and MDA-MB-453) under DUSP6 inhibition and chronic Lapatinib exposure offer an ideal model to dissect the molecular determinants of drug resistance.
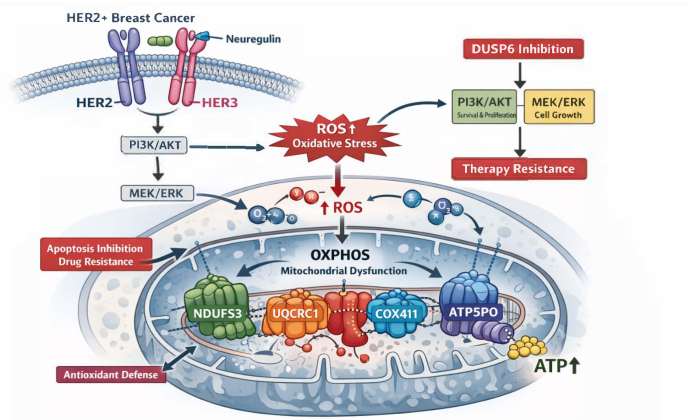
Figure 1. Schematic representation of the molecular landscape linking mitochondrial dysfunction, oxidative stress, and breast cancer progression. These integrated molecular mechanisms underlying mitochondrial oxidative stress–mediated oncogenesis in breast cancer. Dysregulated mitochondrial electron transport chain complexes particularly involving DUFS3, UQCRC1, COX4I1, SDHA, and ATP5PO. lead to excessive generation of reactive oxygen species (ROS), resulting in oxidative DNA damage, lipid peroxidation, and impaired mitochondrial membrane potential. These oxidative perturbations activate oncogenic signaling pathways such as PI3K/AKT, MAPK, and NF-κB, while suppressing apoptotic regulators including p53 and BAX, thereby promoting tumor cell survival, proliferation, and immune evasion. The diagram also highlights the dual impact of mitochondrial oxidative stress on cancer metabolism and the tumor microenvironment, emphasizing its contribution to therapy resistance and immune modulation under HER2+ breast cancer conditions. This integrative model forms the mechanistic basis for subsequent transcriptomic and SNP-based analyses aimed at identifying mitochondrial driver genes and potential therapeutic targets. Please click here to view a larger version of this figure.
The present study was designed to systematically identify hub genes, functional nsSNPs, and potential drug targets associated with mitochondrial oxidative stress in HER2+ breast cancer. By integrating transcriptomic data from GSE231524 and GSE231525 with curated mitochondrial and oxidative stress-related gene sets, the current study aimed to define mitochondrial oxidative stress-related differentially expressed genes (MOS-DEGs) that contribute to therapy resistance. Downstream analyses included gene ontology (GO) and KEGG pathway enrichment, protein–protein interaction (PPI) network construction, hub gene prioritization, and survival correlation analysis using the Kaplan–Meier Immunotherapy Database. Moreover, key genes were further investigated for nsSNP variation and potential structural impact to delineate mutation-driven functional consequences.
By combining transcriptomic profiling, network biology, and in silico. mutational analysis, this study provides an integrated framework for discovering potential mitochondrial biomarkers and therapeutic targets in HER2+ breast cancer. The identification of oxidative phosphorylation-linked hub genes and their functional SNPs may pave the way for the development of precision therapeutic strategies to overcome HER2-targeted drug resistance and improve patient outcomes.
Access restricted. Please log in or start a trial to view this content.
Protocol
Data retrieval and preprocessing
This study was conducted using publicly available transcriptomic and genetic data; no human or animal subjects were directly involved. Transcriptomic datasets relevant to HER2+ breast cancer therapy resistance were retrieved from the NCBI Gene Expression Omnibus (GEO) database (https://www.ncbi.nlm.nih.gov/geo/)11. Two RNA-seq datasets, GSE231524 and GSE231525, were selected because of their specific focus on HER3-driven resistance and DUSP6 inhibition in HER2+ breast cancer cell lines (BT474 and MDA-MB-453). These datasets included parental, drug-tolerant, and drug-resistant phenotypes derived from Lapatinib (1 µM) exposure and DUSP6 knockdown. Raw count matrices and corresponding metadata files were accessed using the GEOquery (v2.70.0) and Biobase (v2.62.0) packages in RStudio (v4.3.2)12. The metadata were curated to define two main contrasts for each dataset: GSE231524 compared the control (BT474 parental, Day 0) with drug-tolerant and drug-resistant samples (Day 9–Month 9), while GSE231525 compared the control (Scrambled siRNA) with DUSP6 knockdown (DUSP6-KD). Quality control and data normalization were performed using the DESeq2 (v1.42.0) framework, which applies a variance-stabilizing transformation (VST) to reduce heteroscedasticity and ensure comparability across samples. Data distribution and clustering patterns were visually assessed using ggplot2 (v3.5.0) and pheatmap (v1.0.12) to confirm data uniformity and identify potential outliers prior to differential expression analysis13,14.
In this study, a clear distinction was maintained between findings derived from cell line transcriptomic datasets and those obtained from patient-derived clinical datasets. Cell line data were primarily used for exploratory analysis, including the identification of differentially expressed genes and the generation of preliminary mechanistic insights in controlled experimental models. In contrast, patient-derived datasets were employed for external validation of gene expression patterns and assessment of clinical relevance, including prognostic evaluation. Accordingly, results from cell line models and clinical cohorts are interpreted separately to avoid overgeneralization and ensure appropriate translational context for all findings.
Differential gene expression analysis
Differential expression analysis was performed to identify genes that were significantly modulated between the control and treatment conditions. Normalized counts were processed using the adjusted regression model (ARM) integrated into DESeq2 to accurately estimate log₂ fold changes and statistical significance. The design formula was defined as ~condition, representing the control versus treated groups. Genes with an adjusted p-value (FDR) < 0.05 and absolute log₂ fold change ≥ 1 were considered significantly differentially expressed. Log₂ fold change shrinkage was performed using the apeglm method to enhance robustness in effect size estimation. The results of the analysis were visualized using EnhancedVolcano (v1.22.0)15 and ggplot216, which generated volcano plots and MA plots displaying the relationship between expression magnitude and statistical confidence. Dispersion estimates were also assessed within DESeq2 to ensure accurate variance modeling and consistent normalization across biological replicates17.
Retrieval and identification of mitochondrial oxidative stress-related differentially expressed genes (MOS-DEGs)
To investigate the link between energy metabolism, oxidative stress, and drug resistance, a comprehensive list of mitochondrial and oxidative stress-associated genes was compiled from multiple databases, including Human MitoCarta3.018 (https://personal.broadinstitute.org/scalvo/MitoCarta3.0/human.mitocarta3.0.html), Gene Ontology (GO:0006979, response to oxidative stress) (http://geneontology.org/), the Kyoto Encyclopedia of Genes and Genomes (KEGG) oxidative phosphorylation pathway (https://www.genome.jp/kegg/), and the Human Oxidative Stress Gene Database (HOSGDB) (http://hosgdb.com/). All retrieved genes were standardized to HGNC-approved gene symbols using org.Hs.eg.db (v3.18.0) and AnnotationDbi (v1.64.0), while duplicate entries, pseudogenes, and non-coding RNAs were removed to ensure annotation accuracy. The resulting curated mitochondrial oxidative stress gene panel (MOS genes) was subsequently used as a reference set for integration with the differentially expressed genes identified from both transcriptomic datasets.
The intersection of the curated MOS gene list with the DEGs obtained from GSE231524 and GSE231525 was performed in R using dplyr (v1.1.3)19 and base R intersect() functions. This integrative approach enabled the identification of MOS-DEGs, representing genes functionally linked to mitochondrial metabolism, redox regulation, and oxidative stress adaptation. The overlap among datasets was visualized using the VennDiagram (v1.7.3) package in R to illustrate shared and unique genes across the experimental models20. The refined list of MOS-DEGs was used for downstream analyses, providing mechanistic insight into the transcriptional and metabolic reprogramming underlying HER2-targeted therapy resistance.
Expression profiling and visualization of MOS-DEGs
Expression profiling of the identified MOS-DEGs was conducted using ComplexHeatmap (v2.18.0)21 and pheatmap (v1.0.12) packages in RStudio to visualize global expression patterns across parental, drug-tolerant, and resistant conditions. Normalized count data were transformed using z-score scaling to standardize the gene expression matrix across samples. Clustering was performed using Euclidean distance and complete linkage methods to detect co-expression patterns and to distinguish condition-specific transcriptional profiles. Heatmaps and clustering plots were generated using ggplot2 to ensure clear visual differentiation among conditions. This visualization approach facilitated the identification of gene groups associated with mitochondrial activity, oxidative stress modulation, and metabolic reprogramming under drug-resistant states.
Functional enrichment and pathway annotation
To explore the biological significance and regulatory mechanisms of the identified MOS-DEGs, Gene Ontology (GO) and Kyoto Encyclopedia of Genes and Genomes (KEGG) enrichment analyses were conducted using R Studio (version 4.3.1). The analyses were performed in the tidyverse environment utilizing multiple Bioconductor packages for reproducible computation and visualization. Gene annotation and identifier mapping were performed using the org.Hs.eg.db database (https://bioconductor.org/packages/org.Hs.eg.db/) based on the Homo sapiens reference genome (GRCh38). GO enrichment analysis was carried out using the clusterProfiler package (version 4.8.1; https://bioconductor.org/packages/clusterProfiler/), which categorizes genes into three major ontologies—Biological Process (BP), Cellular Component (CC), and Molecular Function (MF). The enrichGO22 function was used with parameters set to p-value < 0.05 and adjusted p-value. (FDR) < 0.05, applying the Benjamini–Hochberg correction method. Visualizations, including bar plots, dot plots, and chord diagrams, were generated using enrichplot (https://bioconductor.org/packages/enrichplot/), ggplot213 (https://cran.r-project.org/web/packages/ggplot2/), and GOplot (https://cran.r-project.org/web/packages/GOplot/). These tools provided a structured view of the enriched GO terms and their gene associations.
KEGG pathway enrichment was performed using the enrichKEGG() function within the clusterProfiler package, referencing the human KEGG database (https://www.genome.jp/kegg/). The KEGGREST package (https://bioconductor.org/packages/KEGGREST/) was used for pathway data retrieval and annotation. Pathways with an adjusted p-value. (q-value) < 0.05 were considered significant. Visualization and pathway mapping were conducted using pathview (https://bioconductor.org/packages/pathview/), ggplot2, and enrichplot, while igraph and ggraph were used for network representation23. All enrichment analyses and visualizations were implemented in R Studio (v4.3.1) using reproducible code and standardized Bioconductor workflows, ensuring reliable identification of enriched functional categories and biological pathways associated with the MOS-DEGs.
ROC-based validation of predictive biomarkers in breast cancer
To validate the clinical predictive power of the MOS-DEGs, receiver operating characteristic (ROC) curve analysis was performed using the ROCplotter online tool (https://www.rocplot.org/)24. ROCplotter is an integrated web-based platform that combines gene expression data with clinically annotated treatment response datasets from 3,104 breast cancer patients, including those treated with chemotherapy, hormonal therapy, or anti-HER2 agents.
The analysis was conducted using the parameters “pathological complete response” as the outcome variable and “any chemotherapy” as the treatment category. Gene expression values derived from Affymetrix microarray datasets were automatically stratified into responder and non-responder groups based on clinical annotations within the platform.
The receiver operating characteristic (ROC) curve (AUC), Mann–Whitney U test, fold change, and chi-square test were applied to assess each gene’s ability to distinguish responders from non-responders. The area under the curve (AUC) was used as the primary metric to evaluate discriminative performance. AUC values greater than 0.55 with ROC p-values < 0.05 were considered significant, representing moderate predictive performance typical of transcriptomic biomarkers, while false discovery rate (FDR) correction was applied to maintain analytical rigor.
All selected MOS-DEGs were queried using their corresponding Affymetrix probe IDs. The discriminative potential of each gene was evaluated across clinical breast cancer cohorts, where expression data were stratified into responder and non-responder groups. ROC curves, boxplots, and associated statistical outputs were generated directly by the ROCplotter platform and exported for downstream visualization and comparison. The analysis quantified the predictive value of redox and metabolic regulators involved in mitochondrial oxidative stress. Genes that exhibited consistent predictive significance across clinical samples were retained for inclusion in the final predictive panel.
Differential expression analysis in tumor, normal, and metastatic tissues (TNMplot analysis)
The expression patterns of the top MOS-DEGs were analyzed across normal, tumor, and metastatic breast tissues using the TNMplot web tool v2 (https://tnmplot.com/analysis/)25. Both RNA-Seq (TCGA + GTEx + MET500) and gene chip datasets were examined to ensure cross-platform validation. The “Multiple Gene Analysis” module was used with Breast Invasive Carcinoma as the selected tissue type26. Expression values were log₂-transformed and compared across Tumor vs. Normal (TvsN), Metastatic vs. Tumor (MvsT), and Metastatic vs. Normal (MvsN) groups. TNMplot automatically computed fold-change (FC) and p-values using the Mann–Whitney U test to assess statistical significance. Expression distributions were visualized as boxplots and density plots directly generated from the TNMplot interface, with green, red, and gray representing normal, tumor, and metastatic tissues, respectively. All figures were exported in high resolution for integration into the results section. This dual-platform analysis enabled robust identification and validation of key mitochondrial redox–metabolic regulators associated with breast cancer progression27.
Survival and prognostic analysis using Kaplan–Meier plotter
To evaluate the prognostic relevance of MOS-DEGs in breast cancer, survival analysis was conducted using the Kaplan–Meier Plotter online tool (https://kmplot.com/analysis/)28. This database integrates gene expression and survival data from more than 4,900 breast cancer patients, derived from multiple GEO, EGA, and TCGA datasets. The analysis was performed for recurrence-free survival (RFS) using individual Affymetrix probe IDs corresponding to the prioritized genes: 225609_at (GSR), 201761_at (MTHFD2), 201619_at (PRDX3/AOP1), and 201128_s_at (ACLY). Patients were divided into high- and low-expression groups based on the median expression cutoff, and survival probabilities were estimated using the Kaplan–Meier method. The log-rank test was used to assess statistical significance between survival curves, and hazard ratios (HRs) with 95% confidence intervals (CIs) were automatically calculated by the tool. All analyses were performed using the RFS endpoint, with no restriction based on hormone receptor or HER2 status (ER, PR, HER2 = all). Redundant samples were removed, and proportional hazards assumptions were verified to ensure statistical robustness. Quality control filters excluded biased microarrays. No manual probe selection or p-value correction for multiple testing was applied, in accordance with the KM Plotter default settings. Statistical significance was defined as p. < 0.05. Survival plots were visualized and downloaded in high resolution for further interpretation, comparing outcomes between high and low expressers of each candidate MOS gene29,30.
The present analysis was initiated using datasets exclusively comprising HER2+ breast cancer samples for the identification of differentially expressed genes (DEGs) and hub genes. Subsequently, survival analysis was performed without restriction to HER2 status (ER, PR, HER2 = all) to assess the broader prognostic relevance and generalizability of the identified genes. This approach was employed as a secondary validation step rather than to redefine the study focus. Therefore, the prognostic implications of the identified hub genes are interpreted cautiously, with primary conclusions remaining specific to HER2+ breast cancer.
The canonical transcript sequences of MTHFD2-201 (ENST00000394053.7) and PRDX3-201 (ENST00000298510.4) were retrieved from the Ensembl Genome Browser (https://www.ensembl.org)31,32. Variant annotation and classification were performed using the Ensembl Variant Effect Predictor (VEP) (https://www.ensembl.org/vep), which provided detailed genomic context, codon alterations, and amino acid substitutions for each identified variant. Only missense variants (non-synonymous SNPs) were selected for downstream analysis.
Pathogenicity prediction and variant prioritization
The functional consequences of each nsSNP were evaluated using a combination of computational prediction tools. SIFT (https://sift.bii.a-star.edu.sg) was applied to assess amino acid conservation, classifying variants with a score ≤ 0.05 as deleterious33. PolyPhen-2 (http://genetics.bwh.harvard.edu/pph2) estimated the structural and evolutionary impact of substitutions, where scores ≥ 0.85 indicated probable damage34. CADD (https://cadd.gs.washington.edu) provided a composite deleteriousness score integrating multiple annotations, with values ≥ 20 denoting high pathogenic potential35. Complementary metrics from MetaLR36, Mutation Assessor, and REVEL were integrated from the VEP interface for enhanced prediction reliability37. Variants meeting the thresholds MetaLR ≥ 0.70, Mutation Assessor ≥ 3.5, and REVEL ≥ 0.75 were prioritized as likely pathogenic.
Structural and mechanistic impact prediction
To evaluate how amino acid substitutions influence structural integrity and biochemical function, each top-ranked nsSNP was further analyzed using MutPred2 (http://mutpred.mutdb.org)38 and DynaMut (http://biosig.unimelb.edu.au/dynamut)39. MutPred2 estimated the probability of functional disruption, including altered catalytic activity, gain or loss of metal-binding residues, changes in solvent accessibility, and allosteric modulation, with scores ≥ 0.80 classified as highly pathogenic. DynaMut computed the Gibbs free energy change (ΔΔG) between wild-type and mutant proteins, assessing the direction and magnitude of the stability alteration, and generated visualizations of atomic displacements and hydrogen bond rearrangements.
Secondary and 3D structural modeling and solvent accessibility profiling
The experimentally resolved crystal structures of MTHFD2 and PRDX3 were obtained from the Protein Data Bank (PDB) and processed using PyMOL V:3.1 (https://pymol.org)40 to visualize the spatial distribution of deleterious residues. Mutant models were created by introducing the corresponding amino acid substitutions, followed by structural refinement and energy minimization. Comparative 3D inspection highlighted shifts in secondary elements, altered interatomic contacts, and the spatial proximity of nsSNPs to catalytic and cofactor-binding domains, revealing potential disruptions in redox and metabolic functions.
Secondary structure and solvent exposure analyses were performed using PSIPRED V: 3.2 (http://bioinf.cs.ucl.ac.uk/psipred)41,42 and NetSurfP 3.0 (https://services.healthtech.dtu.dk/service.php?NetSurfP-2.0)43. These tools predicted α-helices, β-strands, coils, and disordered regions along with relative solvent accessibility (RSA) scores. Residues exhibiting moderate-to-high RSA values and structural order were mapped to identify solvent-exposed and functionally critical positions. The affected sites were visualized in 2D topology diagrams to determine whether deleterious mutations occurred in rigid catalytic cores or flexible loop regions, thereby predicting their probable effects on protein folding dynamics and enzymatic efficiency.
Database cross-validation, functional integration, and stability validation
Each prioritized nsSNP was cross-referenced against population-level genomic databases including dbSNP, 1000 Genomes, ExAC, and gnomAD to confirm variant frequency, global allelic distribution, and previously reported clinical associations. The integration of evolutionary conservation, structural modeling, and machine-learning–based functional prediction enabled the identification of high-confidence deleterious variants in MTHFD2 and PRDX3. These high-impact mutations were subsequently mapped to functional domains to elucidate their potential role in mitochondrial oxidative stress imbalance, altered metabolic signaling, and therapeutic resistance in breast cancer. To further confirm the thermodynamic consequences of each deleterious substitution, iMutant 3.0 (https://folding.biofold.org/i-mutant/i-mutant3.0.html)44 was used to predict the effects of mutations on protein stability using sequence and structural data. The analysis computed ΔΔG values (kcal/mol) representing the change in free energy between wild-type and mutant proteins. Variants showing negative ΔΔG values were classified as destabilizing mutations, indicating reduced protein stability and increased unfolding probability. Integration of iMutant predictions with DynaMut and MutPred2 results provided cross-validation for identifying structurally critical residues likely to affect redox function, catalytic integrity, and overall protein conformational stability.
Integrated functional interpretation and therapeutic relevance
All identified deleterious nsSNPs were validated through cross-referencing with dbSNP, gnomAD, and ExAC population databases to verify minor allele frequencies and previously reported associations with cancer phenotypes. Integrative interpretation of evolutionary conservation, structural modeling, and stability data indicated that the high-impact mutations rs1471336772 (MTHFD2) and rs747786383 (PRDX3) exert the strongest deleterious effects on protein conformation and catalytic efficiency. The computational results collectively suggest that mutations in MTHFD2 destabilize NADPH-dependent redox metabolism, while mutations in PRDX3 impair peroxidase-mediated oxidative stress defense, contributing to mitochondrial dysfunction and tumor aggressiveness. This nsSNP-based structural and functional analysis provides a computational foundation for future therapeutic screening and mutational validation, highlighting MTHFD2 and PRDX3 as precision biomarkers for redox-targeted breast cancer therapy. To improve clarity and provide a comprehensive overview of the analytical strategy, a schematic workflow summarizing the study's major steps is presented in Figure 2. The workflow integrates differential gene expression analysis, mitochondrial gene filtering, protein–protein interaction network construction, clinical validation using ROC analysis, and nsSNP-based structural characterization. This stepwise framework highlights the logical progression from transcriptomic data processing to biomarker identification and functional interpretation.
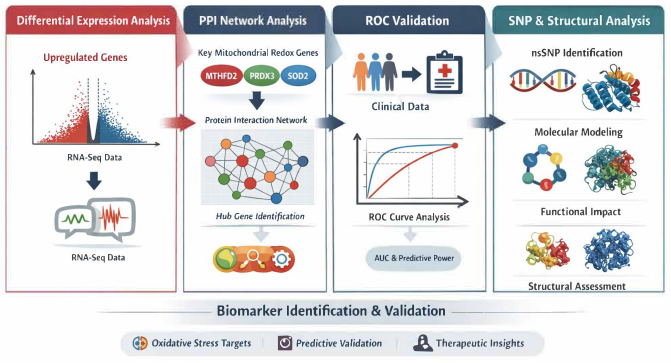
Figure 2. Integrative multi-step workflow for identification and validation of mitochondrial oxidative stress–related biomarkers in HER2+ breast cancer. This schematic summarizes the analytical pipeline employed in the study. First, differential gene expression (DEG) analysis was performed on RNA-seq datasets (GSE231524 and GSE231525) to identify significantly altered genes. These DEGs were intersected with curated mitochondrial oxidative stress–related genes to obtain MOS-DEGs. Next, protein–protein interaction (PPI) network analysis was conducted using STRING and Cytoscape to identify hub genes and functional modules. Subsequently, receiver operating characteristic (ROC) curve analysis was applied using the ROCplotter platform to evaluate the predictive performance of selected genes in clinical cohorts. Finally, non-synonymous SNP (nsSNP) analysis and structural modeling were performed to assess the potential functional and structural impact of key variants in prioritized genes (MTHFD2 and PRDX3). This integrative workflow links transcriptomic, network, clinical, and structural analyses to identify potential biomarkers and therapeutic targets. Please click here to view a larger version of this figure.
Access restricted. Please log in or start a trial to view this content.
Results
Differential gene expression analysis
Differential expression profiling was performed to investigate transcriptional alterations associated with HER2+ breast cancer progression and therapy resistance using two independent RNA-seq datasets, GSE231524 and GSE231525. In the first dataset (GSE231524), a total of 19,727 genes were initially quantified. Following normalization, filtering, and application of the adjusted regression model (ARM) for differential expression, ...
Access restricted. Please log in or start a trial to view this content.
Discussion
Mitochondrial oxidative stress is a defining hallmark of tumor adaptation, governing cellular survival, metabolic plasticity, and therapy resistance. The present study systematically explored mitochondrial oxidative stress–related differentially expressed genes (MOS-DEGs) in HER2+ breast cancer by integrating transcriptomic data, functional enrichment, clinical validation, and detailed in silico mutational and structural analyses. The integration of differential expression with mutation profilin...
Access restricted. Please log in or start a trial to view this content.
Disclosures
The authors have no conflicts of interest to declare. Artificial intelligence tools, including OpenAI’s ChatGPT (GPT-5)., were used to improve the manuscript’s grammar, clarity, and scientific phrasing. All analyses, interpretations, and conclusions were conceived and verified by the authors.
Author contributions:
Xiaobo Jia conceptualized and supervised the study, contributed to study design, data interpretation, manuscript drafting, and provided overall project leadership. Hui Su contributed to data acquisition, bioinformatics analysis, and interpretation of transcriptomic results. Jiaxin Zhang assisted in data processing, nsSNP analysis, structural modeling, and figure preparation. Zhao Liu contributed to statistical analysis, validation of results, and manuscript revision. All authors reviewed and approved the final version of the manuscript.
Materials
| Name | Company | Catalog Number | Comments |
|---|---|---|---|
| AnnotationDbi | Bioconductor | v1.64.0 | R annotation package used for HGNC gene symbol standardization and annotation. |
| apeglm | Bioconductor | method in DESeq2 | Method used for log2 fold-change shrinkage in differential expression analysis. |
| Biobase | Bioconductor | v2.62.0 | R package used to access and manage GEO-derived expression and metadata objects. |
| CADD | University of Washington / Kircher Lab | web tool | Combined Annotation Dependent Depletion score used for nsSNP pathogenicity prediction. |
| clusterProfiler | Bioconductor | v4.8.1 | R package used for GO and KEGG enrichment analysis. |
| ComplexHeatmap | Bioconductor | v2.18.0 | R package used for heatmap generation and expression clustering. |
| Cytoscape | Cytoscape Consortium | software | Network visualization platform used with STRING-derived PPI networks and CytoHubba prioritization. |
| dbSNP | NCBI | database | Population variant database used for cross-validation of prioritized nsSNPs. |
| DESeq2 | Bioconductor | v1.42.0 | R package used for normalization, variance modeling, and differential expression analysis. |
| dplyr | CRAN / tidyverse | v1.1.3 | R package used for data manipulation and intersection of gene sets. |
| DynaMut | University of Melbourne / BioSig | web server | Tool used to estimate mutation-associated stability and flexibility changes in proteins. |
| EnhancedVolcano | Bioconductor | v1.22.0 | R package used to visualize differential expression results as volcano plots. |
| Ensembl Genome Browser | EMBL-EBI / Ensembl | database | Source of canonical transcript sequences for MTHFD2 and PRDX3. |
| Ensembl Variant Effect Predictor (VEP) | EMBL-EBI / Ensembl | web tool | Tool used to annotate missense variants and integrate predictive scores. |
| ExAC | Broad Institute | database | Population-level exome database used for nsSNP cross-validation. |
| Gene Expression Omnibus (GEO) | NCBI | database | Repository used to retrieve transcriptomic datasets for HER2-positive breast cancer analysis. |
| Gene Ontology | Gene Ontology Consortium | GO:0006979 | Ontology resource used to retrieve oxidative stress-related genes and for enrichment analysis. |
| GEOquery | Bioconductor | v2.70.0 | R package used to access GEO count matrices and metadata. |
| ggplot2 | CRAN / tidyverse | v3.5.0 | R package used for data visualization, clustering plots, and graphical outputs. |
| ggraph | CRAN | R package | R package used for graph and network visualization during enrichment and pathway representation. |
| gnomAD | Broad Institute | database | Population variant database used to check frequency and distribution of prioritized nsSNPs. |
| GOplot | CRAN | R package | R package used for GO enrichment visualization including chord and summary plots. |
| GSE231524 | NCBI GEO | accession | RNA-seq dataset used for analysis of parental, drug-tolerant, and resistant BT474 phenotypes. |
| GSE231525 | NCBI GEO | accession | RNA-seq dataset used for analysis of DUSP6 knockdown in HER2-positive breast cancer cells. |
| Human MitoCarta3.0 | Broad Institute | database | Curated mitochondrial gene resource used to define mitochondrial gene sets. |
| Human Oxidative Stress Gene Database (HOSGDB) | HOSGDB | database | Database used to retrieve oxidative stress-related genes. |
| igraph | CRAN | R package | R package used for network representation and pathway visualization. |
| iMutant 3.0 | University of Bologna / Biofold | web server | Tool used to predict mutation effects on protein stability. |
| Kaplan–Meier Plotter | KMplot | web tool | Online platform used for recurrence-free survival analysis in breast cancer cohorts. |
| KEGG | Kyoto University | database | Pathway database used for oxidative phosphorylation and pathway enrichment analysis. |
| KEGGREST | Bioconductor | R package | Package used to retrieve and annotate KEGG pathway information. |
| Lapatinib | Not specified in manuscript | 1 μM treatment condition | HER2-targeted inhibitor used in the source experimental datasets to derive drug-tolerant/resistant phenotypes. |
| MetaLR | Integrated via Ensembl VEP | score | Computational pathogenicity metric used for variant prioritization. |
| MutPred2 | MutPred | web server | Tool used to predict functional consequences of amino acid substitutions. |
| NetSurfP 3.0 | Technical University of Denmark | web server | Tool used for secondary structure and solvent accessibility prediction. |
| org.Hs.eg.db | Bioconductor | v3.18.0 | Human genome annotation package used for gene identifier mapping. |
| pathview | Bioconductor | R package | Package used to map enriched genes onto KEGG pathways. |
| pheatmap | CRAN | v1.0.12 | R package used for heatmap plotting and clustering visualization. |
| PolyPhen-2 | Harvard / Brigham and Women's Hospital | web tool | Computational predictor used to estimate structural/functional impact of amino acid substitutions. |
| Protein Data Bank (PDB) | RCSB PDB | database | Source of experimentally resolved protein structures for MTHFD2 and PRDX3. |
| PSIPRED | University College London | v3.2 | Protein secondary structure prediction server used for 2D topology analysis. |
| PyMOL | Schrödinger / PyMOL | v3.1 | Molecular graphics software used to visualize protein structures and mutation sites. |
| REVEL | Integrated via Ensembl VEP | score | Ensemble pathogenicity score used for missense variant prioritization. |
| ROCplotter | ROCplot.org | web tool | Online platform used for ROC-based validation of gene expression in breast cancer response cohorts. |
| RStudio | Posit | v4.3.1/v4.3.2 environment | Statistical computing environment used for transcriptomic, enrichment, and visualization workflows. |
| SIFT | A*STAR | web tool | Predictive tool used to classify amino acid substitutions as tolerated or deleterious. |
| STRING | STRING Consortium | database | Protein–protein interaction database used for network analysis and hub gene identification. |
| TNMplot | TNMplot.com | web tool | Platform used to compare gene expression across normal, tumor, and metastatic breast tissues. |
| VennDiagram | CRAN | v1.7.3 | R package used to visualize overlap among DEGs and curated mitochondrial gene sets. |