Here, we present a protocol for implementing and evaluating a dynamic visualized pain assessment tool in pediatric wards. By integrating real-time facial analysis with continuous physiological monitoring, this approach aims to reduce nursing response latency, improve assessment consistency, and optimize precision pain management for hospitalized infants.
Method Article
Impact of a Dynamic Visualized Pain Assessment Tool on Pediatric Pain Management: A Stepped-Wedge Cluster Randomized Trial
In This Article
Summary
Abstract
Effective pediatric pain management relies on accurate assessment; however, current behavioral scales are limited by observer subjectivity and fail to capture dynamic fluctuations. The primary goal of this protocol is to detail the implementation and evaluation of a dynamic visualized pain assessment tool, providing a standardized methodology to transition nursing practice from experience-based estimation to data-driven precision. Using a stepped-wedge cluster randomized trial design across five clinical wards, the study enrolled 15 infants and analyzed 45 video segments across three clinical contexts: baseline, acute procedural pain, and postoperative recovery. The system captured high-definition facial video synchronized with bedside physiological monitoring to generate real-time pain trajectory curves and trend-based alerts. Generalized linear mixed models showed that the tool reduced nursing response latency from 15.4 to 6.7 min (P < 0.001) and increased assessment consistency (intraclass correlation coefficient [ICC]: 0.71–0.93). Concurrently, pediatric satisfaction scores rose, and parental anxiety levels decreased. These findings suggest that dynamic visualization may improve clinical efficiency and patient outcomes through timely, objective decision support.
Introduction
Effective pain management is fundamental to pediatric care and essential for enhanced recovery after surgery (ERAS) protocols1. Assessing pain in non-verbal infants remains clinically challenging due to their inability to self-report2. Currently, clinical nurses primarily rely on behavioral observation scales for indirect assessment. Although standardized, these scales remain susceptible to scoring biases driven by clinical experience and workload3,4.
Studies indicate that nurses with varying levels of experience often exhibit inconsistent interpretations of pain behaviors in critically ill infants. Such uncertainty increases the risk of underestimating or misdiagnosing pain1. Recent research has further quantified this discrepancy, showing that personal biases and the static nature of observation can significantly alter nurses' perception of pain intensity compared to objective physiological markers5. Furthermore, the transient and multimodal nature of infant pain is difficult to capture using static, intermittent assessments. These limitations in assessment dimensions constitute a fundamental bottleneck in current pediatric pain management. While existing digital pain assessment tools primarily focus on offline algorithm development and validation, there remains a critical gap in translating these discrete AI outputs into continuous, actionable clinical workflows.
Traditional nursing documentation models predominantly employ static, breakpoint-based recording systems that conduct periodic assessments at fixed hourly intervals6. This approach disconnects evaluation from intervention during the dynamic postoperative phase, where pain intensity fluctuates rapidly. Static scales provide only snapshot-like data, failing to capture the true trajectory of pain changes over time. Clinical observations reveal that a substantial proportion of pediatric patients experience delayed pharmacological intervention during pain flare-ups, primarily due to the lag in assessment data. This delay not only prolongs the duration of pediatric suffering but may also lead to central nervous system hypersensitivity, increasing the risk of chronic pain development7,8. Such static recording methods cannot capture the onset curves of analgesic medications or the concentration-decay trend, leaving nurses in a reactive rather than a proactive management state when making analgesic decisions. This delay hinders timely intervention, necessitating precision nursing approaches.
Precision nursing emphasizes delivering the most accurate nursing interventions at the optimal time by integrating patients' biological, psychological, and environmental data. Digital health technologies, through real-time monitoring of patients' vital signs and behavioral data, are reshaping the accuracy of nursing decision-making9. Emerging evidence suggests that integrating physiological monitoring with digital platforms can reduce cognitive load for clinicians and improve the objectivity of pain assessment in vulnerable pediatric populations10.
In pediatric settings, precision nursing transforms ambiguous behavioral signals into quantifiable, continuous digital metrics, eliminating subjective assessment blind spots. By constructing dynamic pain phenotypes, nurses can more accurately identify the pain trigger thresholds and relief patterns in pediatric patients. This shift from experience-driven to data-driven approaches represents a critical advancement in nursing, essential for achieving individualized analgesia and enhancing safety11.
To address these challenges, this study implemented a dynamic visualization assessment tool in a tertiary hospital12,13. The tool integrates multimodal motion capture technology to transform pediatric patients’ pain status into real-time visual trend charts, providing nurses with intuitive clinical decision support. By analyzing video clips across various clinical scenarios, this study demonstrates that dynamic visualization optimizes analgesic decision-making and improves the patient and family experience. This provides preliminary, high-quality, evidence-based support for the widespread application of digital precision nursing in pediatric clinical practice.
Protocol
NOTE: The following protocol describes the setup and execution of the dynamic visualization assessment within a clinical trial setting. Ensure all procedures comply with institutional ethics committee guidelines regarding human subjects and data privacy.
1. Ethical considerations and participant screening
- Obtain approval from the Institutional Review Board (IRB) or Ethics Committee prior to commencing the study. This research has been approved by the Institutional Review Board (IRB) at Capital Children's Medical Center, Capital, Medical University.
- Screen hospitalized infants in the target pediatric wards for eligibility.
- Include infants aged 1–12 months who are admitted to the general surgery or neonatal surgery wards for elective procedures (e.g., bowel resection, hernia repair, or congenital anomaly corrections). Ensure participants have stable baseline vital signs prior to the study and are able to undergo continuous facial video capture.
- Exclude infants with significant neurological abnormalities, facial deformities, or facial occlusion (e.g., non-invasive ventilation masks) that prevent stable video capture.
- Approach the legal guardians of eligible infants to explain the study purpose, the use of video recording, and data security measures.
- Obtain written informed consent from legal guardians before enrollment.
- Track ward recruitment, participant enrollment numbers, and overall study flow using the CONSORT Flowchart (Figure 1).
2. Clinical setting and equipment setup
- Select participating wards (clusters) that strictly adhere to standardized institutional pediatric postoperative care protocols. This encompasses routine continuous bedside vital sign monitoring and mandated behavioral pain assessments (e.g., Face, Legs, Activity, Cry, Consolability [FLACC] scale) conducted at fixed intervals (e.g., every 4–6 h) by the nursing staff.
- Verify that the Hospital Information System (HIS) or Electronic Health Record (EHR) allows precise timestamp logging of assessments and medication administration.
- Install 1,080 p high-definition RGB cameras capable of capturing at least 30 frames per second (fps) at the bedside.
- Position the camera to capture the infant's face clearly, ensuring no interference with routine clinical care.
- Maintain consistent facial illumination across varying ambient light conditions. During the day, utilize natural and standard ward lighting to avoid strong backlighting or deep shadows. During night shifts, activate the camera's near-infrared (NIR) mode or utilize low-intensity warm nightlights to ensure continuous, clear facial capture without disrupting the infant's normal sleep cycle.
- Connect the bedside physiological monitor (measuring heart rate and peripheral capillary oxygen saturation [SpO2]) to a central digital data collection platform (e.g., a Python-based recording interface) via an HL7 (Health Level Seven) data link to ensure synchronized recording of physiological parameters.
3. Study design implementation (stepped-wedge cluster randomization)
- Assign participating wards (clusters) to the control state initially.
- Generate a random schedule using a random number table to determine the crossover time points for each ward.
- Maintain the "Control Phase" workflow initially:
- Instruct nurses to perform pain assessments using conventional behavioral scales (e.g., FLACC).
- Record assessments and corresponding interventions in the EHR at strict routine intervals (every 4 h) in accordance with standard ward protocols, as well as immediately following any parent-reported pain events.
- Execute the transition to the "Intervention Phase" according to the randomized schedule.
- Conduct a standardized training session for nurses in the cluster undergoing transition.
- Conduct a comprehensive 2 h training workshop for the nursing staff. Ensure that the curriculum covers operation of the bedside dynamic visualization dashboard, interpretation of the real-time pain trajectory curves, and the standardized clinical response pathway triggered by trend alerts.
- Require nurses to complete simulated case evaluations to confirm their competency before transitioning to the Intervention Phase. Conduct trial runs to minimize the learning curve effect.
- Execute the rollout according to the stepped-wedge design schema shown in Figure 2.
4. Data collection and synchronization
- Record a continuous high-definition facial video segment (approximately 1–3 min) across three distinct clinical contexts for each enrolled infant to ensure multimodal data coverage:
- Context 1 (C1): Baseline/Non-painful condition. Record data for a continuous 3 min period while the infant is in a confirmed pain-free, resting state (e.g., quiet sleep or calm awake, with a documented FLACC score of 0 and stable vital signs), prior to any noxious stimulus.
- Context 2 (C2): Short-term noxious stimulus (acute procedural pain such as heel prick, vaccination, or venipuncture).
- Context 3 (C3): Prolonged/Post-operative pain. Maintain active system monitoring during the 24–48 h postoperative window while the infant is resting in the crib. Instruct parents and nursing staff to proceed with routine care, feeding, and comforting (e.g., parental holding) normally.
NOTE: During periods of parental holding or severe postural changes where the face is completely obscured, the system's occlusion-detection algorithm automatically pauses data extraction to prevent artifactual scoring, seamlessly resuming baseline and pain tracking once the infant's face returns to the camera's field of view.
- Synchronize the video timestamps with the bedside monitor data.
- Align the data timestamps with the nursing action logs in the EHR/HIS.
- Verify that the time on the video recording device matches the hospital server time to ensure accurate calculation of response latency.
- Manage nurse shift changes by maintaining continuous bedside video and physiological recording. Require outgoing and incoming nurses to review the recent dynamic pain trajectory curves together during the shift handoff. Ensure all nursing interventions are individually logged into the EHR using personal staff credentials to accurately track individual response latencies across shifts.
5. Operation of the dynamic visualization system (intervention phase)
- Data preprocessing and quality control:
- Initiate the system's face region detection algorithm.
- Perform a motion/occlusion check to exclude unusable frames where the face is blocked or blurred.
- Extract facial action units (AUs) and physiological trend features using a pre-trained deep convolutional neural network (e.g., ResNet-50 architecture modified for pediatric facial recognition), which was validated on an independent pediatric dataset prior to clinical deployment. Ensure the algorithm specifically tracks pain-related AUs (e.g., brow lowering, eye squeezing, and nasolabial furrow deepening) and synchronizes them with continuous heart rate and SpO2 variations to compute a composite dynamic score.
- Visualization and alerting:
- Generate a continuous dynamic pain score (0–10 scale) based on the integrated features.
- Display the real-time pain curve and the rate of change (slope) on the nurse's bedside dashboard.
- Configure the trend-based alert logic: Trigger a mandatory bedside alert if the continuous dynamic pain score exceeds the moderate pain threshold (score ≥ 4 out of 10) OR if the slope indicates a rapid escalation (e.g., an increase of ≥ 2 points within a 5-min rolling window).
- Nursing decision support:
- Instruct the nurse to view the dashboard upon receiving an alert.
- Confirm the patient's status at the bedside.
- Document the intervention (pharmacological or non-pharmacological) in the EHR.
- Follow the decision workflow outlined in Figure 3 to ensure data consistency.
6. Outcome measurement and data analysis
- Calculating nursing precision:
- Define Response Latency as the time interval between the system alert/threshold crossing and the timestamp of the documented nursing intervention.
- Calculate Assessment Consistency using the intraclass correlation coefficient (ICC). Compare the nurse's recorded bedside score, the system's generated score, and a blinded expert reference standard (defined as the consensus FLACC score derived from offline, independent video review by two senior pediatric pain specialists).
- Assessing clinical and satisfaction outcomes:
- Administer the assessment of parental outcomes within 24 h post intervention or prior to hospital discharge.
- Evaluate parental anxiety using the validated Visual Analog Scale for Anxiety (VAS-A, 0-10 scale), where higher scores indicate greater anxiety.
- Assess pediatric analgesic satisfaction using a structured 10-point Numeric Rating Scale (NRS) completed by the proxy (parent/guardian), focusing on the perceived speed of onset and overall adequacy of pain relief.
- Monitor and document the occurrence of all drug-related adverse drug reactions (ADRs) (e.g., nausea, vomiting, excessive sedation, and pruritus) and serious adverse events (SAEs) (e.g., respiratory depression or anaphylactic shock) throughout the study period.
- Extract secondary clinical outcomes from the EHR, including length of hospital stay, total opioid consumption, and the number of breakthrough pain episodes.
- Statistical modeling and analysis
- Perform all statistical analyses using an appropriate statistical software package, setting the significance level at α = 0.05.
- Analyze the primary continuous outcome (Response Latency) and other repeated-measure variables (Assessment Consistency [ICC], continuous pain scores) using Generalized Linear Mixed Models (GLMMs). Include "Intervention Status" (Control vs. Intervention) and "Trial Period" as fixed effects, while modeling "Ward/Cluster" and "Individual Subject" as random effects to account for the nested and stepped-wedge data structure.
- Evaluate secondary independent continuous variables (e.g., Length of hospital stay, Parental anxiety, Satisfaction scores) using independent samples t-tests or Mann-Whitney U tests, depending on data normality. Calculate Cohen's d to report effect sizes for these continuous outcomes.
- Analyze categorical variables (e.g., incidence of breakthrough pain, adverse drug reactions, protocol adherence rates) using Chi-square tests or Fisher's exact tests, reporting Cramer's V or Odds Ratios (OR) for effect sizes.
- Conduct a post-hoc power analysis to interpret the findings cautiously. Given the limited sample size (15 infants, 45 video segments), report confidence intervals alongside p-values, acknowledging that certain secondary metrics may be underpowered and exploratory in nature.
Results
Baseline characteristics and study flow
This study ultimately enrolled 15 hospitalized infants, all of whom completed data collection for three typical clinical scenarios (C1-C3) in accordance with the protocol. By capturing high-definition video clips of each participant across different scenarios, a total of 45 high-quality video segments were generated for subsequent dynamic scoring analysis and evaluation of nursing precision.
Of the 15 enrolled infants, 7 were allocated to the control condition and 8 to the intervention phase, with both groups demonstrating comparable age (6.4 ± 3.2 months), gender distribution, weight, gestational age, and surgical classification (all P > 0.05) (Table 1). Similarly, baseline physiological parameters (C1), including initial FLACC scores, heart rate, and blood oxygen saturation, showed no significant differences, suggesting a comparable baseline for comparison.
On the nursing staff side, the 42 participating nurses in this study exhibited a balanced distribution across groups in terms of age, clinical work experience (average 7.2 years), educational attainment, and professional titles. Regarding ward characteristics, the monthly average patient turnover and nurse-to-bed ratio remained stable across all clusters. This baseline consistency minimized potential confounding effects of demographic characteristics and professional backgrounds on study outcomes, providing a solid evidence-based foundation for objectively evaluating the true impact of the visual dynamic assessment tool on improving the precision of nurses' pain management and on pediatric patients' analgesia satisfaction.
Primary effectiveness on pain management
This study evaluated the primary effects of a dynamic visual pain management tool on nursing response efficiency, assessment consistency, and pediatric analgesia experience using a mixed-effects model analysis comparing the control and intervention phases. The dynamic visualized tool was associated with a reduction in mean response latency from a median of 15.4 min to 6.7 min (P < 0.001) (Table 2), decreasing the time to nursing action. Nursing assessment consistency improved, with the intraclass correlation coefficient (ICC) rising from 0.71 to 0.93, suggesting that the system may help achieve standardized judgments through visual feedback across multiple nursing staff and shifts. The protocol adherence rate also increased from 66.7% to 91.7%, suggesting that, with real-time prompts and task tracking, both the completeness and accuracy of nursing execution behaviors were significantly enhanced (Figure 4).
Regarding clinical metrics, the mean pain intensity score during the intervention phase was lower than in the control phase (3.2 ± 0.8 vs. 4.7 ± 1.3, P < 0.001). The analgesic satisfaction rate among pediatric patients increased significantly (8.8 ± 0.9 vs. 6.5 ± 1.4, P < 0.001), while parental anxiety decreased markedly (3.4 ± 1.1 vs. 5.8 ± 1.6, P < 0.001). The frequency of breakthrough pain events was reduced by nearly half. These results suggest that the dynamic visualization tool has the potential to enhance the speed and consistency of nursing decision-making at the operational level and to deliver clinical benefits for patient experience.
Impact on nursing precision and timing
Visual pain indicators were correlated with nursing precision (Figure 5). Specifically, a positive correlation was observed between visual pain scores and nursing precision, where higher scores indicated closer alignment with the expert gold standard (Figure 5A). This trend suggests that integrating continuous curves and multimodal signals minimizes fluctuations in subjective judgments. Conversely, a negative correlation between visual pain scores and response latency was observed, suggesting that clearer pain signals may shorten the nursing decision-making window (Figure 5B). This highlights how the tool's visualization of "risk escalation trends" enhances clinical visibility, thereby compressing the time window from identification to action. Scattered data points form gradient clustering across different clinical scenarios: baseline states cluster in low-score and low-precision zones, while acute and postoperative scenarios migrate to high-precision zones with higher accuracy and shorter latency, underscoring the tool's potential utility in high-risk contexts. The timeliness index represented by bubble size increases synchronously with the high-precision zones, further supporting its mechanism pathway—enhancing signal interpretability and timeliness to facilitate more consistent and rapid analgesic decision-making.
A detailed breakdown of various precision metrics further supported these observations (Table 3). In terms of response timeliness, nurses in the intervention phase demonstrated significantly shorter average response times than in the control phase, regardless of whether the pain scenario was moderate or severe. Notably, for severe pain (FLACC 7–10 points), the average response time in the intervention phase was reduced to 5.4 min, markedly improving the timeliness of analgesia. Additionally, regarding dosing accuracy, nurses in the intervention phase achieved 91.7% compliance with the clinically recommended dosage, substantially reducing the risk of underdosing or overdosing commonly observed in the control phase. The increased assessment frequency (from 1.3 to 2.9 assessments per episode) further suggested a potential reinforcing effect of the visualization interface on nurses' proactive observation behaviors. These sub-metrics collectively indicate that the dynamic visualization assessment tool, by providing continuous trend feedback, facilitates a shift in nursing practice from "empirical management" to "precision-based prediction."
Pediatric and parental satisfaction analysis
Regarding distribution characteristics, the dispersion and central tendency of pediatric satisfaction and parental anxiety in different clinical scenarios were evaluated using box plots (Figure 6). The overall trend shows that during the intervention phase, the distribution of pediatric satisfaction shifts upward and becomes more concentrated, indicating that the dynamic visualization system not only improves the average level of analgesic efficacy but also reduces outcome variability. In contrast, the distribution of parental anxiety shifts downward overall, with a more pronounced decline in acute pain and postoperative persistent pain scenarios. This suggests that the tool's predictable relief trajectory and stable nursing response enhance parents’ sense of security. This pattern aligns with the study's workflow design, which promotes timely re-evaluation, intervention, and reassessment through trend alerts and bedside dashboards, thereby reducing gaps in the experience of "delayed pain recognition" or "unconfirmed post-intervention outcomes."
To further elucidate the dynamics of satisfaction improvement, an exploratory network analysis was conducted, incorporating the explicitly defined specific outcomes (NRS satisfaction and VAS-A anxiety scores) alongside objective process metrics (e.g., dynamic pain trajectory slopes, peak magnitude, and nursing response latency) (Figure 7). Given the limited sample size, this analysis was intended solely to identify potential relational pathways rather than definitively establish causal networks. The exploratory network structure exhibited an aggregation pattern centered on "analgesia satisfaction," with its surrounding connections primarily derived from two categories of recorded variables. The first category comprises dynamic indicators and signals related to the alleviation process, such as the magnitude and trend changes in pain trajectories, which represent the speed and stability of pain perception from peak to relief. The second category involves nursing decision quality variables, particularly decision consistency and response latency, which reflect whether nurses can rapidly form consistent judgments and implement analgesia and reassessment in response to systematic prompts. Concurrently, parental anxiety showed an inverse correlation with satisfaction in the network and was more indirectly influenced through pathways such as response latency and alleviation speed, indicating that parental psychological reactions are more sensitive to "whether analgesia is promptly visible and continuously monitored" rather than merely the level of individual scores.
Temporal dynamics of pain and breakthrough events
This study advanced pain assessment from "single-sectional scores" to "continuous time trajectories" to better reflect the real clinical fluctuations of infant and young child pain. Based on multimodal data collected from three scenarios (painless baseline, short-term acute pain, and postoperative persistent pain), dynamic pain indicators were constructed and strictly synchronized with nursing decision logs in terms of time, thereby integrating the entire process from "the emergence of pain signals" to "the occurrence of nursing interventions" into a single timeline. During short-term acute stimulation, pain signals exhibited a rapid rise and peak within a short period, followed by a decline or plateau phase with intervention (Figure 8). In contrast, postoperative persistent pain more commonly follows a trajectory pattern of gradual escalation and multiple minor rebounds, suggesting that single-point scales may overlook risk windows of "progressive deterioration" and "repeated fluctuations." Continuous trajectories, however, can more clearly demonstrate slope changes and relief curves before and after interventions, shifting nursing judgments from "whether pain exists" to "how rapidly pain is changing," thereby enhancing the operability of precision analgesia.
The analysis of breakthrough pain events further supports the potential clinical value of dynamic monitoring. The temporal evolution of breakthrough pain frequency over 48 hours revealed clusters during the early postoperative period (Figure 9). While the overall incidence shows a gradual decline, intermittent rebounds and individual variations persist. The dynamic visualization tool, through trend alerts and real-time curves, enables nursing interventions to target risk escalation at its earliest stages. This approach not only reduces the density of breakthrough pain events but also shortens the response delay between symptom onset and the initiation of palliative analgesia. These findings suggest that temporal dynamic metrics may serve dual purposes: as outcome indicators assessing analgesia management quality, and as process indicators reflecting whether nursing decisions are "timely and appropriate".
Safety profile and clinical recovery outcomes
Clinical safety is the primary prerequisite for evaluating whether a novel assessment tool can be promoted in pediatric wards. This study focused on monitoring adverse reactions that may occur during analgesia management. During the study period, no serious adverse events (SAEs) such as respiratory depression or anaphylactic shock occurred (Table 4).
Among the common adverse reactions, there were no statistically significant differences in the incidence rates of nausea and vomiting (4.2% vs 9.5%), excessive sedation (4.2% vs 4.8%), and pruritus between the intervention group and the control group (all P > 0.05). Notably, although the intervention group exhibited a significantly faster response to analgesia, the overall risk of adverse drug reactions (ADRs) was not increased by the earlier intervention timing. The statistical results suggested that the dynamic visualization tool may help mitigate physiological index fluctuations caused by excessive analgesia by providing precise dose references, thereby maintaining a high level of safety.
In the clinical rehabilitation outcome dimension, children in the intervention group achieved more stable pain control, with a trend toward shorter first postoperative ambulation time and reduced mean length of hospital stay. This further highlights the potential value of precision pain management in promoting early recovery after surgery (ERAS) for pediatric patients.
In addition to the primary outcome measures, this study also evaluated the impact of dynamic visualization tools on clinical recovery and medical resource utilization in pediatric patients. Children in the intervention phase exhibited significant optimization trends in postoperative recovery speed and analgesic resource utilization (Table 5).
Regarding rehabilitation outcomes, the mean postoperative hospital stay in the intervention group was reduced from 5.8 ± 1.2 days in the control group to 4.6 ± 0.9 days (P = 0.024). This improvement may be attributed to precise pain control, which effectively reduced the children's stress responses and thereby accelerated the recovery of physiological functions. Additionally, the intervention group achieved first oral intake significantly earlier postoperatively than the control group, reflecting a more rapid restoration of intestinal function.
Regarding medical resource utilization, although there was no statistically significant difference in total analgesic consumption between the two groups, the number of unplanned rescue analgesics required by pediatric patients during the intervention phase was significantly reduced (P = 0.008). This indicates that the dynamic trend early warning system assists nurses in taking effective measures at the initial stage of pain exacerbation, thereby avoiding additional resource investment due to pain dysregulation. In summary, this tool not only improves nursing quality but also provides data support for optimizing resource allocation in pediatric wards.
Implementation feasibility and user load
The dynamic visualization tool demonstrated high usability in clinical settings (Table 6). The nurses' mean score on the System Usability Scale (SUS) for the system was 84.6, which, according to standard interpretation, falls within the upper quartile category, indicating that the interface design is intuitive and easily integrated into existing bedside care workflows.
In the task load dimension assessed via the NASA Task Load Index (NASA-TLX), compared with routine assessments during the control phase, the mental demand (Mental Demand) and temporal demand (Temporal Demand) of nurses during the intervention phase were significantly reduced. This finding has important clinical implications: the dynamic trend alert function alleviates the psychological pressure on nurses’ repetitive subjective judgments during busy work, transforming "passive monitoring" into "alert-assisted" decision-making. Although nurses' scores for physical demand (Physical Demand) increased slightly during the initial phase of tool implementation, their self-perceived performance (Performance) improved significantly as the learning curve stabilized (P < 0.001). These exploratory results suggest that this tool may enhance nursing precision without increasing additional practice burdens, demonstrating promising clinical application prospects.
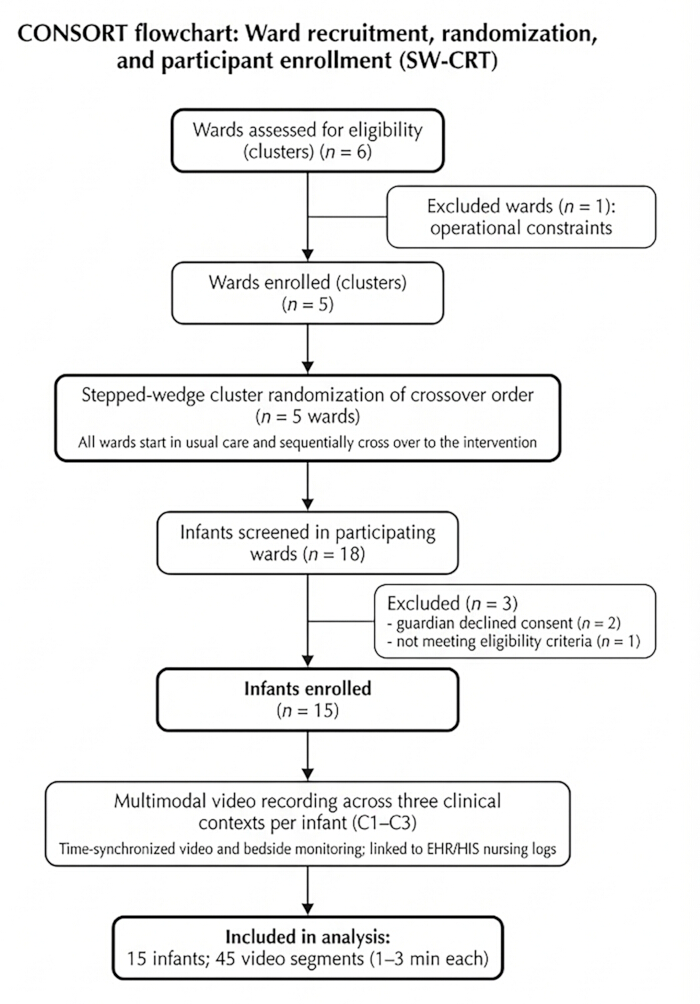
Figure 1: CONSORT Flowchart: Ward recruitment, randomization, and participant enrollment. Please click here to view a larger version of this figure.
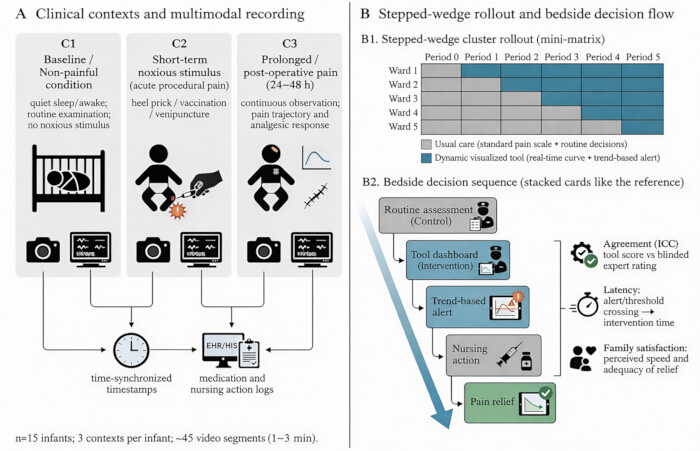
Figure 2: Schematic representation of the Stepped-Wedge Cluster Randomized Trial design across clinical wards. This figure illustrates the study design and workflow. (A) Clinical contexts and multimodal recording setup, showing the three scenarios: Baseline (C1), Short-term noxious stimulus (C2), and Prolonged/Post-operative pain (C3). (B) The stepped-wedge rollout schedule across five wards and the bedside decision flow, contrasting the routine assessment loop with the tool-assisted intervention loop. Please click here to view a larger version of this figure.
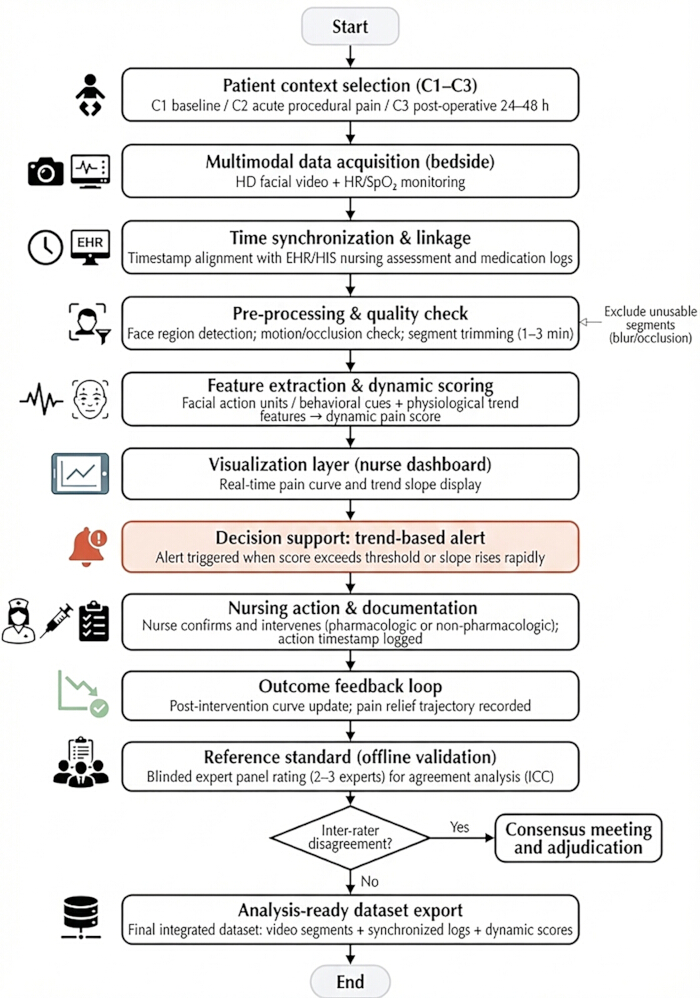
Figure 3: Implementation process flowchart. Please click here to view a larger version of this figure.
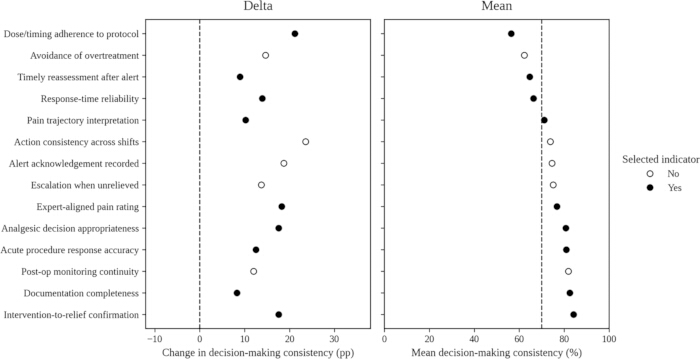
Figure 4: Mean nursing decision-making consistency and changes across selected indicators. Please click here to view a larger version of this figure.
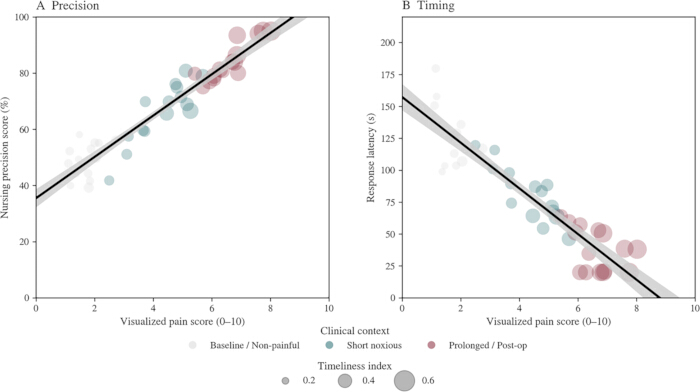
Figure 5: Correlation between visualized pain indicators and nursing precision metrics. (A) The relationship between visualized pain scores and nursing precision scores, showing a positive correlation where higher scores align closer to the expert gold standard. (B) The relationship between visualized pain scores and response latency, showing a negative correlation where clearer pain signals correspond to shorter decision-making windows. Bubble sizes represent the timeliness index. Please click here to view a larger version of this figure.
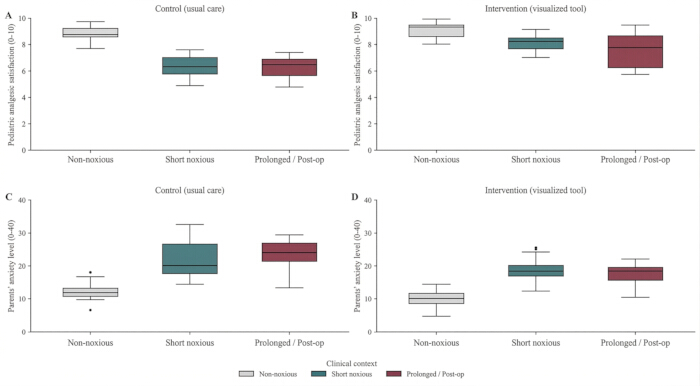
Figure 6: Box-plot representation of pediatric analgesic satisfaction scores and parents' anxiety levels. Comparison of outcomes across three clinical contexts (Non-noxious, Short noxious, Prolonged/Post-op). (A, C) Distributions of pediatric satisfaction and parental anxiety during the Control (usual care) phase. (B, D) Distributions during the Intervention (visualized tool) phase, showing an upward shift in satisfaction and a downward shift in anxiety levels. Please click here to view a larger version of this figure.
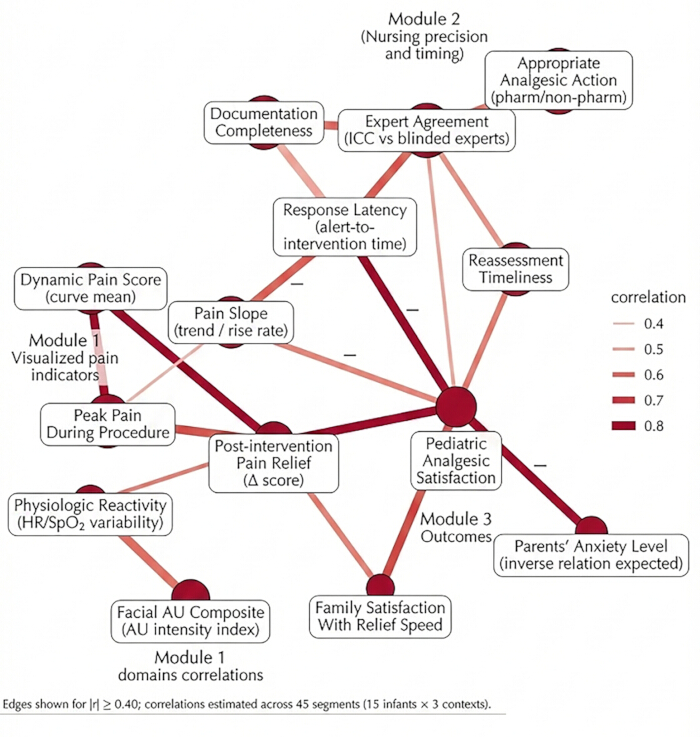
Figure 7: Network analysis of factors influencing pediatric satisfaction. Please click here to view a larger version of this figure.
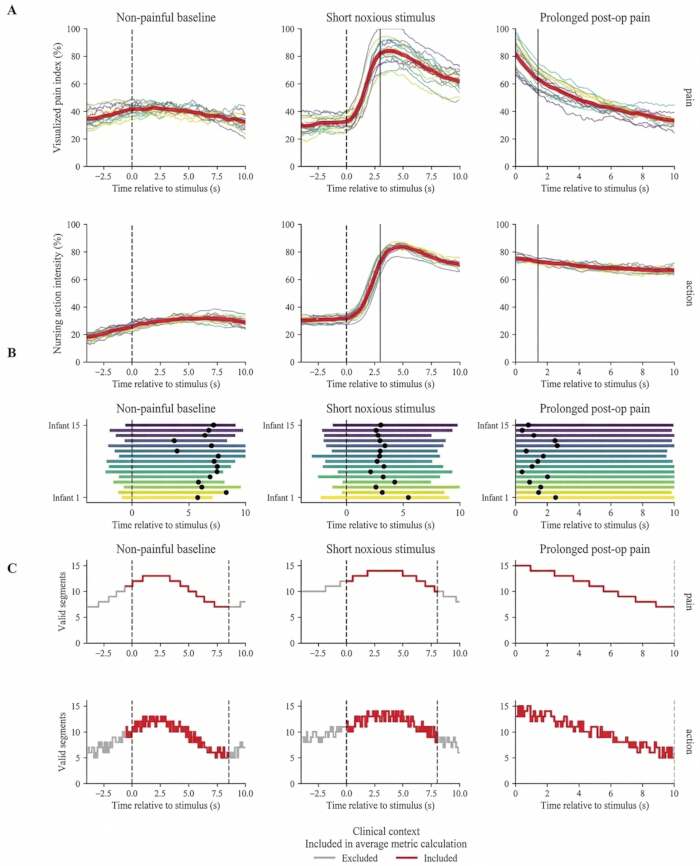
Figure 8: Comparison of dynamic pain trajectories and nursing intervention timing. (A) Visualized pain index trajectories across the three clinical contexts. (B) Nursing action intensity over time. (C) Valid video segments included in the analysis. The vertical lines indicate the timing of nursing interventions relative to the stimulus onset, demonstrating the temporal sensitivity of the tool. Please click here to view a larger version of this figure.
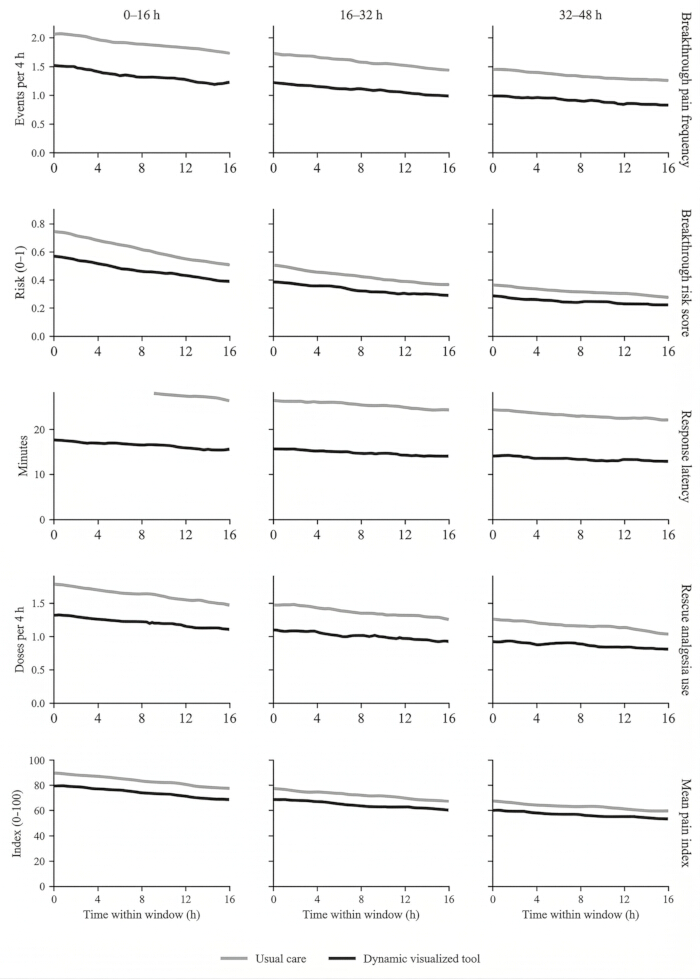
Figure 9: Temporal trends in breakthrough pain frequency, risk scores, response latency, rescue analgesic use, and mean pain index over 48 h. Please click here to view a larger version of this figure.
| Characteristics | Total | Control Phase | Intervention Phase | p-value |
| (N=15) | (n=7) | (n=8) | ||
| Infant Characteristics | ||||
| Age (months), Mean ± SD | 6.4 ± 3.2 | 6.2 ± 3.5 | 6.6 ± 2.9 | 0.814 |
| Gender, n (%) | 0.612 | |||
| Male | 9 (60.0) | 4 (57.1) | 5 (62.5) | |
| Female | 6 (40.0) | 3 (42.9) | 3 (37.5) | |
| Weight (kg), Mean ± SD | 7.82 ± 1.45 | 7.65 ± 1.52 | 7.97 ± 1.38 | 0.675 |
| Gestational age at birth (weeks) | 38.4 ± 1.6 | 38.2 ± 1.8 | 38.6 ± 1.4 | 0.628 |
| Type of Surgery, n (%) | 0.744 | |||
| General/Abdominal | 7 (46.7) | 3 (42.9) | 4 (50.0) | |
| Orthopedic | 5 (33.3) | 3 (42.9) | 2 (25.0) | |
| Genitourinary | 3 (20.0) | 1 (14.2) | 2 (25.0) | |
| Anesthesia type (General), n (%) | 15 (100) | 7 (100) | 8 (100) | |
| Baseline FLACC score (C1), Mean ± SD | 0.45 ± 0.52 | 0.48 ± 0.56 | 0.42 ± 0.49 | 0.823 |
| Heart rate at baseline (bpm) | 124.6 ± 12.3 | 126.2 ± 13.5 | 123.2 ± 11.2 | 0.645 |
| SpO2 at baseline (%) | 98.4 ± 1.2 | 98.2 ± 1.5 | 98.6 ± 0.9 | 0.537 |
| Nursing Staff Characteristics | ||||
| Total nurses involved (N=42) | 42 | 20 | 22 | - |
| Age (years), Mean ± SD | 29.4 ± 5.2 | 28.7 ± 4.8 | 30.1 ± 5.5 | 0.385 |
| Years of clinical experience, Mean ± SD | 7.2 ± 4.6 | 6.8 ± 4.1 | 7.5 ± 5.0 | 0.624 |
| Education level, n (%) | 0.852 | |||
| Bachelor's degree | 35 (83.3) | 16 (80.0) | 19 (86.4) | |
| Master's degree | 7 (16.7) | 4 (20.0) | 3 (13.6) | |
| Professional title, n (%) | 0.722 | |||
| Junior Nurse | 18 (42.9) | 9 (45.0) | 9 (40.9) | |
| Senior Nurse / Nurse in Charge | 24 (57.1) | 11 (55.0) | 13 (59.1) | |
| Previous pain management training, n (%) | 38 (90.5) | 18 (90.0) | 20 (90.9) | 0.921 |
| Nurse-to-patient ratio (night shift) | 1:6.2 | 1:6.4 | 1:6.1 | 0.754 |
| Ward (Cluster) Features | ||||
| Number of clusters | 5 | |||
| Mean patient turnover (monthly) | 142.4 | 138.6 | 145.8 | 0.582 |
Table 1: Demographic and clinical characteristics of children and nursing staff across trial phases.
| Outcome Variables | Control Phase | Intervention Phase | Adjusted Difference | p-value |
| (n = 21 segments) | (n = 24 segments) | (95% CI) | ||
| Nursing Precision Metrics | ||||
| Response latency (min), Median [IQR] | 15.4 [11.2, 21.8] | 6.7 [4.2, 9.5] | -8.7 [-10.5, -6.9] | < 0.001 |
| Assessment consistency (ICC) | 0.71 [0.62, 0.79] | 0.93 [0.88, 0.97] | 0.22 [0.14, 0.30] | < 0.001 |
| Protocol adherence rate, % | 66.70% | 91.70% | OR = 3.8 [1.6, 8.4] | 0.003 |
| Clinical & Satisfaction Outcomes | ||||
| Mean pain intensity (C2/C3) | 4.7 ± 1.3 | 3.2 ± 0.8 | -1.5 [-2.1, -0.9] | < 0.001 |
| Pediatric analgesic satisfaction (0–10) | 6.5 ± 1.4 | 8.8 ± 0.9 | 2.3 [1.6, 3.0] | < 0.001 |
| Parental anxiety score (0–10) | 5.8 ± 1.6 | 3.4 ± 1.1 | -2.4 [-3.1, -1.7] | < 0.001 |
| Breakthrough pain frequency (n) | 2.6 ± 0.7 | 1.2 ± 0.4 | -1.4 [-1.9, -0.9] | < 0.001 |
Table 2: Mixed-effect model results: Impact of the visualized tool on primary outcomes.
| Precision Metrics | Control Phase | Intervention Phase | t / χ2 | p-value |
| (n = 21) | (n = 24) | |||
| Response Latency (minutes) | ||||
| Overall Latency, Mean ± SD | 15.6 ± 4.2 | 6.8 ± 2.1 | 8.92 | < 0.001 |
| Moderate Pain (FLACC 4–6) | 17.8 ± 3.5 | 7.9 ± 1.8 | 11.24 | < 0.001 |
| Severe Pain (FLACC 7–10) | 12.4 ± 4.8 | 5.4 ± 1.2 | 6.35 | < 0.001 |
| Assessment Metrics | ||||
| Mean assessments per segment | 1.3 ± 0.6 | 2.9 ± 0.8 | -7.54 | < 0.001 |
| Pain onset captured < 2 min (%) | 9 (42.9) | 21 (87.5) | 9.87 | 0.002 |
| Dosing Accuracy | ||||
| Mean deviation from target dose (%) | 14.2 ± 6.8 | 4.6 ± 2.3 | 6.28 | < 0.001 |
| Accurate dosing (± 10%), n (%) | 14 (66.7) | 22 (91.7) | 4.31 | 0.038 |
| Under-dosing (> 10% below), n (%) | 5 (23.8) | 1 (4.2) | 3.82 | 0.051 |
| Over-dosing (> 10% above), n (%) | 2 (9.5) | 1 (4.2) | 0.51 | 0.475 |
Table 3: Detailed metrics of Nursing Precision: Response latency, assessment frequency, and dose accuracy.
| Adverse Events | Control Phase | Intervention Phase | p-value |
| (n = 21) | (n = 24) | ||
| Opioid-related Side Effects, n (%) | |||
| Nausea and Vomiting | 2 (9.5) | 1 (4.2) | 0.468 |
| Over-sedation (UMSS > 2) | 1 (4.8) | 1 (4.2) | 0.99 |
| Respiratory depression | 0 (0.0) | 0 (0.0) | - |
| Urinary retention | 1 (4.8) | 0 (0.0) | 0.278 |
| Pruritus | 1 (4.8) | 1 (4.2) | 0.99 |
| Systemic Safety Metrics | |||
| Bradycardia (Heart rate < 80 bpm) | 0 (0.0) | 0 (0.0) | - |
| Hypotension (MAP < 50 mmHg) | 1 (4.8) | 0 (0.0) | 0.278 |
| Desaturation (SpO2 < 92%) | 1 (4.8) | 0 (0.0) | 0.278 |
| Major Complications | |||
| Serious Adverse Events (SAEs) | 0 (0.0) | 0 (0.0) | - |
| Unplanned intervention escalation | 2 (9.5) | 1 (4.2) | 0.468 |
Table 4: Safety and adverse events (e.g., sedation, nausea) during the study period.
| Secondary Outcomes | Control Phase | Intervention Phase | t / Z | p-value |
| (n = 7) | (n = 8) | |||
| Recovery Metrics | ||||
| Post-operative stay (days), Mean ± SD | 5.8 ± 1.2 | 4.6 ± 0.9 | 2.54 | 0.024 |
| Time to first oral intake (hours) | 18.5 ± 4.6 | 12.4 ± 3.2 | 3.01 | 0.01 |
| Time to first mobilization (hours) | 24.8 ± 5.5 | 19.2 ± 4.8 | 2.12 | 0.053 |
| Resource Utilization | ||||
| Unplanned rescue analgesia (n), Mean ± SD | 2.6 ± 0.9 | 1.3 ± 0.6 | 3.28 | 0.008 |
| Total opioid consumption (mg/kg/day) | 0.42 ± 0.15 | 0.38 ± 0.12 | 0.58 | 0.574 |
| Nursing time for pain titration (min/h) | 8.4 ± 2.2 | 5.6 ± 1.5 | 2.89 | 0.012 |
| Cost Analysis | ||||
| Analgesia-related costs (USD), Mean ± SD | 145 ± 32 | 118 ± 26 | 1.79 | 0.096 |
Table 5: Secondary clinical outcomes: Length of hospital stay and resource utilization.
| Metrics | Control Phase | Intervention Phase | t / Z | p-value |
| (n = 20) | (n = 22) | |||
| System Usability Scale (SUS) | ||||
| Total Score (0–100), Mean ± SD | 84.6 ± 6.8 | |||
| Adjective Rating | Excellent | |||
| NASA Task Load Index (NASA-TLX) | ||||
| Mental Demand | 68.4 ± 12.5 | 42.6 ± 9.4 | 7.54 | < 0.001 |
| Physical Demand | 24.2 ± 8.6 | 28.5 ± 7.2 | -1.76 | 0.086 |
| Temporal Demand | 72.5 ± 11.4 | 48.2 ± 8.8 | 7.78 | < 0.001 |
| Effort | 65.8 ± 10.2 | 45.4 ± 7.6 | 7.35 | < 0.001 |
| Performance | 54.2 ± 13.8 | 82.6 ± 10.5 | -7.51 | < 0.001 |
| Frustration | 46.5 ± 14.2 | 22.4 ± 8.5 | 6.72 | < 0.001 |
| Tool Acceptance | ||||
| Ease of learning (1–7) | 4.2 ± 1.1 | 6.4 ± 0.6 | -8.12 | < 0.001 |
| Intention to use (1–7) | 3.8 ± 1.4 | 6.7 ± 0.4 | -9.24 | < 0.001 |
Table 6: Nurses' perception of tool usability (SUS) and mental workload (NASA-TLX).
Discussion
This study systematically evaluated the clinical utility of a pediatric pain visualization dynamic assessment tool in real-world clinical scenarios through a stepped cluster-randomized controlled trial14,15. Unlike previous studies that primarily focused on offline algorithmic validation1,2, our study's unique contribution lies in its real-world clinical implementation. By integrating real-time facial analysis with physiological monitoring into a stepped-wedge design, the current findings indicate that translating static AI outputs into continuous, actionable visual trajectories may improve both nursing decision precision and the pediatric healthcare experience16. These findings provide preliminary, evidence-based support for the digital transformation of precision nursing in pediatrics, aligning with recent reviews highlighting the efficacy of digital health interventions in optimizing pediatric pain care17.
Dynamic visualization alters nurses' perception of pain signals by shifting from static to continuous monitoring18. Traditional static scale assessments often only capture transient pain states, frequently resulting in a disconnect between evaluation and intervention19. Nursing response latency decreased from 15.4 to 6.7 min. This efficiency stems primarily from the continuous pain trajectory curve20. The visualization interface enables nurses to transition from passively waiting for pediatric crying to proactively intervening based on trend alerts, markedly enhancing their ability to identify disease deterioration and shortening response time. Furthermore, our exploratory analysis of nursing decision-making consistency suggests that inter-individual differences may converge post-intervention (Figure 4). By potentially shifting nursing activity trajectories from dispersion to concentration, the system's prompts appear to help different caregivers synchronize their recognition of pain changes. This "data-driven, consistent decision-making" model may help reduce subjective judgment bias and enhance continuity of care across shifts, providing preliminary support for precision-based pediatric pain management.
Precise pain control correlates with clinical rehabilitation benefits, potentially mitigating stress responses in line with Enhanced Recovery After Surgery (ERAS) principles 21,22. Recent studies have confirmed that protocolized, data-driven pain management may contribute to reduced length of stay and opioid consumption in the pediatric surgical population23. Precise pain trajectory analysis enables nursing teams to predict the risk of persistent pain and develop early individualized treatment plans. The reduction in unplanned rescue analgesia episodes observed in this study further indicates that dynamic visualization-assisted precise dosing not only reduces pain fluctuations but also improves the utilization efficiency of medical resources.
This study expanded the evaluation of analgesic outcomes beyond objective pain reduction to encompass overall improvement in the healthcare experience, using pediatric satisfaction and parental anxiety levels as patient-centered endpoints. Given the trial's coverage of baseline, acute, and persistent pain scenarios, this assessment emphasized situational and temporal sensitivity. This approach implies that the timeliness and consistency of nursing decisions may act as key mediators in translating analgesic interventions into positive experiences. Consequently, these findings highlight the value of humanistic care in improving psychological outcomes for pediatric patients and their families. During hospitalization, guardians' uncertainty and information asymmetry serve as primary sources of anxiety24. The observed increase in patient satisfaction and decrease in parental anxiety reflect the psychological benefit of visible pain management. Providing parents with clear and intuitive patient scores and recovery trajectories effectively enhances parental trust and improves their understanding of medical information25, as visual communication tools have been proven to facilitate parental comprehension of clinical data in acute care settings26. Furthermore, exploratory network analysis results preliminarily suggest a positive correlation between parental satisfaction and nursing response speed, indicating that visualization tools may enhance parents' perception of nursing quality by optimizing decision-making timeliness.
Implementation results suggest that digital tools are feasible for reducing nursing cognitive load. Although the introduction of new technologies often raises concerns about technical pressure, the intervention group showed a significant decrease in cognitive demand scores27. This predictive model relieves nurses from repetitive experience verification, allowing greater focus on clinical observation and humanistic care.
Several limitations of this study must be acknowledged. First, the small sample size (n = 15) and limited number of video segments inherently restrict the statistical power and the generalizability of the findings, particularly for secondary clinical outcomes and subgroup analyses. Consequently, the current results should be interpreted as preliminary and exploratory. Second, as a single-center trial, the findings may reflect institution-specific nursing cultures and protocols, which limit their external applicability to other clinical settings. Third, the relatively short observational window prevents the assessment of the tool's long-term impact on chronic pain development. Despite these limitations, the study's strengths include the use of a stepped-wedge cluster-randomized design, which effectively controls for temporal trends, and the successful integration of real-time multimodal data within a pragmatic clinical environment. These initial findings provide a necessary methodological foundation for future large-scale, multicenter randomized trials.
In conclusion, dynamic visualization tools represent a potential shift in nursing practice from experience-driven to data-driven assessment. The study suggests potential dual improvements in nursing precision and patient outcomes while ensuring clinical safety. Future research could further explore integrating artificial intelligence prediction algorithms into this system, facilitating a transition from real-time dynamic evaluation to predictive analgesia management28. This advancement would provide broader theoretical foundations for establishing intelligent pediatric wards.
Disclosures
The authors have no conflicts of interest to disclose.
Acknowledgements
The authors express their gratitude to the colleagues of the General Surgery and Neonatal Surgery Nursing Team at Capital Medical University Affiliated Capital Children's Medical Center for their support and assistance. We also sincerely thank the pediatric patients and their guardians who participated in this study. This research received no specific grant from any funding agency in the public, commercial, or not-for-profit sectors.
Materials
| Name | Company | Catalog Number | Comments |
|---|---|---|---|
| Bedside physiological monitor | Standard hospital equipment | N/A | Heart rate and SpO2 synchronization |
| Dynamic pain visualization system | In-house developed | v1.0 | Real-time pain curve generation and alerts |
| Electronic Health Record (EHR) system | Hospital information center | N/A | Timestamped nursing actions and medication records |
| High-definition bedside camera | Generic medical imaging supplier | 1080p HD | Used for continuous facial video capture |
| Statistical analysis software | IBM | SPSS 26.0 | Used for GLMM and ICC analysis |
References
- Giordano, V., et al. Comparative analysis of artificial intelligence and expert assessments in detecting neonatal procedural pain. Sci Rep. 14 (1), 20374 (2024).
- Yang, N., et al. Feasibility and effectiveness of a low-code AI platform for developing a neonatal multimodal pain classification model. J Multidiscip Healthc. 18, 5771-5780 (2025).
- Sullivan, D., Frazer, C. Navigating pediatric pain: emerging trends and best practice. Crit Care Nurs Clin North Am. 36 (4), 479-494 (2024).
- Jiang, L., et al. Construction and validation of a pain facial expressions dataset for critically ill children. Sci Rep. 15 (1), 17214 (2025).
- Lee, H., Lee, H., Oh, S., Park, C. G. Factors associated with pain perception and management among paediatric nurses and nursing students using virtual children: a comparative study. J Adv Nurs. 81 (5), 2500-2509 (2025).
- Hamilton, R., et al. Facilitators and barriers to the implementation of a digital pain assessment tool in pediatric oncology practice: a qualitative evaluation of a quality improvement project. J Pediatr Hematol Oncol Nurs. 41 (4), 283-291 (2024).
- Neelapala, Y. V. R., Bhagat, M., Frey-Law, L. Conditioned pain modulation in chronic low back pain: a systematic review of literature. Clin J Pain. 36 (2), 135-141 (2020).
- Atefeh, S. Barriers and facilitators of pain management in children: a scoping review. BMC Anesthesiol. 25 (1), 148 (2025).
- Mohanty, S. K., et al. Prevalence of pain and its treatment among older adults in India: a nationally representative population-based study. Pain. 164 (2), 336-348 (2023).
- Marwah, H., Moldovanu, S. R., Reks, T., Anthony, B., Logan, D. E. Integrating physiologic assessment into virtual reality-based pediatric pain intervention: a feasibility study. Virtual Worlds. 4 (4), 47 (2025).
- Miró, J., et al. Development, implementation and evaluation of a digital treatment for adolescents with chronic pain: a protocol for a multi-phase study. Front Digit Health. 7, 1555733 (2025).
- Eccleston, C., et al. Managing patients with chronic pain during the COVID-19 outbreak: considerations for the rapid introduction of remotely supported (eHealth) pain management services. Pain. 161 (5), 889-893 (2020).
- Simon, J., et al. Pain monitoring app leads to less pain in children with cancer at home: results of a randomized controlled trial. Cancer. 130 (13), 2339-2350 (2024).
- Hart, S. G. NASA-task load index (NASA-TLX): 20 years later. , (2006).
- Bergamasco, L., et al. Pain assessment in neonatal clinical practice via facial expression analysis and deep learning. , (2024).
- McCabe, C., Feeney, A., Basa, M., Eustace-Cook, J., McCann, M. Nurses knowledge, attitudes and education needs towards acute pain management in hospital settings: a meta-analysis. J Clin Nurs. 32 (15-16), 4325-4336 (2023).
- Birnie, K. A., et al. Recommendations for selection of self-report pain intensity measures in children and adolescents: a systematic review and quality assessment of measurement properties. Pain. 160 (1), 5-18 (2019).
- Sansone, L., et al. Pain evaluation and treatment in children: a practical approach. Children (Basel). 10 (7), 1212 (2023).
- Manworren, R. C., Stinson, J. Pediatric pain measurement, assessment, and evaluation. Semin Pediatr Neurol. 23 (3), 189-200 (2016).
- Jusufi, L., et al. Pediatric pain management: an observational study on nurses' knowledge of non-pharmacological techniques. Nurs Rep. 15 (8), 290 (2025).
- National Clinical Research Center for Child Health and Diseases. Evidence-based guideline for neonatal pain management in China (2023). Chin J Contemp Pediatr. 25 (2), 109-127 (2023).
- O'Donnell, F. T., Rosen, K. R. Pediatric pain management: a review. Mo Med. 111 (3), 231-237 (2014).
- Rove, K. O., Edney, J. C., Brockel, M. A. Enhanced recovery after surgery in children: promising, evidence-based multidisciplinary care. Paediatr Anaesth. 28 (6), 482-492 (2018).
- Yuan, L. Effect of educational interventions for improving nurses' knowledge, attitude, and practice of pediatric pain management: a systematic review and meta-analysis. Pain Manag Nurs. 25 (4), e271-e278 (2024).
- Pérez-Pozuelo, J. M., et al. Effectiveness of non-pharmacological methods in reducing pain in pediatric patients and the role of nursing: systematic review. Front Pediatr. 13, 1729847 (2025).
- Fisher, E., Heathcote, L. C., Eccleston, C., Simons, L. E., Palermo, T. M. Assessment of pain anxiety, pain catastrophizing, and fear of pain in children and adolescents with chronic pain: a systematic review and meta-analysis. J Pediatr Psychol. 43 (3), 314-325 (2018).
- Palomaa, A. K., Hakala, M., Pölkki, T. Parents' perceptions of their child's pain assessment in hospital care: a cross-sectional study. J Pediatr Nurs. 71, 79-87 (2023).
- Salekin, M. S., Zamzmi, G., Goldgof, D., Kasturi, R., Ho, T., et al. Multimodal spatio-temporal deep learning approach for neonatal postoperative pain assessment. Comput Biol Med. 129, 104150 (2021).