This bibliometric analysis used CiteSpace, VOSviewer, and Scimago Graphica to evaluate publication trends, collaboration networks, and emerging research hotspots in T-lymphocyte metabolic reprogramming research from 2016 to 2025.
Research Article
* These authors contributed equally
This bibliometric analysis used CiteSpace, VOSviewer, and Scimago Graphica to evaluate publication trends, collaboration networks, and emerging research hotspots in T-lymphocyte metabolic reprogramming research from 2016 to 2025.
T lymphocytes are central regulators of immune responses, and recent studies have shown that metabolic processes influence T-lymphocyte activation, differentiation, and effector function in cancer and autoimmune diseases. This study performed a bibliometric analysis of publications from January 1, 2016, to December 31, 2025, retrieved from the Web of Science Core Collection. CiteSpace was used for co-occurrence, co-citation, and clustering analyses of references and keywords. VOSviewer was applied to analyze journals, authors, references, countries, and institutions, while Scimago Graphica visualized national collaboration networks and Excel was used to evaluate annual publication trends. A total of 1,882 publications were included. Annual publication output increased steadily, with notable growth observed in 2021 and 2025. China contributed the highest publication volume, whereas the United States demonstrated greater citation impact. Frontiers in Immunology was the most productive journal, while Nature showed the highest citation influence. Keyword clustering and citation analyses identified evolving research hotspots focused on T-lymphocyte metabolic reprogramming, glucose and amino acid metabolism, and emerging interest in immune-cell metabolic interactions. Overall, this bibliometric analysis demonstrates continued expansion of research in T-lymphocyte immunometabolism and highlights emerging thematic directions, including intercellular metabolic regulation and lipid metabolism.
Naïve T lymphocytes primarily rely on mitochondrial oxidative phosphorylation (OXPHOS) to maintain their quiescent and low-energy metabolic state1. Upon antigen stimulation, however, activated T lymphocytes undergo a metabolic shift toward aerobic glycolysis to support rapid proliferation and effector function2. Effector T lymphocytes, particularly cytotoxic subsets, depend on glycolysis to meet the increased bioenergetic and biosynthetic demands associated with cytokine production and cellular expansion3. Although glycolysis produces less adenosine triphosphate (ATP) per glucose molecule than OXPHOS, its rapid metabolic rate supports the functional requirements of activated immune cells4. Excessive glycolytic activity may also contribute to detrimental effects within the immune microenvironment. Lactate accumulation can impair glucose-derived serine synthesis and alter intracellular redox balance, thereby suppressing T-lymphocyte proliferation and function5. In addition, elevated lactate levels disrupt glycolysis-dependent migration pathways and reduce the motility of CD4⁺ and CD8⁺ T lymphocytes6,7.
Cellular metabolism dynamically adapts to environmental and physiological stimuli through a process known as metabolic reprogramming8,9. Increasing evidence indicates that metabolic reprogramming plays a central role in regulating T-lymphocyte activation, differentiation, and functional plasticity10,11. These metabolic alterations are particularly relevant in cancer and autoimmune diseases, where changes in the immune microenvironment influence T-lymphocyte function and immune regulation12,13. Although several bibliometric studies have evaluated immunometabolism in broader contexts, including cancer immunometabolism and disease-associated immune metabolism, these analyses mainly focus on generalized immune-metabolic interactions rather than T-lymphocyte-specific metabolic reprogramming14,15. A comprehensive bibliometric evaluation dedicated specifically to T-lymphocyte immunometabolism remains limited, particularly with respect to research trends, collaboration networks, and evolving thematic hotspots within this field.
To address this gap, this study performed a bibliometric analysis of publications indexed in the Web of Science Core Collection (WOScc) from January 1, 2016 to December 31, 2025. CiteSpace, VOSviewer, and Scimago Graphica were used to quantitatively analyze publication output, collaboration patterns, co-citation relationships, and thematic evolution in T-lymphocyte metabolic reprogramming research. Unlike traditional narrative reviews, bibliometric analysis provides a structured and data-driven overview of the scientific landscape through citation, clustering, and keyword analyses. The objective of this study was to systematically characterize global research trends and emerging hotspots in T-lymphocyte immunometabolism and to provide an organized overview of the current knowledge landscape in this rapidly evolving field.
This study exclusively analyzed bibliographic data retrieved from publicly accessible databases and did not involve human participants, animals, or identifiable personal data; therefore, institutional ethics approval and informed consent were not required.
Data Collection and Search Strategy
Data were extracted from the WoSCC (https://www.webofscience.com/wos/woscc/) on January 27, 2026. The database editions selected were the Science Citation Index Expanded (SCI-EXPANDED) and Social Sciences Citation Index within WoSCC. The search was conducted using the Advanced Search interface. The search strategy was applied in the “Topic (TS)” field, and the complete search query and resulting records are presented in Table 1. The search period was restricted to publications indexed between January 1, 2016 and December 31, 2025 using the WoSCC “Timespan” filter. Only original research articles and review articles were included using the “Document Types” filter. The language was restricted to English, and no restrictions were applied regarding country, institution, or research area. All records were exported in plain text format with “Full Record and Cited References” selected during export. When the number of retrieved records exceeded 500, records were downloaded in multiple batches and subsequently merged into a single dataset prior to analysis. After retrieval, all records were imported into CiteSpace for preprocessing and bibliometric analysis. Duplicate records were identified and removed using the built-in deduplication function in CiteSpace based on bibliographic metadata, including title, authors, publication year, and source journal. When potential inconsistencies or incomplete bibliographic records were identified, manual verification was additionally performed to ensure data accuracy and consistency before analysis.
| Set | Results | Search Query |
| #1 | 252,461 | TS=("T cell*" OR "T-cell*" OR "T lymphocyte*" OR "T-lymphocyte*" OR "T-lymph*" OR "CD4+ T cell*" OR "CD8+ T cell*" OR "cytotoxic T cell*" OR "regulatory T cell*" OR "Treg*" OR "T helper cell*" OR "Th cell*" OR "naive T cell*" OR "memory T cell*" OR "effector T cell*") |
| #2 | 13,799 | TS=("metabolic reprogram*" OR "metabolic remodel*" OR "metabolic rewiring") |
| #3 | 1,882 | #1 AND #2 |
Table 1: Web of Science Core Collection search strategy used for bibliometric data retrieval. The table summarizes the detailed search strategy, keyword combinations, Boolean operators, and final retrieval counts used for literature collection from the WoSCC. Searches were performed using the “Topic (TS)” field in the Advanced Search interface. Wildcards (*) were used to retrieve multiple word endings and related terminology. The final dataset consisted of publications indexed between January 1, 2016 and December 31, 2025 after application of language and document-type filters.
Analytical Approaches
A multitool bibliometric approach was systematically implemented for data analysis. The analysis was conducted in a Windows 10 operating system environment. CiteSpace (v.5.7.R2) was used to analyze references and keywords by processing TXT-format data exported from WoSCC. The CiteSpace parameters were configured as follows: (1) time slicing was set from 2016 to 2025 with one year per slice; (2) selection criteria were configured using the g-index (k = 25); (3) pruning methods included Pathfinder, Pruning Sliced Networks, and Pruning the Merged Network to simplify network structures while preserving key relationships; and (4) clustering analysis was performed using the log-likelihood ratio algorithm16. This analysis generated co-citation networks, clustering maps, timeline visualizations, and burst detection maps for both references and keywords. In the visualization maps, node size represented frequency, link thickness indicated co-occurrence strength, and purple rings represented high betweenness centrality. Burst nodes reflected a sudden increase in citation or keyword frequency over time.
Subsequently, the exported files were re-saved in UTF-8 encoding using Windows Notepad and imported into VOSviewer (version 1.6.20) for bibliometric mapping, including co-authorship, co-citation, and co-occurrence analyses across authors, journals, institutions, and countries17. The full-counting method was applied, and normalization was performed using the association-strength method. Minimum occurrence thresholds were established according to dataset size (authors ≥ 5 publications; keywords ≥ 5 occurrences; institutions ≥ 3 publications). Network visualization was based on item weight and total link strength. For country-level collaboration analysis, GML files exported from VOSviewer were imported into Scimago Graphica (version 1.0.53), where nodes represented countries. Network visualization and clustering were generated using the default force-directed layout algorithm to represent spatial relationships and collaboration patterns among countries. WPS Excel was used for descriptive statistical analysis of annual publication trends and basic data summarization. Results were visualized using bar charts, column charts, and line graphs.
A supplementary time-sliced analysis was performed using the same search strategy described above, with the search restricted to publications indexed between January 1, 2025 and December 31, 2025. Within the same WoSCC query framework and analytical environment, recent publications and conference-related outputs were retrieved for contextual and descriptive purposes. This procedure was conducted entirely within the built-in analytical interface of the WoSCC. No independent dataset was created, and the retrieved information was not integrated into the primary bibliometric dataset or used for quantitative analysis. The overall study design and bibliometric analysis workflow are summarized in a flowchart (Figure 1).
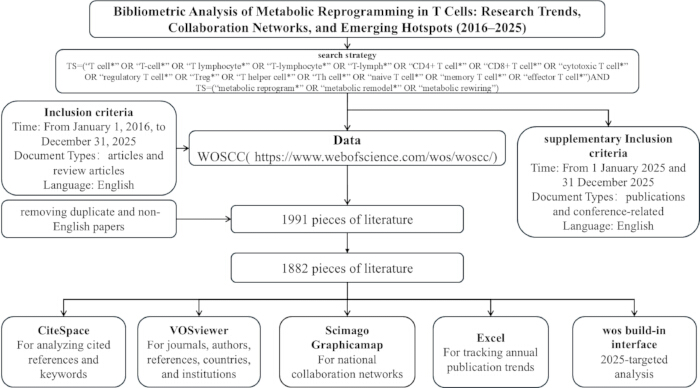
Figure 1. Workflow of the bibliometric analysis of T-lymphocyte metabolic reprogramming research. Schematic overview of the study design and analytical workflow used in this bibliometric analysis. Publications were retrieved from the Web of Science Core Collection (WoSCC) using predefined search strategies and inclusion criteria. Retrieved records were exported in plain text format and subjected to preprocessing, including duplicate removal and bibliographic data standardization. Bibliometric analyses were conducted using CiteSpace for co-citation, keyword co-occurrence, clustering, and burst detection analyses, and VOSviewer for collaboration network analyses among authors, institutions, countries, and journals. Scimago Graphica was used to visualize international collaboration networks, and WPS Excel was used to analyze annual publication trends and descriptive statistics. Please click here to view a larger version of this figure.
Publication Output and Temporal Trends
To characterize the temporal evolution of research activity in this field, a bibliometric analysis was performed using publications indexed in the WoSCC. A total of 1,991 records were initially retrieved over the past decade. After removal of duplicate and non-English records, 1,882 publications were ultimately included and analyzed, including 1,046 original research articles and 836 review articles. Annual publication and citation trends from 2016 to 2025 are presented in Figure 2, demonstrating a consistent increase in research activity over time. In 2020, publication counts increased by 40 articles and citation counts increased by 1,989 compared with 2019. Between 2021 and 2024, citation counts continued to increase annually, whereas publication counts showed relatively smaller year-to-year changes, except for an increase of 55 articles in 2021. In 2025, publication counts increased from 252 to 629, while citation counts increased from 13,045 to 21,103. These findings indicate sustained growth in scientific interest and academic influence in T-lymphocyte metabolic reprogramming research during the study period.

Figure 2. Annual publication and citation trends in T-lymphocyte metabolic reprogramming research from 2016 to 2025. Annual number of publications and total citations related to metabolic reprogramming in T lymphocytes retrieved from the WoSCC database between 2016 and 2025. Blue bars represent annual publication counts and indicate yearly research productivity. The orange line represents total citation counts and reflects the academic influence and citation impact of publications indexed during each year. Please click here to view a larger version of this figure.
Country-Level Contributions and Collaboration
Country-level analysis indicated that China had the highest publication volume, contributing 997 publications, whereas the United States contributed 510 publications (Figure 3A). Publication trends differed between the two countries over time. Publication output from China increased steadily throughout the study period, whereas the United States exhibited two local publication peaks followed by a decline in annual output prior to 2025 (Figure 3B). In 2025, publication output increased substantially in both countries, with increases of 296 publications for China and 42 publications for the United States compared with the previous year. Collaboration network analysis identified extensive interactions among multiple countries (Figure 4A) and delineated five major country clusters based on co-authorship patterns (Figure 4B). The United States, China, and South Korea formed one densely connected collaboration cluster, whereas additional clusters included countries from Europe, Asia, and the Americas. Most countries demonstrated collaborative links with the United States, suggesting a central role for the United States within the international collaboration network.

Figure 3. International publication trends in T-lymphocyte metabolic reprogramming research from 2016 to 2025. (A) Annual publication output of the top 10 countries with the highest publication volume in T-lymphocyte metabolic reprogramming research between 2016 and 2025. Different colored lines represent individual countries and illustrate temporal changes in publication productivity. (B) Comparative annual publication trends between China and the United States showing changes in research output over time. Please click here to view a larger version of this figure.

Figure 4. International collaboration networks in T-lymphocyte metabolic reprogramming research from 2016 to 2025. (A) International collaboration network among the top 20 contributing countries generated using bibliometric network analysis. Node size represents publication volume, link thickness indicates collaboration strength between countries, and different colors represent distinct collaboration clusters. (B) Chord diagram illustrating collaborative interactions among countries. The width of each connecting chord corresponds to the intensity of collaboration between paired countries. Please click here to view a larger version of this figure.
Institutional Productivity and Collaboration
Institutional productivity analysis demonstrated that Chinese institutions accounted for nine of the top 10 most productive institutions, whereas the remaining institution was based in the United States (Figure 5A). Shanghai Jiao Tong University ranked first with 74 publications, followed by Fudan University with 66 publications and Central South University with 51 publications. Most highly productive Chinese institutions were universities predominantly located in southern China. Citation-based rankings showed a different distribution pattern compared with publication productivity (Figure 5B). Harvard University ranked first with 2,997 citations, followed by the Max Planck Institute of Immunobiology and Epigenetics with 2,682 citations. Among Chinese institutions, Central South University had the highest citation count, with 2,288 citations. The institutional collaboration network demonstrated extensive interconnectivity among institutions (Figure 5C). Shanghai Jiao Tong University exhibited the highest total link strength (62), suggesting frequent collaborative relationships with other institutions, particularly within China.

Figure 5. Institutional productivity and collaboration analysis in T-lymphocyte metabolic reprogramming research from 2016 to 2025. (A) Horizontal bar chart ranking the top 10 institutions according to publication volume. (B) Horizontal bar chart ranking the top 10 institutions according to total citation counts. (C) Institutional collaboration network generated using VOSviewer. Node size represents institutional publication output, link thickness reflects collaboration strength, and different colors indicate distinct collaboration clusters. Please click here to view a larger version of this figure.
Author Productivity and Impact
Among the top 10 authors ranked by publication volume, Ping-Chih Ho had the highest number of publications (18 documents), followed by Li, Hui with 14 publications and several additional authors with 10–12 publications (Figure 6A). Citation analysis demonstrated that Erika L. Pearce had the highest citation count (2,384), followed by Ping-Chih Ho (1,641) and Romero Pedro (1,352) (Figure 6B). Ping-Chih Ho authored 18 publications, received 1,641 citations, and exhibited a total link strength of 23, suggesting a central role within the author collaboration network. Co-citation analysis further illustrated the distribution of citation frequency among cited authors. Chang C.H. had the highest citation count (561), whereas the lowest-ranked author within the top 10 group had 278 citations (Figure 7A). Network analysis demonstrated that highly cited authors generally exhibited higher total link strength values, suggesting stronger co-citation relationships and broader integration within the research network (Figure 7B).

Figure 6. Author productivity and citation impact analysis in T-lymphocyte metabolic reprogramming research from 2016 to 2025. (A) Horizontal bar chart ranking authors according to publication volume. (B) Horizontal bar chart ranking authors according to total citation counts. Bar length represents the number of publications or citations associated with each author. Please click here to view a larger version of this figure.

Figure 7. Analysis of cited authors in T-lymphocyte metabolic reprogramming research from 2016 to 2025. (A) Gradient-style bar chart ranking cited authors according to total citation counts. (B) Gradient-style bar chart illustrating the total link strength among cited authors in the co-citation network. Bar length represents citation frequency or total link strength, and darker color intensity represents higher citation frequency or stronger co-citation relationships. Please click here to view a larger version of this figure.
Journal Performance in Publications and Citations
Table 2 summarizes the top 10 journals with the highest publication volume in T-lymphocyte metabolic reprogramming research, including citation counts and total link strength values. Frontiers in Immunology had the highest publication output with 203 publications, whereas Cell Metabolism exhibited the highest impact factor (30.9) among the most productive journals (Figure 8A). Most journals were classified within the Journal Citation Reports (JCR) Q1 category (Figure 8B). In the journal collaboration network, five journals demonstrated total link strength values exceeding 100, with Frontiers in Immunology exhibiting the highest total link strength (549), indicating strong connectivity within the journal collaboration network (Figure 8C). Citation analysis of cited journals demonstrated that Nature had the highest citation frequency (6,331), followed by Immunity (6,061) (Table 3 and Figure 9A). Frontiers in Immunology ranked third in citation frequency (5,685), despite having a lower impact factor compared with several other highly cited journals. Co-citation network analysis showed strong collaborative relationships among cited journals, with high total link strength values observed across the network (Figure 9B). These findings indicate that highly influential journals in this field are characterized by both strong citation impact and extensive inter-journal connectivity.
| Rank | Journals | Frequency | Citations | Total Link Strength |
| 1 | Frontiers in Immunology | 203 | 3993 | 549 |
| 2 | Frontiers in Oncology | 55 | 1366 | 113 |
| 3 | International Journal of Molecular Sciences | 49 | 1112 | 128 |
| 4 | Nature Communications | 33 | 2511 | 96 |
| 5 | Cancers | 31 | 659 | 54 |
| 6 | Advanced Science | 27 | 1476 | 136 |
| 7 | Cell Reports | 27 | 329 | 56 |
| 8 | Cell Metabolism | 25 | 3076 | 184 |
| 9 | International Immunopharmacology | 23 | 243 | 45 |
| 10 | Scientific Reports | 22 | 197 | 16 |
Table 2: Top 10 journals by publication volume in T-lymphocyte metabolic reprogramming research from 2016 to 2025. The table summarizes the 10 journals with the highest publication output in T-lymphocyte metabolic reprogramming research retrieved from the WoSCC. Frequency represents the number of publications indexed in the dataset. Citations indicate total citation counts associated with publications from each journal. Total link strength represents the degree of connectivity and collaborative association within the journal co-occurrence network generated using VOSviewer.

Figure 8. Journal performance metrics and collaborative network analysis in T-lymphocyte metabolic reprogramming research. (A) Distribution of impact factors among the top 10 journals with the highest publication volume. (B) Citation counts among the top 10 most productive journals. (C) Journal collaboration and co-citation network generated using bibliometric analysis. Bar length represents publication volume, impact factor, citation count, or total link strength within the journal network. Impact factors and quartile rankings were retrieved from Journal Citation Reports (JCR). Please click here to view a larger version of this figure.
| Rank | Cited Journal | Frequency | IF | JCR Quartile |
| 1 | Nature | 6331 | 48.5 | Q1 |
| 2 | Immunity | 6061 | 26.3 | Q1 |
| 3 | Frontiers in Immunology | 5685 | 5.9 | Q1 |
| 4 | Cell | 5539 | 42.5 | Q1 |
| 5 | Journal of Immunology | 5275 | 3.4 | Q2 |
| 6 | Cell Metabolism | 4974 | 30.9 | Q1 |
| 7 | Nature Communications | 4515 | 15.7 | Q1 |
| 8 | Nature Immunology | 4345 | 27.6 | Q1 |
| 9 | Proceedings of the National Academy of Sciences of the United States of America | 3838 | 9.1 | Q1 |
| 10 | Cancer Research | 3818 | 16.6 | Q1 |
Table 3: Top 10 cited journals in T-lymphocyte metabolic reprogramming research from 2016 to 2025. The table summarizes the top 10 cited journals identified in the co-citation analysis of T-lymphocyte metabolic reprogramming research retrieved from the WoSCC. Frequency represents the total citation frequency of each journal within the dataset. IF indicates the journal impact factor, and JCR represents the Journal Citation Reports quartile classification. Journal metrics were used to evaluate the citation influence and academic prominence of cited journals within the bibliometric network.

Figure 9. Cited journal performance metrics and collaborative network analysis in T-lymphocyte metabolic reprogramming research. (A) JCR quartile distribution of the top 10 cited journals. (B) Co-citation network analysis illustrating collaborative relationships among cited journals. Bar length represents citation frequency or total link strength within the journal co-citation network. Journal metrics were obtained from JCR. Please click here to view a larger version of this figure.
Reference Analysis
Reference clustering analysis identified multiple interconnected thematic clusters, with the top 10 clusters presented in Figure 10A. Among these, cluster #0 (macrophage polarization) and cluster #2 (T lymphocytes) were associated with immune-cell functional regulation. Clusters #4 (tumor microenvironment) and #7 (T-cell exhaustion) demonstrated close network connectivity, reflecting their related research themes. Additional clusters associated with metabolic pathways were also identified, including cluster #3 (lactylation), cluster #9 (glutamine metabolism), cluster #1 (lipid metabolism), and cluster #10 (amino acid metabolism). In addition, “prognosis” (cluster #6) was identified as a distinct thematic cluster within the co-citation network. Reference co-citation analysis identified highly influential references within the research field (Figure 10B). The top 10 references were ranked according to citation frequency (Table 4) and betweenness centrality (Table 5). Earlier highly cited studies, particularly those published after 2016, primarily focused on immune-metabolic regulatory mechanisms and metabolic interactions within the tumor microenvironment, including regulatory T-cell metabolic adaptation. Studies published between 2019 and 2022 increasingly investigated metabolism-targeted therapeutic strategies, including glutamine blockade and the lactate–PD-1 signaling axis. High-centrality references were mainly associated with interactions between cellular metabolism and immune-cell functionality, including immune polarization, T-cell exhaustion, and epigenetic regulation. One highly cited study published in 2018 reported that metabolic reprogramming within the tumor microenvironment was associated with reduced efficacy of adoptive T-cell therapy.

Figure 10. Reference cluster and co-citation analyses in T-lymphocyte metabolic reprogramming research. (A) Cluster analysis of cited references showing the top 10 reference clusters identified using CiteSpace. Different colors represent distinct thematic clusters. (B) Reference co-citation network generated using bibliometric analysis. Node size represents citation frequency, and connecting lines indicate co-citation relationships between references. Please click here to view a larger version of this figure.
| Rank | Reference Information | Article Title | Journal Title | Citations |
| 1 | Watson, M. J. (2021) | Metabolic support of tumour-infiltrating regulatory T cells by lactic acid | Nature | 133 |
| 2 | Kumagai, S. (2022) | Lactic acid promotes PD-1 expression in regulatory T cells in highly glycolytic tumor microenvironments | Cancer Cell | 105 |
| 3 | Xia, L. (2021) | The cancer metabolic reprogramming and immune response | Molecular Cancer | 102 |
| 4 | Leone, R. D. (2019) | Glutamine blockade induces divergent metabolic programs to overcome tumor immune evasion | Science | 100 |
| 5 | Faubert, B. (2020) | Metabolic reprogramming and cancer progression | Science | 89 |
| 6 | Sung, H. (2021) | Cancer Statistics 2020: GLOBOCAN estimates of incidence and mortality worldwide for 36 cancers in 185 countries | CA: A Cancer Journal for Clinicians | 85 |
| 7 | Leone, R. D. (2020) | Metabolism of immune cells in cancer | Cancer | 83 |
| 8 | Angelin, A. (2017) | Foxp3 reprograms T-cell metabolism to function in low-glucose, high-lactate environments | Cell Metabolism | 83 |
| 9 | Chang, C. H. (2015) | Metabolic competition in the tumor microenvironment is a driver of cancer progression | Cell | 74 |
| 10 | Wang, H. (2020) | CD36-mediated metabolic adaptation supports regulatory T-cell survival and function in tumors | Nature Immunology | 74 |
Table 4: Top 10 most cited references in T-lymphocyte metabolic reprogramming research from 2016 to 2025. The table summarizes the top 10 most frequently cited references identified through co-citation analysis in T-lymphocyte metabolic reprogramming research. Citation frequency represents the total number of citations received within the bibliometric dataset retrieved from the WoSCC. The table includes the first author, publication year, article title, journal title, and total citation counts associated with each reference.
| Rank | Reference Information | Article Title | Journal Title | Centrality |
| 1 | Leone, R. D. (2019) | Glutamine blockade induces divergent metabolic programs to overcome tumor immune evasion | Science | 0.55 |
| 2 | Huang, S. C. (2016) | Metabolic reprogramming mediated by the mTORC2-IRF4 signaling axis is essential for macrophage alternative activation | Immunity | 0.52 |
| 3 | Brand, A. (2016) | LDHA-associated lactic acid production blunts tumor immunosurveillance by T and NK cells | Cell Metabolism | 0.5 |
| 4 | Nakaya, M. (2014) | Inflammatory T-cell responses rely on amino acid transporter ASCT2 facilitation of glutamine uptake and mTORC1 kinase activation | Immunity | 0.48 |
| 5 | Cascone, T. (2018) | Increased tumor glycolysis characterizes immune resistance to adoptive T-cell therapy | Cell Metabolism | 0.44 |
| 6 | Ma, X. Z. (2019) | Cholesterol induces CD8+ T-cell exhaustion in the tumor microenvironment | Cell Metabolism | 0.41 |
| 7 | Yang, W. (2016) | Potentiating the antitumour response of CD8(+) T cells by modulating cholesterol metabolism | Nature | 0.39 |
| 8 | Geiger, R. (2014) | L-arginine modulates T-cell metabolism and enhances survival and anti-tumor activity | Cell | 0.37 |
| 9 | Freemerman, A. J. (2014) | Metabolic reprogramming of macrophages: glucose transporter 1 (GLUT1)-mediated glucose metabolism drives a proinflammatory phenotype | The Journal of Biological Chemistry | 0.31 |
| 10 | Bian, Y. (2020) | Cancer SLC43A2 alters T-cell methionine metabolism and histone methylation | Nature | 0.29 |
Table 5: Top 10 references ranked by betweenness centrality in T-lymphocyte metabolic reprogramming research from 2016 to 2025. The table summarizes the top 10 references with the highest betweenness centrality identified through co-citation network analysis using CiteSpace. Betweenness centrality reflects the relative importance of a reference in connecting different research clusters within the bibliometric network. Higher centrality values indicate stronger bridging roles between thematic areas and greater influence on knowledge-network structure.
Keyword Analysis and Temporal Trends
Keyword clustering analysis grouped high-frequency terms into multiple thematic categories (Figure 11A). Among these keywords, “metabolic reprogramming” and “tumor microenvironment” frequently co-occurred, indicating a strong thematic association within the research field. Keywords such as “T cells” and “dendritic cells” also appeared closely associated, reflecting sustained research interest in the roles of immune cells in tumor progression and immunotherapy-related regulation. Temporal trend analysis (Figure 11B and 11C) demonstrated evolving research priorities across the study period. Early studies published between 2016 and 2018 primarily focused on immune-cell activation and glucose metabolism. Research published between 2018 and 2020 increasingly emphasized metabolic regulation of T-cell differentiation and immune function. From 2021 onward, keywords including “DNA methylation,” “oxidative phosphorylation,” and “IDO” appeared more frequently, suggesting growing interest in epigenetic regulation, mitochondrial metabolism, and immune-metabolic signaling pathways within T-lymphocyte research.

Figure 11. Keyword cluster, burst detection, and chronological trend analyses in T-lymphocyte metabolic reprogramming research. (A) Cluster analysis of the top 15 keyword clusters identified through bibliometric analysis. Different colors represent distinct thematic areas. (B) Timeline visualization of the top 10 keyword clusters showing temporal evolution of major research themes. (C) Top 20 burst keywords identified by burst detection analysis. Red bars indicate periods of strong increases in keyword frequency over time. Please click here to view a larger version of this figure.
This bibliometric analysis systematically mapped the global research landscape of T-lymphocyte metabolic reprogramming research based on publications retrieved from the WoSCC. Scientific output and citation impact increased steadily over the study period, with China and the United States identified as the leading contributors to publication productivity and citation influence. Collaboration network analyses demonstrated increasingly interconnected international and institutional research relationships, while also revealing differences between publication volume and citation impact among contributors. The intellectual structure of the field was primarily centered on immune-cell regulation and metabolic reprogramming within the tumor microenvironment, with temporal evolution from studies focused on fundamental immune activation toward investigations of epigenetic regulation, oxidative phosphorylation, and immune-metabolic interactions. Overall, this study provides a structured overview of the development, major contributors, collaborative patterns, and emerging thematic directions within T-lymphocyte metabolic reprogramming research.
Data Availability:
The datasets analyzed in this study were retrieved from the Web of Science Core Collection (WoSCC). The original bibliometric datasets and associated analysis files generated during this study have been provided as supplementary materials and are publicly available through the Zenodo repository at: https://doi.org/10.5281/zenodo.20270392. No restricted, confidential, or personally identifiable data were used in this study.
Our bibliometric analysis of metabolic reprogramming in T cells revealed a sustained increase in research output over time. A noticeable increase in publication and citation counts occurred in 2020, with 40 additional publications and 1,989 additional citations compared with 2019. This increase coincided temporally with several highly cited publications, including Glutamine blockade induces divergent metabolic programs to overcome tumor immune evasion (published November 22, 2019)18, which ranked among the most cited and highest-centrality references in the dataset. This study has been frequently co-cited within the field and is associated with conceptual advances in immunometabolism and tumor immune evasion, potentially contributing to increased scholarly attention during this period. Publication volume subsequently plateaued, except for a distinct increase of 55 articles in 2021, which coincided with the publication of several frequently cited studies. A key publication from that year, Metabolic support of tumor-infiltrating regulatory T cells by lactic acid (published March 2021), highlighted how intracellular metabolic factors influence the antitumor function of T cells19. Another publication, The cancer metabolic reprogramming and immune response (published February 5, 2021), comprehensively summarized how tumor immunity is influenced by metabolites, metabolic enzymes, metabolic pathways, and immune-cell metabolic programming20.
A sharp increase was observed in 2025, when both publication and citation volumes were approximately twice those of the preceding year. The built-in analytical interface of WoSCC was used to further examine the 2025 growth pattern and emerging research hotspots. Major international conferences occurring in 2025 included the 28th Annual Meeting of the American Society of Gene and Cell Therapy, the Annual Meeting of the American Association for Cancer Research, the Annual Meeting of the American Association of Immunologists, the 67th Annual Meeting of the American Society of Hematology, the Annual Meeting of the Society for Investigative Dermatology, and the International Conference of the American Thoracic Society. These conferences accounted for 14.6% (6/41) of major meetings identified during the past decade. These observations may reflect increased academic activity and visibility within the field during this period. The top-ranked article identified in 2025 was entitled tRNA m1A modification regulates cholesterol biosynthesis to promote antitumor immunity of CD8⁺ T cells (published March 2025 in The Journal of Experimental Medicine). This study identified tRNA m1A modification as a metabolic checkpoint in cholesterol biosynthesis and demonstrated its importance in supporting CD8⁺ T-cell function. This observation is consistent with the bibliometric findings indicating increasing research attention toward lipid metabolism in T-cell immunometabolism21.
The top 10 countries by publication volume over the past decade were China, the United States, Germany, the United Kingdom, Italy, Switzerland, France, India, Spain, and Japan, collectively contributing 1,062 publications (56.43% of total output). In 2016, the United States led the field with 25 publications, whereas most other countries contributed fewer than 10 publications annually. The United States entered a relatively high-output phase between 2020 and 2022, followed by a stable plateau and a rebound to 99 publications in 2025. China demonstrated continuous growth after 2021, exceeding 100 publications annually beginning in 2022. By 2025, China’s publication output was 64.9-fold higher than in 2016 and exceeded 358.6% of the publication output of the United States during the same year. Among European countries, Germany demonstrated the highest publication output (133 publications). Switzerland and the Netherlands also showed relatively high research productivity, with Ping-Chih Ho (Switzerland) and Mihai G. Netea (Netherlands) contributing 18 and 12 publications, respectively. Erika L. Pearce from Germany ranked 10th among the most prolific authors (9 publications) and 9th among the most cited authors (281 citations), with a total link strength of 179. These findings indicate increasingly globalized collaboration patterns and expanding international participation in T-cell immunometabolism research.
The top 10 journals by publication volume in this field were Frontiers in Immunology, Cell Metabolism, Nature Communications, Advanced Science, Frontiers in Oncology, International Journal of Molecular Sciences, Cancers, Cell Reports, International Immunopharmacology, and Scientific Reports. Seven of these journals had impact factors ranging from 3 to 7, whereas the remaining three journals had impact factors greater than 10. Cell Metabolism had the highest impact factor (30.9) but ranked eighth by publication volume with 25 publications, whereas Frontiers in Immunology had the highest publication output with 203 publications, averaging approximately 20 publications annually. Notably, the study Foxp3 Reprograms T Cell Metabolism to Function in Low-Glucose, High-Lactate Environments published in Cell Metabolism22 ranked eighth among the top 10 most cited references. However, no publications from Frontiers in Immunology appeared within the top-cited reference list. Four of the top 10 most cited references were published in Cell, Nature, and Science. Immunity ranked second in citation frequency and demonstrated strong representation among highly central references. Two publications among the top 10 references ranked by centrality were published in Immunity, although one was published before 201623,24. In contrast, Cell Metabolism maintained strong citation influence throughout the 2016–2025 study period25,26. Among the 1,882 publications included in this analysis, 1,046 were original research articles and 836 were review articles, representing an unusually high proportion of review articles within the field. Notably, three of the top 10 most cited references were review articles. This pattern may reflect the rapidly evolving nature of T-cell immunometabolism research, which has generated increasing demand for integrative reviews summarizing emerging findings and conceptual developments.
To date, research in this field has primarily focused on the metabolic regulation of T-cell subsets, including effector T cells, memory T cells, and regulatory T cells, with mammalian target of rapamycin representing one of the most frequently investigated signaling pathways. Beyond T cells, increasing research attention has also focused on dendritic cells, which play essential roles in T-cell activation and immune regulation. Bibliometric analysis additionally demonstrated uneven research attention across metabolic pathways. Although amino acid metabolism and glucose metabolism have been extensively investigated, lipid metabolism remains comparatively underexplored despite increasing recent interest. These findings suggest that future investigations may increasingly focus on lipid-mediated immune regulation, metabolic crosstalk within the tumor microenvironment, and epigenetic-metabolic interactions. This bibliometric framework may also assist researchers in identifying emerging immunometabolic themes, influential collaborations, and underexplored therapeutic directions relevant to cancer immunotherapy and immune regulation research.
This study has several limitations. First, data were retrieved exclusively from the WoSCC, which may have resulted in omission of relevant studies indexed in other databases such as Scopus or PubMed, thereby introducing potential selection bias despite the high quality of WoSCC indexing. Second, only English-language publications were included, which may have introduced language bias. Third, citation-based metrics may be influenced by publication age, journal visibility, and citation practices and therefore may not fully reflect scientific quality or clinical relevance. Finally, although multiple bibliometric indicators were applied, more standardized indicators such as the H-index and average citations per article were not included. Future studies integrating multiple databases, additional bibliometric indicators, and longitudinal validation approaches may provide a more comprehensive understanding of the evolving landscape of T-cell immunometabolism research.
Conflicts of Interest:
The authors declare no conflicts of interest related to this work.
Author contrubutions:
Data collection and literature retrieval were performed by Yi Liu. Data preprocessing and bibliometric analyses were conducted by Yinping Yang. Visualization and figure preparation were performed by Xinyue Yang and Jinquan Li. The first draft of the manuscript was written by Yi Liu and Weihong Li. All authors contributed to manuscript revision and approved the final submitted version.
The authors gratefully acknowledge financial support from the Fundamental Research Funds for the Central Universities (2022-JYB-JBZR-037).
| Name | Company | Catalog Number | Comments |
|---|---|---|---|
| CiteSpace | Drexel University | v.5.7.R2 | SCR_025121 |
| Microsoft Excel | Microsoft Corporation | v.2604 Build 16.0.19929.20136 | SCR_016137 (Microsoft Excel) |
| WPS Excel | Kingsoft Office | v.12.1.0.26375 | |
| Scimago Graphica | Scimago Lab | v.1.0.53 | Not available |
| VOSviewer | Leiden University | v.1.6.20 | SCR_023516 |
| Web of Science Core Collection | Clarivate Analytics | accessed on January 27, 2026; version not applicable | Not available |
| Windows Operating System | Microsoft Corporation | Windows 10 | Not available |
Request permission to reuse the text or figures of this JoVE article
Request Permission